. 2014 May 6;19(5):872-82.
doi: 10.1016/j.cmet.2014.03.010. Epub 2014 Apr 17.

Pancreatic β cell dedifferentiation in diabetes and redifferentiation following insulin therapy

Affiliations

Pancreatic β cell dedifferentiation in diabetes and redifferentiation following insulin therapy

Zhiyu Wang et al. Cell Metab. .

Abstract

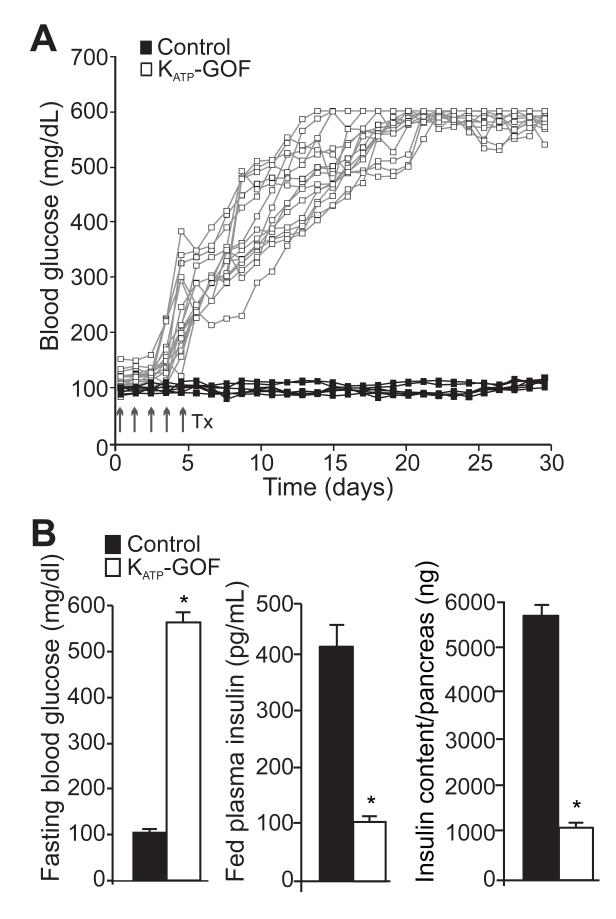
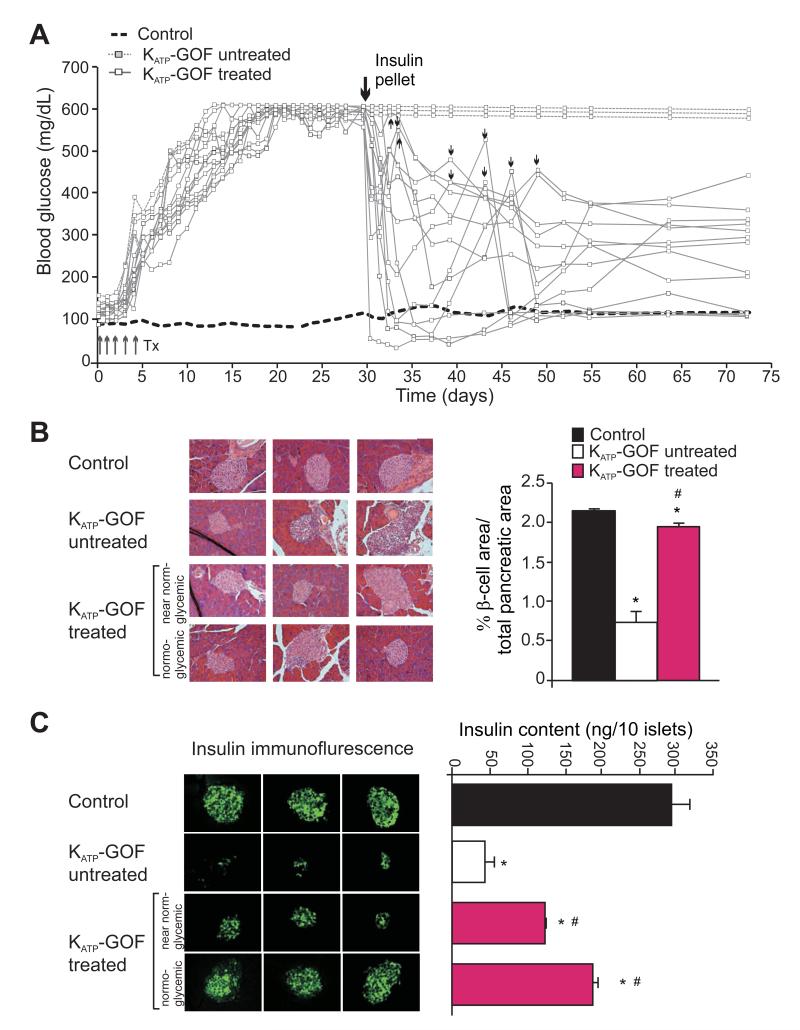
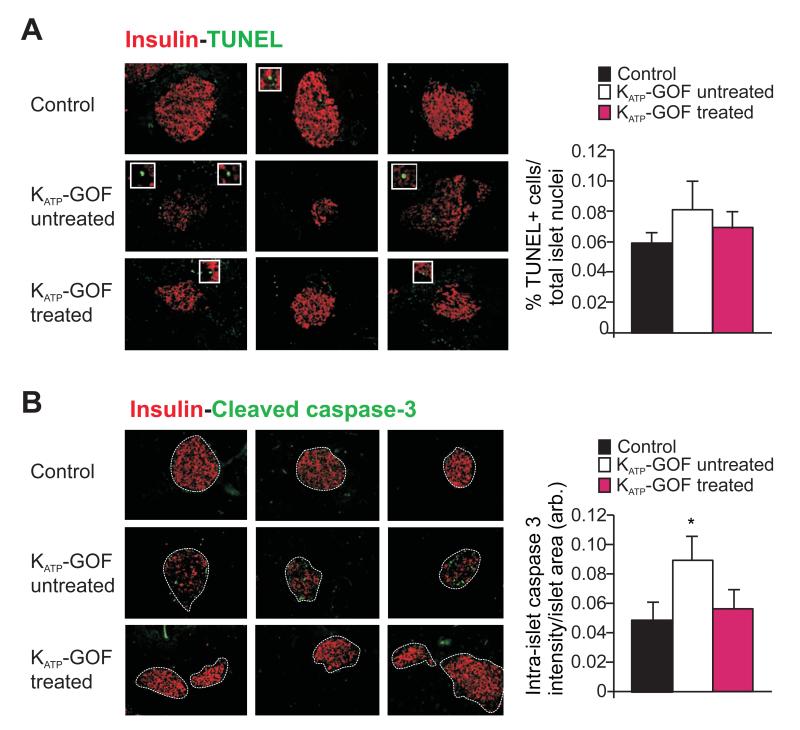
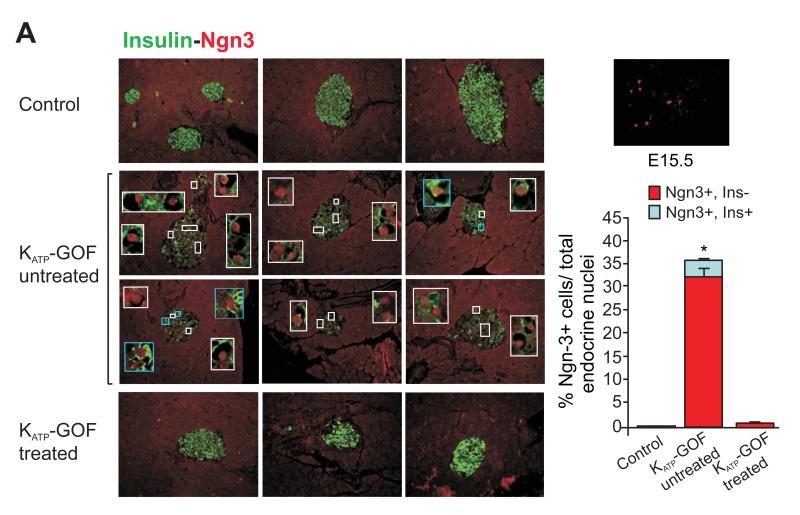
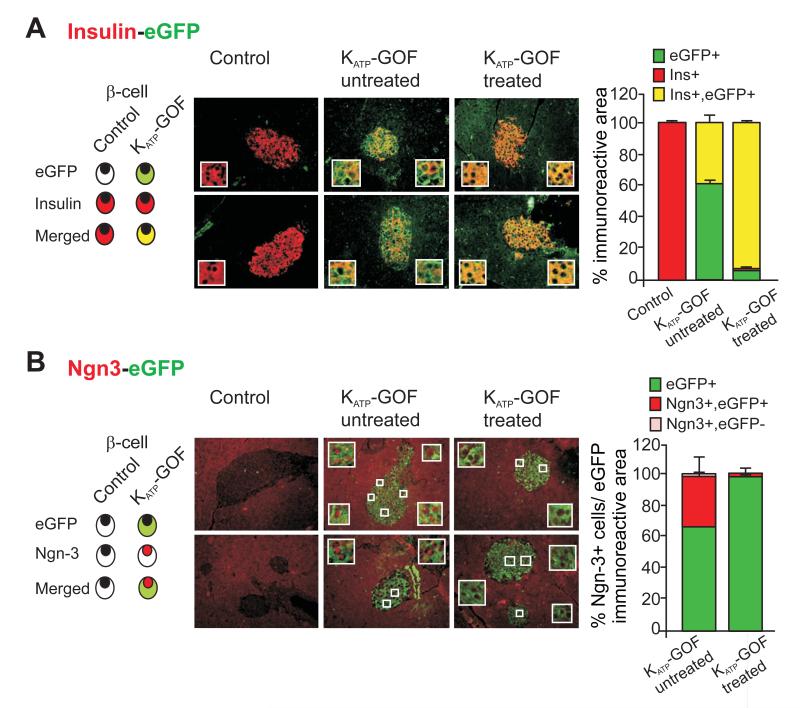
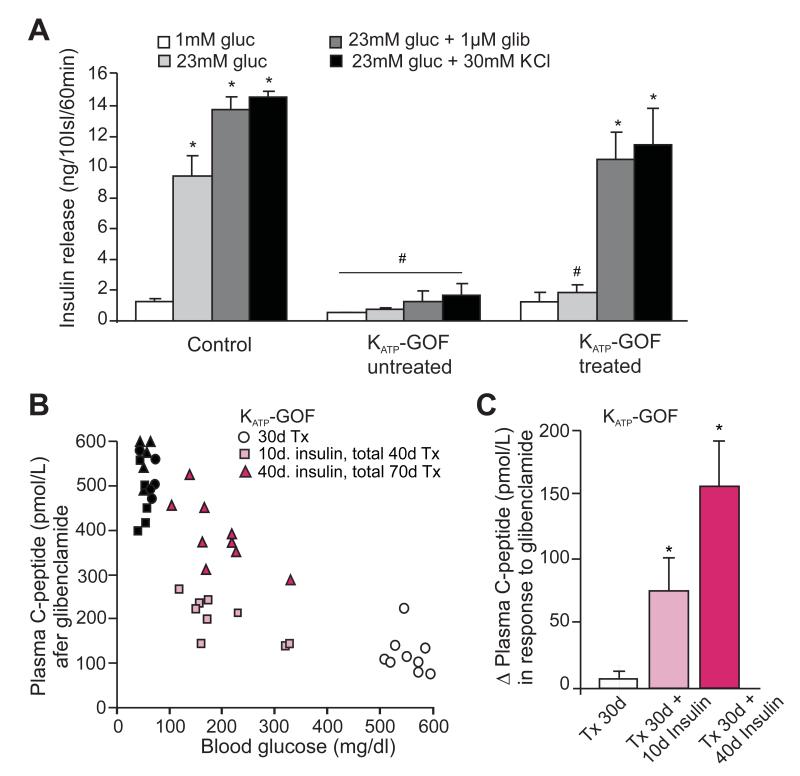
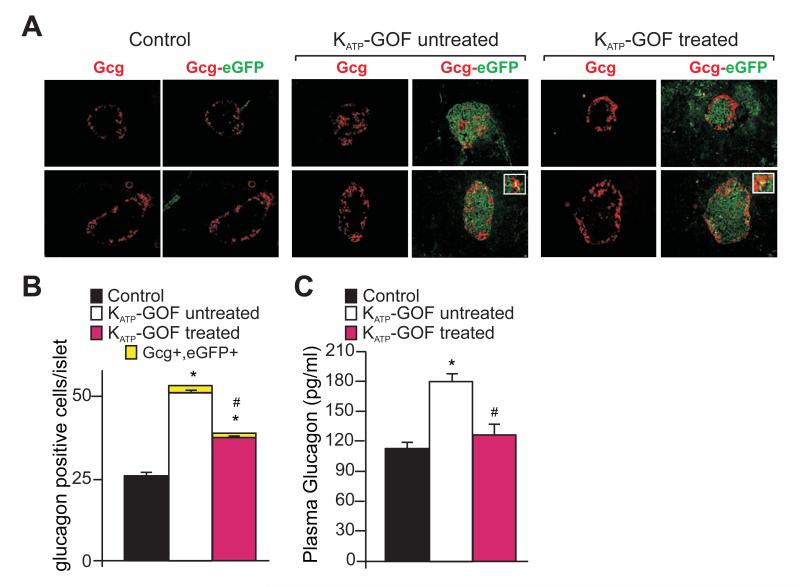
Diabetes is characterized by "glucotoxic" loss of pancreatic β cell function and insulin content, but underlying mechanisms remain unclear. A mouse model of insulin-secretory deficiency induced by β cell inexcitability (K(ATP) gain of function) demonstrates development of diabetes and reiterates the features of human neonatal diabetes. In the diabetic state, β cells lose their mature identity and dedifferentiate to neurogenin3-positive and insulin-negative cells. Lineage-tracing experiments show that dedifferentiated cells can subsequently redifferentiate to mature neurogenin3-negative, insulin-positive β cells after lowering of blood glucose by insulin therapy. We demonstrate here that β cell dedifferentiation, rather than apoptosis, is the main mechanism of loss of insulin-positive cells, and redifferentiation accounts for restoration of insulin content and antidiabetic drug responsivity in these animals. These results may help explain gradual decrease in β cell mass in long-standing diabetes and recovery of β cell function and drug responsivity in type 2 diabetic patients following insulin therapy, and they suggest an approach to rescuing "exhausted" β cells in diabetes.


Figures

Figure 1
Figure 1. KATP-GOF mice develop profound diabetes
(A) Fed blood glucose (individual traces) from control (black squares) and KATP-GOF (white squares) mice after tamoxifen induction of transgene expression. (B) Fasting blood glucose, plasma insulin and total insulin content per pancreas in control (black) and KATP-GOF (white) mice 30 days after tamoxifen induction (n=10-12 mice per group, mean + SEM, * p<0.05, with respect to control).
Figure 2
Figure 2. Insulin therapy restores endogenous insulin content in diabetic KATP-GOF mice
(A) Fed blood glucose in control (average, black dashed line) and in KATP-GOF untreated (white, dashed line) and insulin-treated (white, solid line) mice after tamoxifen induction of transgene expression. Big arrow indicates first insulin pellet implantation, and small arrows a second insulin pellet implanted in individual mice as necessary (blood glucose >400mg/dl). (B) (left panels) High magnification sections of pancreases stained with hematoxylin-eosin from control and KATP-GOF untreated and insulin-treated mice. (right panels) Pancreatic β-cell area (from panel C below) in control (black) KATP-GOF untreated (white) and insulin-treated (pink) mice. (C) (left panels) Insulin immunofluorescence and (right panel) insulin content per islet in control (black) and KATP-GOF mice, untreated 30 days after tamoxifen injection (white), and insulin-treated (70 days after tamoxifen, 40 days after insulin pellet implantation, pink) (n=3-6 mice per group, mean + SEM). Insulin-treated KATP-GOF mice were divided in two groups at the time of sacrifice following the criteria of blood glucose levels: near normoglycemic and normoglycemic. Significant differences *p<0.05 with respect to control and #p<0.05 with respect to untreated KATP-GOF mice.
Figure 3
Figure 3. Small increase in apoptosis in KATP-GOF diabetic mice
(A,B) (left panels) Representative pancreatic sections (left) and (right panel) quantification of apoptosis from control (black) and KATP-GOF untreated (white) and insulin-treated (pink) mice immunostained for insulin (red) and apoptosis (green) using TUNEL (A) and cleaved caspase-3 (B). Data represent n=4 mice per group, 5 pancreatic sections per mouse. (* p<0.05 with respect to control).
Figure 4
Figure 4. β-cell dedifferentiation in severely diabetic KATP-GOF mice and dramatic β-cell re-differentiation in islets from KATP-GOF insulin-treated mice
(left panels) Representative pancreatic sections from control and KATP-GOF untreated and insulin-treated mice double immunostained for insulin (green) and Ngn3 (Santa Cruz antibody, red). White bordered insets show Ngn3 positive and insulin-negative cells within islets. Blue bordered insets show occasional Ngn3 positive and insulin-positive cells. (top right) Ngn3 positivity in E15.5 fetal tissue. (bottom right) Percentage of Ngn3 positive cells, either insulin negative (red) or insulin positive (light blue from each condition (mean + s.e.m). Data represent n=5-8 mice per group, 5 pancreatic sections per mouse. *Significant differences p<0.05 with respect to control and KATP-GOF insulin-treated mice.
Figure 5
Figure 5. Dedifferentiated and re-differentiated islet cells are originated from former adult β-cells
(A,B) (left panels) Representative images of double immunostaining for eGFP (indicating transgene expression in pancreatic β-cells) and insulin (A) or Ngn3 (B) on pancreatic sections from control and both untreated and insulin-treated KATP-GOF mice. Insets show representative cells. (right panels) Percentage immunopositive area of the islet insulin and eGFP (A), or for Ngn3 and eGFP (mean ± s.e.m) (B). Data represent n=5 mice per group, 5 pancreatic sections per mouse.
Figure 6
Figure 6. Glibenclamide-dependent C-peptide release is restored only in KATP-GOF insulin-treated mice
(A) Insulin secretion from islets isolated from control and KATP-GOF untreated and insulin-treated mice (70 days after tamoxifen, ~40 days on insulin therapy). Islets were incubated in low (1mM) and high (23mM) glucose, and in the presence of the sulfonylurea glibenclamide (1μM) or the depolarizing agent KCl (30mM). Significant differences #p<0.05 with respect to control under the same condition and *p<0.05 with respect to 1mM glucose within the same group. (B) Plasma C-peptide (individual values) 30 min. after glibenclamide stimulation in control (30 days after Tx: black circles; 40 days after Tx: black squares, and 70 days after Tx: black triangles), KATP-GOF untreated 30 days after tamoxifen injection (white, 30 days after Tx, 30d) and KATP-GOF treated with insulin for 10 days (10d insulin, total 40 days after Tx, light pink) and 40 days (40d insulin, total 70 days after Tx, dark pink), mice. (C) Delta plasma C-peptide in response to glibenclamide in KATP-GOF untreated (white) and KATP-GOF insulin-treated (10 and 40 days, light and dark pink, respectively), mice (n=5-9 mice per group, experiments made in triplicates, mean + SEM). Significant differences *p<0.05 with respect to KATP-GOF untreated mice.
Figure 7
Figure 7. Increased α-cell number and plasma glucagon in KATP-GOF mice
(A) Representative images of double immunostaining for eGFP (indicating transgene expression in pancreatic β-cells) and glucagon on pancreatic sections from control and both untreated and insulin-treated KATP-GOF mice. White bordered insets show co-staining for both glucagon and eGFP. Quantification of glucagon positive cells (B) and plasma glucagon (C) from control (black) and KATP-GOF untreated (white) and insulin-treated (pink) mice (mean + SEM). Data represent n=5 mice per group, 5 pancreatic sections per mouse. Significant differences *p<0.05 with respect to control and #p<0.05 with respect to untreated KATP-GOF mice.

References

    1. Ahlqvist E, Ahluwalia TS, Groop L. Genetics of type 2 diabetes. Clin Chem. 2011;57:241–254. - PubMed
    1. Ahren B. Type 2 diabetes, insulin secretion and beta-cell mass. Curr Mol Med. 2005;5:275–286. - PubMed
    1. Alvarsson M, Sundkvist G, Lager I, Berntorp K, Fernqvist-Forbes E, Steen L, Orn T, Holberg MA, Kirksaether N, Grill V. Effects of insulin vs. glibenclamide in recently diagnosed patients with type 2 diabetes: a 4-year follow-up. Diabetes Obes Metab. 2008;10:421–429. - PubMed
    1. Alvarsson M, Sundkvist G, Lager I, Henricsson M, Berntorp K, Fernqvist-Forbes E, Steen L, Westermark G, Westermark P, Orn T, et al. Beneficial effects of insulin versus sulphonylurea on insulin secretion and metabolic control in recently diagnosed type 2 diabetic patients. Diabetes Care. 2003;26:2231–2237. - PubMed
    1. Benninger RK, Remedi MS, Head WS, Ustione A, Piston DW, Nichols CG. Defects in beta cell Ca(2)+ signalling, glucose metabolism and insulin secretion in a murine model of K(ATP) channel-induced neonatal diabetes mellitus. Diabetologia. 2011;54:1087–1097. - PMC - PubMed

Publication types

MeSH terms