. 2014 May 6;22(5):781-90.
doi: 10.1016/j.str.2014.03.004. Epub 2014 Apr 17.

Mass spectrometry defines the C-terminal dimerization domain and enables modeling of the structure of full-length OmpA

Affiliations

Mass spectrometry defines the C-terminal dimerization domain and enables modeling of the structure of full-length OmpA

Julien Marcoux et al. Structure. .

Abstract

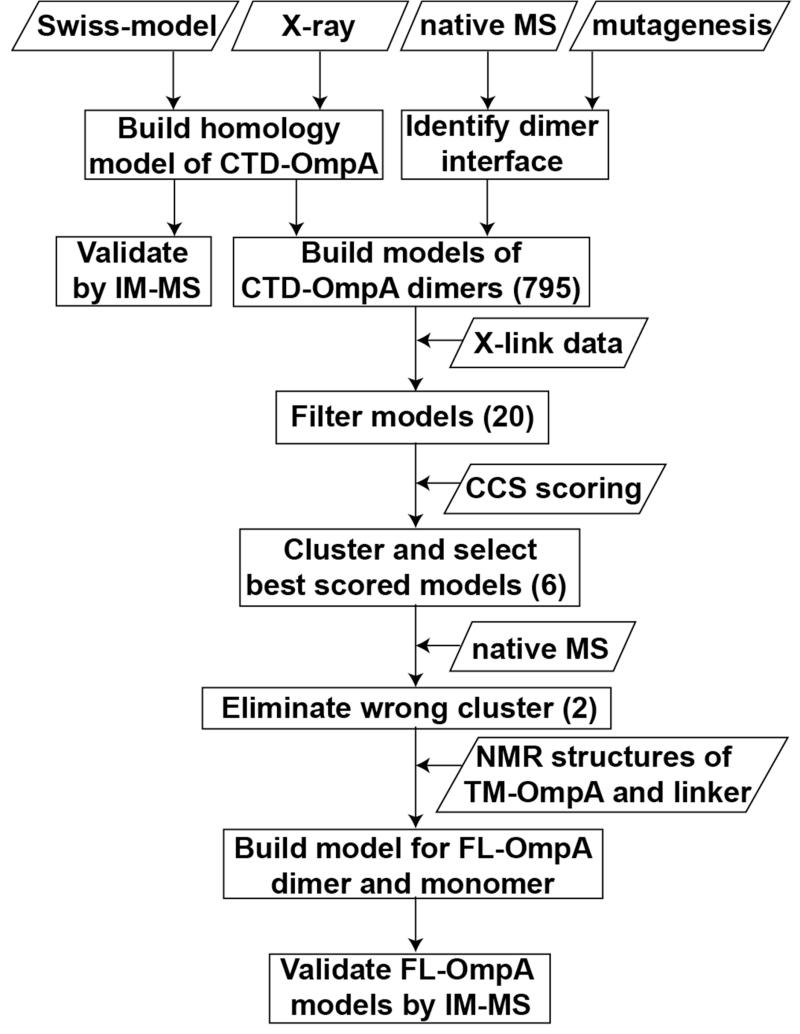
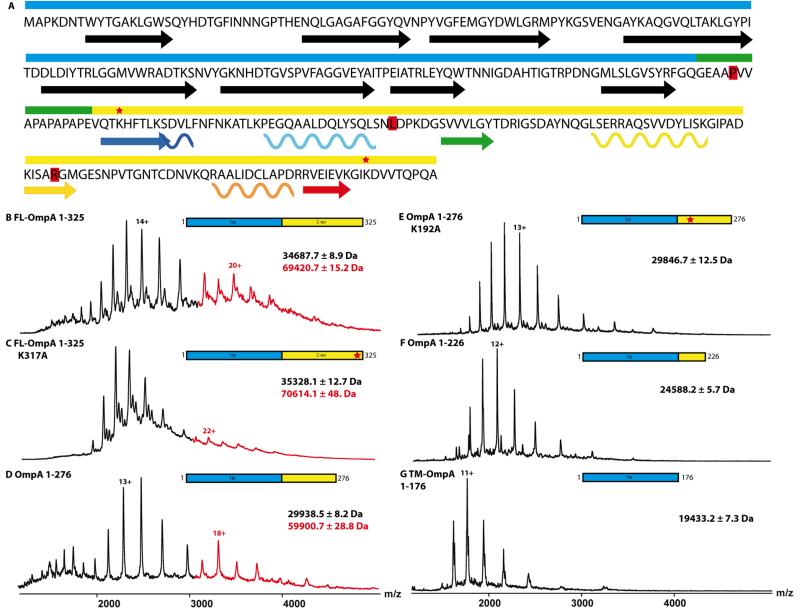
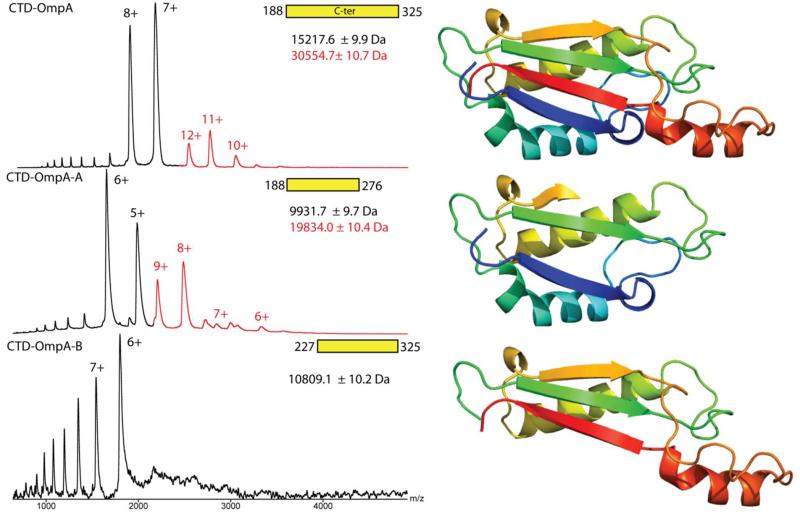
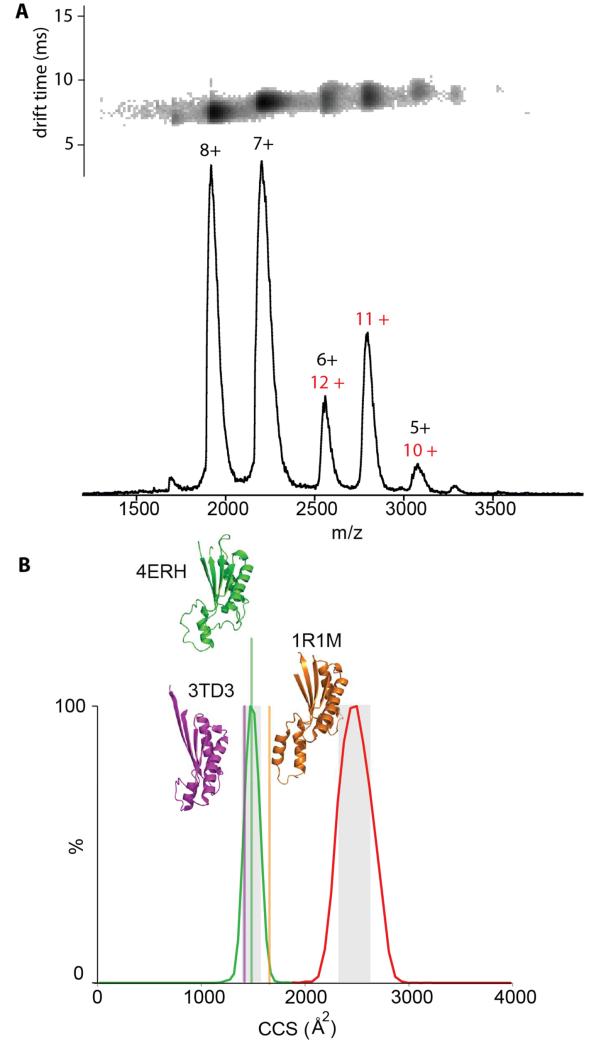
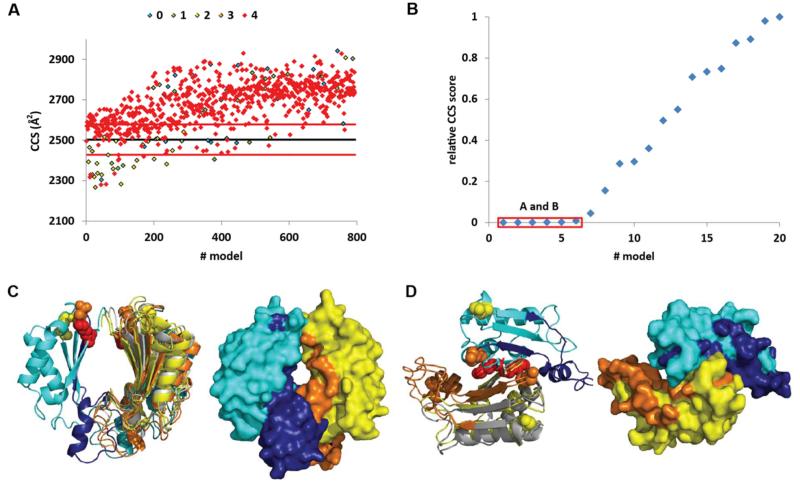
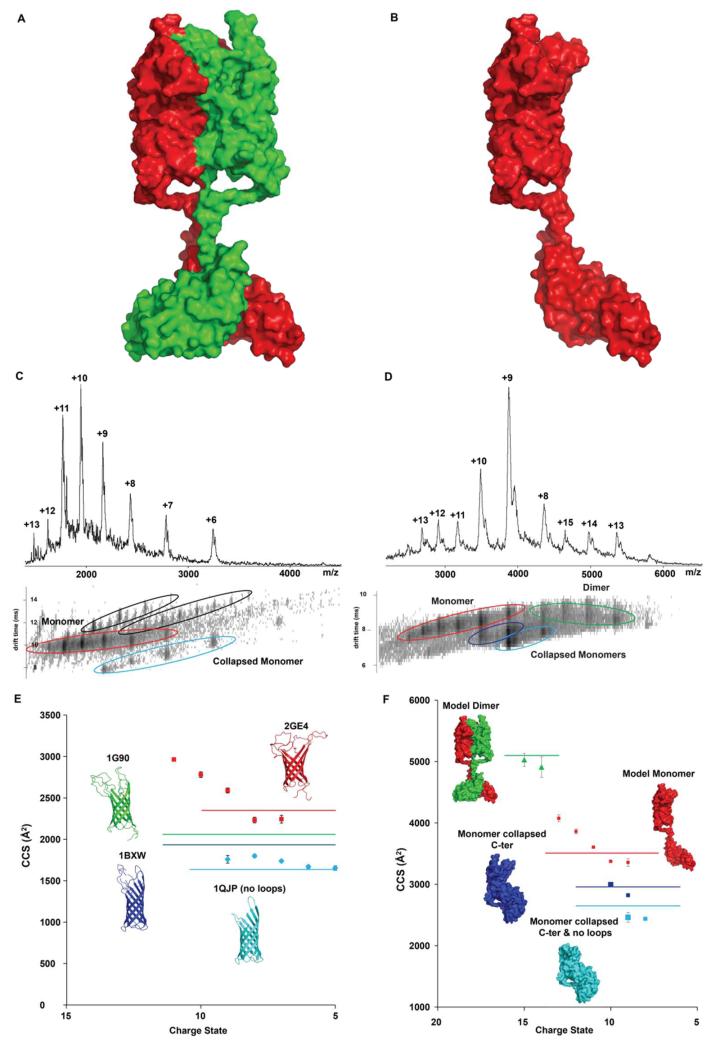
The transmembrane domain of the outer membrane protein A (OmpA) from Escherichia coli is an excellent model for structural and folding studies of β-barrel membrane proteins. However, full-length OmpA resists crystallographic efforts, and the link between its function and tertiary structure remains controversial. Here we use site-directed mutagenesis and mass spectrometry of different constructs of OmpA, released in the gas phase from detergent micelles, to define the minimal region encompassing the C-terminal dimer interface. Combining knowledge of the location of the dimeric interface with molecular modeling and ion mobility data allows us to propose a low-resolution model for the full-length OmpA dimer. Our model of the dimer is in remarkable agreement with experimental ion mobility data, with none of the unfolding or collapse observed for full-length monomeric OmpA, implying that dimer formation stabilizes the overall structure and prevents collapse of the flexible linker that connects the two domains.


Figures

Figure 1
Figure 1. Flow diagram of hybrid experimental and modeling approaches to generate models of full-length OmpA
A model of CTD-OmpA was generated with SwissModel and 795 models of the corresponding dimer were generated with SymmDock. Each model was filtered based on cross-linking data and scored with IM-MS data. The best representative was selected to model FL-OmpA by building chimeras based on the NMR structure of TM-OmpA (1G90) and of the homologous linker from 2K0L. The models of FL-OmpA were finally validated by IM-MS see also Figure S1.
Figure 2
Figure 2. The C-terminal domain of OmpA is responsible for partial dimerization
(A) FL-OmpA is composed of a N-terminal transmembrane β-barrel (cyan) and a periplasmic C-terminal domain (yellow) separated by a proline-rich linker (green). The 8 strands of the barrel are represented by black arrows and the secondary structure helices and strands of the CTD are color-coded as seen in Figure 3. The residues highlighted in red represent the locations of the STOP mutations inserted at P177, L227 and R277. (B-G) Mass spectra obtained from native solution conditions for the different transmembrane constructs. The peaks corresponding to the dimer are highlighted in red. All constructs were sprayed at concentration between 10 μM (FL-OmpA) and 30 μM (TM-OmpA) see also Figure S2 and Table S1. The red stars indicate lysines 192 and 317 that were changed to alanines in some constructs.
Figure 3
Figure 3. Residues 188-276 of the CTD are sufficient to form a dimer interface
Spectra obtained under native conditions for the soluble C-terminal constructs of OmpA after cleavage of the 27 N-terminal residues (MBP+6-His tag) by the TEV protease. The corresponding structural models (based on PDB file 4ERH) are represented on the right. CTD-OmpA and CTD-OmpA-A but not CTD-OmpA-B were able to form a population of dimers (red) see also Figure S3.
Figure 4
Figure 4. Evaluation of monomer and dimer models of CTD-OmpA by ion-mobility MS
(A) Native mass spectrum of CTD-OmpA showing both monomer (charge states 8+ to 5+ black) and dimer (charge states 12+ to 10+ red). The inset shows the drift time obtained for each charge state. (B) Arrival time distributions converted to CCS for the charge states 7+ of the monomer (green) and 11+ of the dimer (red). Vertical lines show the CCSs calculated for our model of CTD-OmpA (green based on PDB file 4ERH from S. enterica) and from the PDB files 3TD3 (magenta from A. baumannii) and 1R1M (orange RmpM from N. meningitidis). The grey shaded area shows the ± 6% experimental error see also Figure S4.
Figure 5
Figure 5. Scoring the SymmDock models of the CTD dimer
(A) Plot of the CCS calculated for each dimer model. The cross-link scores are color coded (blue, green, yellow, orange and red diamonds corresponding to 0,1,2,3 and 4 penalties, respectively). The black line represents the experimental value obtained for the dimer of CTD-OmpA and the red lines show the ± 3% experimental error. (B) Plot of the CCS score obtained for the 20 models with no cross-link penalty. The red box shows the models with a score <1% of the highest score. (C) and (D) represent the two clusters observed amongst these lowest score models (solutions A and B, respectively). The regions colored dark blue and orange correspond to residues 277-325 which are not required for dimer formation see also Figure S5 and Table S2.
Figure 6
Figure 6. Experiment-supported models of FL-OmpA
(A) dimer and (B) monomer models of FL-OmpA. (C) Mass spectrum and mobility contour plot for TM-OmpA showing, apart from detergent clusters (black), two different conformations: extended (red) and more compact (cyan). (D) Mass spectrum and mobility contour plot for FL-OmpA showing the presence of four different conformations: an extended monomer (red), two compact monomers (blue) and a dimer (green). (E) CCS values obtained for each charge state of the two TM conformers. The horizontal lines show the theoretical values calculated based on PDB files 2GE4 (red), 1G90 (green), 1BXW (dark blue) and 1QJP (cyan). Error bars are calculated from average CCS determined at 5 different drift voltages. (F) CCS values obtained for each charge state of the different FL conformers. The horizontal lines show the theoretical CCS values calculated for the models proposed here: monomer (red), dimer (green) and models for collapsed monomers with (blue) and without (cyan) the external loops. Error bars are calculated from average CCS determined at 5 different drift voltages.

Comment in

References

    1. Arora A, Abildgaard F, Bushweller JH, Tamm LK. Structure of outer membrane protein A transmembrane domain by NMR spectroscopy. Nat Struct Biol. 2001;8:334–338. - PubMed
    1. Arora A, Rinehart D, Szabo G, Tamm LK. Refolded outer membrane protein A of Escherichia coli forms ion channels with two conductance states in planar lipid bilayers. J Biol Chem. 2000;275:1594–1600. - PubMed
    1. Baldwin AJ, Lioe H, Hilton GR, Baker LA, Rubinstein JL, Kay LE, Benesch JL. The polydispersity of alphaB-crystallin is rationalized by an interconverting polyhedral architecture. Structure. 2011;19:1855–1863. - PubMed
    1. Barrera NP, Isaacson SC, Zhou M, Bavro VN, Welch A, Schaedler TA, Seeger MA, Miguel RN, Korkhov VM, van Veen HW, et al. Mass spectrometry of membrane transporters reveals subunit stoichiometry and interactions. Nat Methods. 2009;6:585–587. - PMC - PubMed
    1. Barrera NP, Zhou M, Robinson CV. The role of lipids in defining membrane protein interactions: insights from mass spectrometry. Trends Cell Biol. 2012 - PubMed

Publication types

MeSH terms

Substances

LinkOut - more resources