. 2014 Jun;17(6):876-83.
doi: 10.1038/nn.3702. Epub 2014 Apr 20.

Executive control processes underlying multi-item working memory

Affiliations

Executive control processes underlying multi-item working memory

Antonio H Lara et al. Nat Neurosci. 2014 Jun.

Abstract

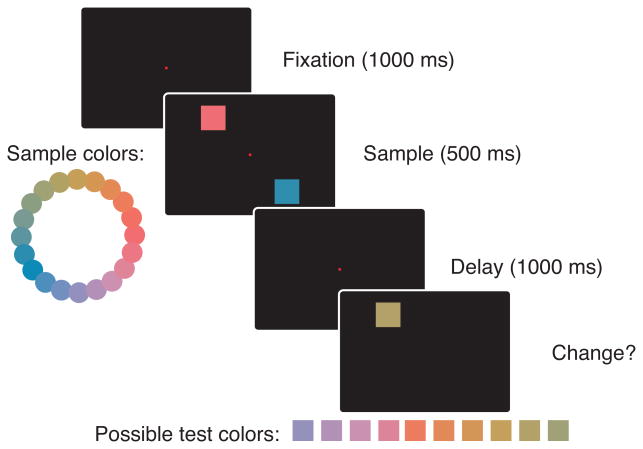
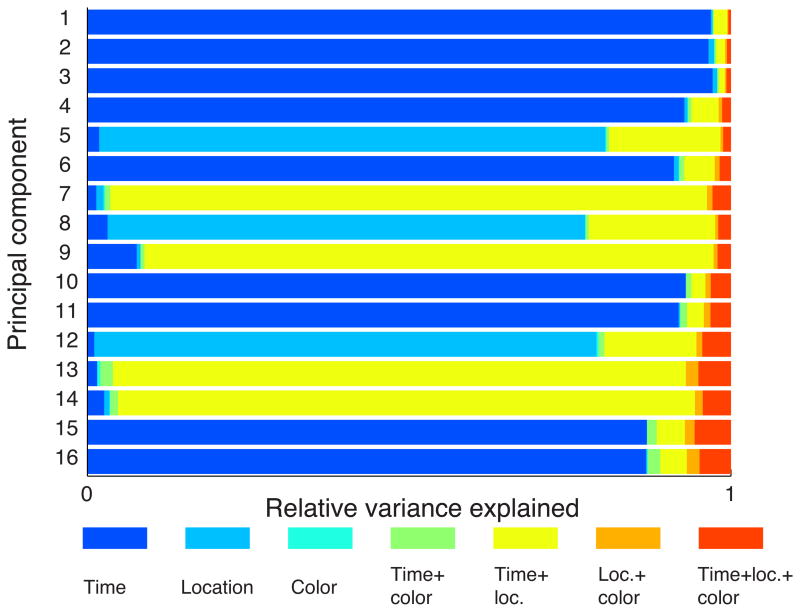
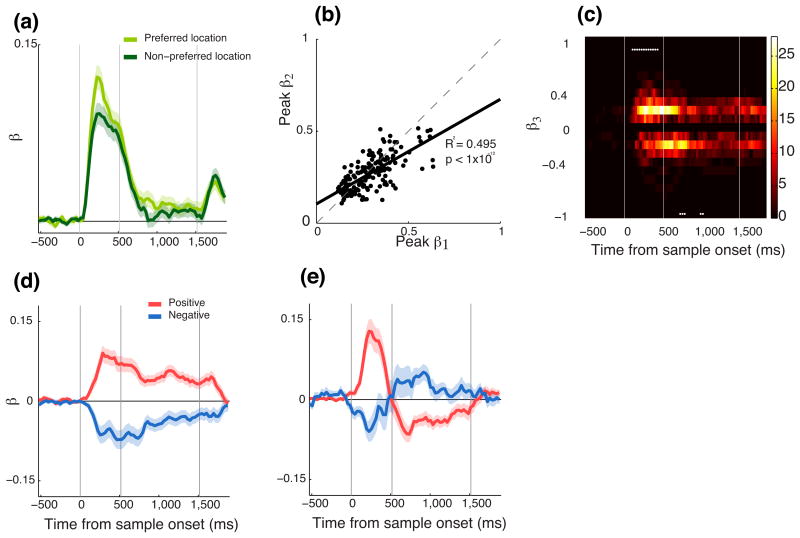
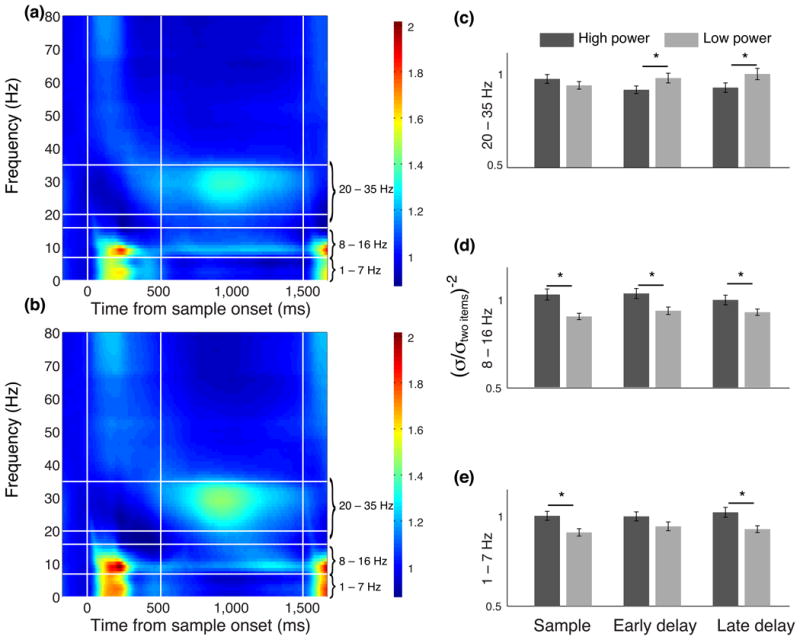
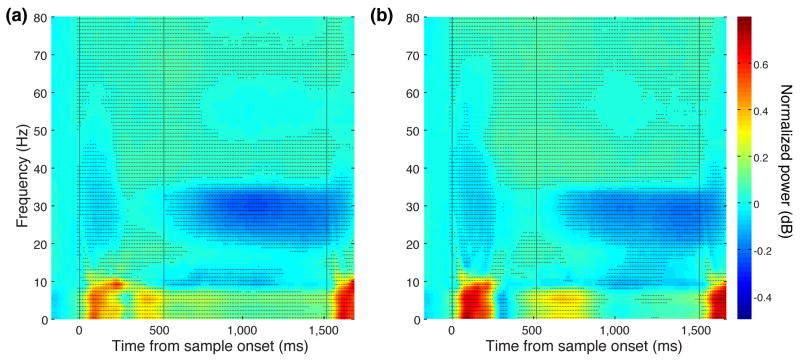
A dominant view of prefrontal cortex (PFC) function is that it stores task-relevant information in working memory. To examine this and determine how it applies when multiple pieces of information must be stored, we trained two subjects to perform a multi-item color change detection task and recorded activity of neurons in PFC. Few neurons encoded the color of the items. Instead, the predominant encoding was spatial: a static signal reflecting the item's position and a dynamic signal reflecting the subject's covert attention. These findings challenge the notion that PFC stores task-relevant information. Instead, we suggest that the contribution of PFC is in controlling the allocation of resources to support working memory. In support of this, we found that increased power in the alpha and theta bands of PFC local field potentials, which are thought to reflect long-range communication with other brain areas, was correlated with more precise color representations.


Conflict of interest statement

The authors have no competing interests.

Figures

Figure 1
Figure 1
Multi-item color working memory task. Subjects fixated on a central fixation spot for 1000-ms, after which one or two colored squares appeared on the screen for 500-ms. The squares could appear at any of four fixed positions on the screen. Subjects were required to keep both colors in working memory until a test item appeared 1000-ms later. Subjects indicated whether the color at the location of the test item changed or remained the same. The color of the test item was systematically varied from very similar to very different with respect to the sample item: the size of the color change was calculated as ΔE (see Methods).
Figure 2
Figure 2
(a) Subjects' mean behavioral performance (± s.e.m., error bars are smaller than the marker) for one-item trials for which ΔE ≥ 80. The distance from the center to the marker indicates mean performance and the color of the marker indicates the color of the item during the sample epoch. Subjects performed well above chance (50%) for all colors at detecting whether or not the color had changed. (b) Performance for different values of ΔE for one- and two-item trials. Performance was significantly worse for two-item trials compared to one-item trials (2-way ANOVA, F1,616=180, p < 1 × 10-30). Additionally, performance was worse for trials with small ΔE compared to trials with larger ΔE (2-way ANOVA, F3,616= 99, p < 1 × 10-50) and there was a significant set-size x ΔE interaction (2-way ANOVA, F3,616= 11, p < 1 × 10⁻⁶).
Figure 3
Figure 3
Percentage of explained variance (PEV) across time for all neurons calculated using a sliding ANOVA. Each row represents the PEV of a single neuron. Neurons are sorted based on the time they show a significant PEV. Vertical white lines indicate the onset of the sample stimulus, the beginning of the delay and the onset of the test stimulus. The PEV on one-item trials that is attributable to the color of the item, when colors are either (a) assessed independently or (b) grouped. (c) The PEV attributable to the location of the item on one-item trials.
Figure 4
Figure 4
(a-p). Projections of the 507 neurons into the top 16 dPCs for one-item trials. The color of the lines represents the location of the item during the sample period; the different shades of the colors represent the color of the item. Colors were grouped into four groups as in the previous analysis (Figure 3b). Vertical lines indicate the onset of the sample stimulus, the delay and the test stimulus.
Figure 5
Figure 5
Relative contribution of time, item color, item location and non-linear mixtures of these parameters to the variance in the population's firing rates for one-item trials to each principal component. Only the top 16 dPCs are shown.
Figure 6
Figure 6
Standardized beta values from the sliding regression model. (a) Average β1 and β2 values, corresponding to the preferred and non-preferred locations determined from the one item-conditions. (b) Plot of peak β1 vs. peak β2 for all neurons. The neurons preferred location had a larger influence (β1) on the two-item response compared to the less preferred location (β2). The solid black line shows a least squares fit. (c) Pseudo-color plot showing the distribution of β3-values across the population as a function of time. Each column in the plot corresponds to a single distribution of the β3 value for the 215 neurons at that time bin. The color bar indicates the number of neurons that had a particular β-value. Only neurons with a significant β3 were included. The white asterisks indicate time bins for which the distribution of β3 values is significantly different from zero. Average β3 values for (d) the subpopulation of neurons for which the β3-value did not switch sign and (e) for the neurons for which the β3-value did change sign. The red trace denotes the neurons that had an initial positive β3-value while the blue trace indicates those neurons that had an initial negative β3-value. The shaded color region around the traces denotes the s.e.m.
Figure 7
Figure 7
Average time-frequency power spectrum relative to baseline (500-ms before sample onset) for (a) one-item trials and (b) two-item trials. The frequency bands that showed the largest change in power are indicated by the horizontal white lines and are labeled on the right margin of the plots. Vertical lines indicate the times of sample, delay and test onset. (c-e) Normalized precision in three different trial epochs calculated using either high or low power trials in three frequency bands. The asterisks indicate a significant difference between high and low power trials (t-test, p <0.01).
Figure 8
Figure 8
Average difference in LFP power between electrodes with spatially selective neurons and electrodes without spatially selective neurons. Data are shown separately for a) one-item trials and b) two-item trials. Black stippling denotes the points where the difference is significant (permutation test, p < 0.01).

References

    1. Constantinidis C, Franowicz MN, Goldman-Rakic PS. The sensory nature of mnemonic representation in the primate prefrontal cortex. Nat Neurosci. 2001;4:311–316. - PubMed
    1. Funahashi S, Chafee MV, Goldman-Rakic PS. Prefrontal neuronal activity in rhesus monkeys performing a delayed anti-saccade task. Nature. 1993;365:753–756. - PubMed
    1. Rao SC, Rainer G, Miller EK. Integration of what and where in the primate prefrontal cortex. Science. 1997;276:821–824. - PubMed
    1. Asaad WF, Rainer G, Miller EK. Task-specific neural activity in the primate prefrontal cortex. J Neurophysiol. 2000;84:451–459. - PubMed
    1. Cowan N. The magical number 4 in short-term memory: a reconsideration of mental storage capacity. Behav Brain Sci. 2001;24:87–114. discussion 114-185. - PubMed

Publication types