. 2014 Jun;17(6):851-7.
doi: 10.1038/nn.3707. Epub 2014 Apr 20.

Population code in mouse V1 facilitates readout of natural scenes through increased sparseness

Affiliations

Population code in mouse V1 facilitates readout of natural scenes through increased sparseness

Emmanouil Froudarakis et al. Nat Neurosci. 2014 Jun.

Abstract

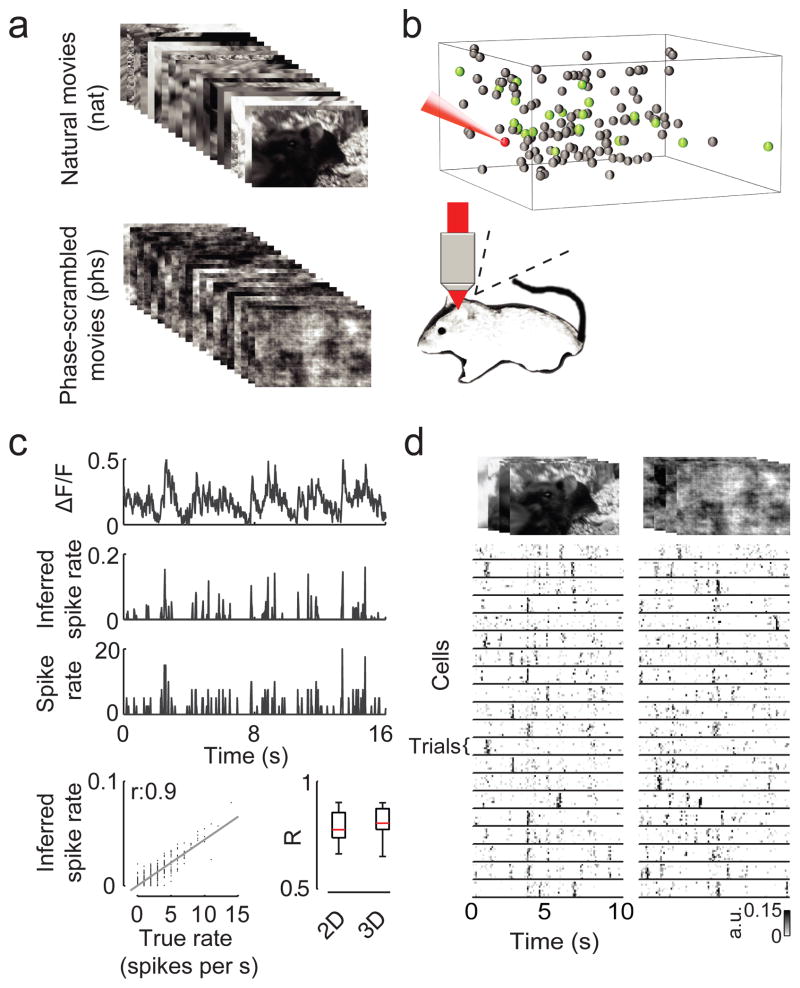
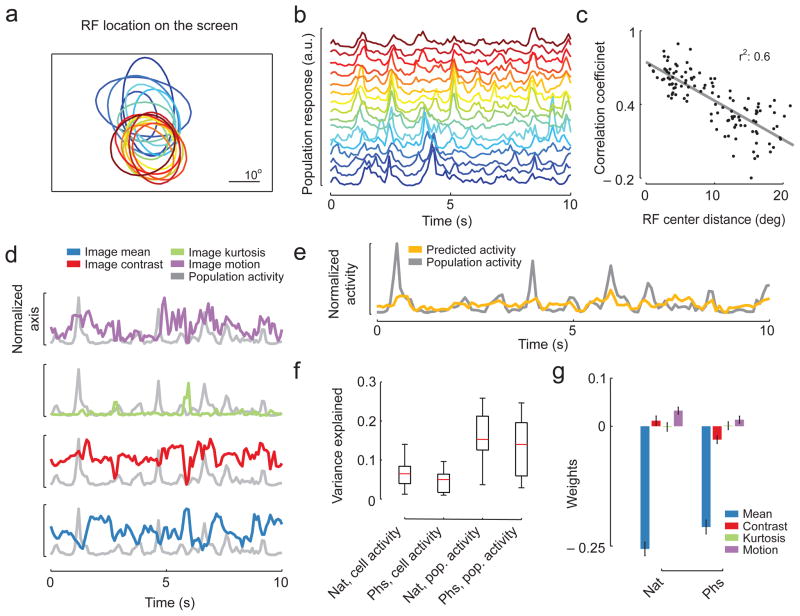
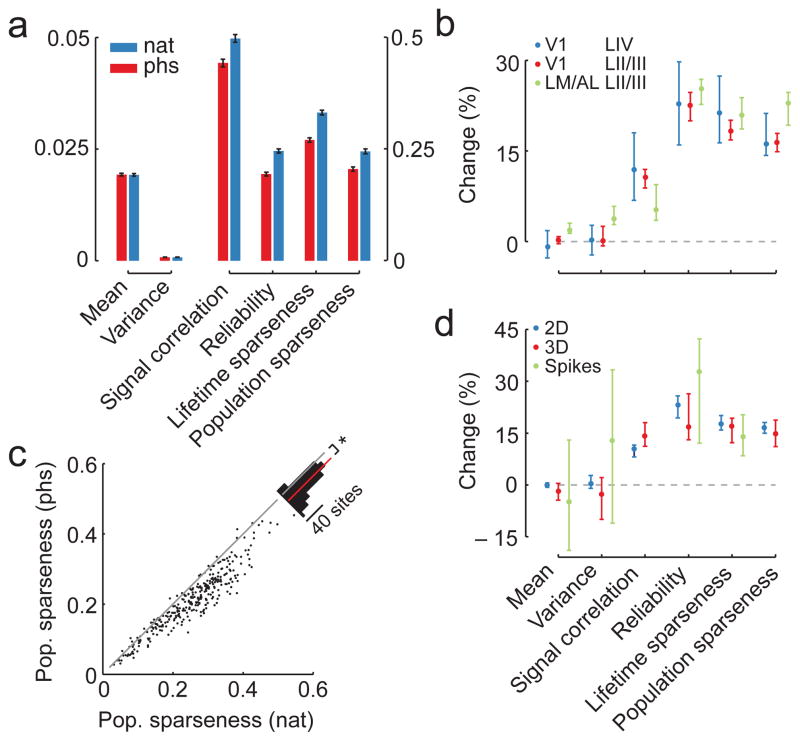
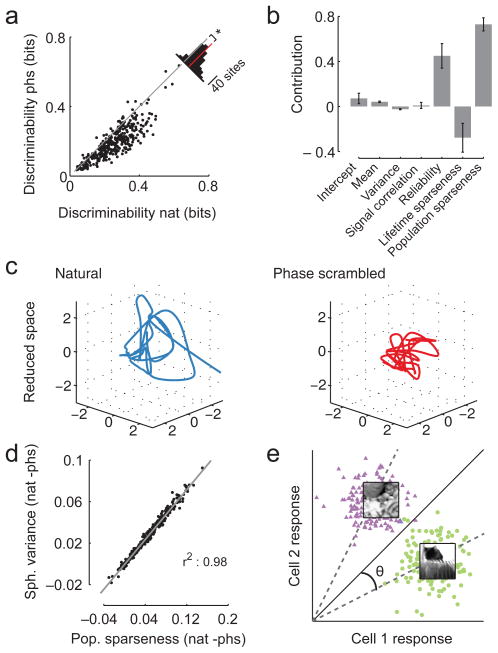
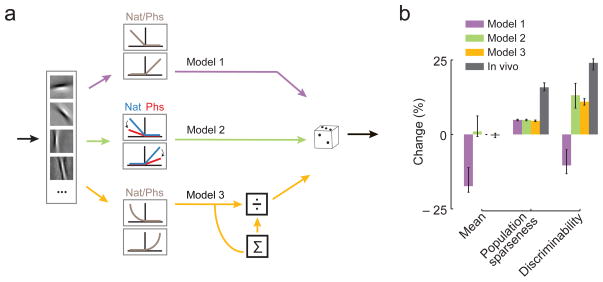
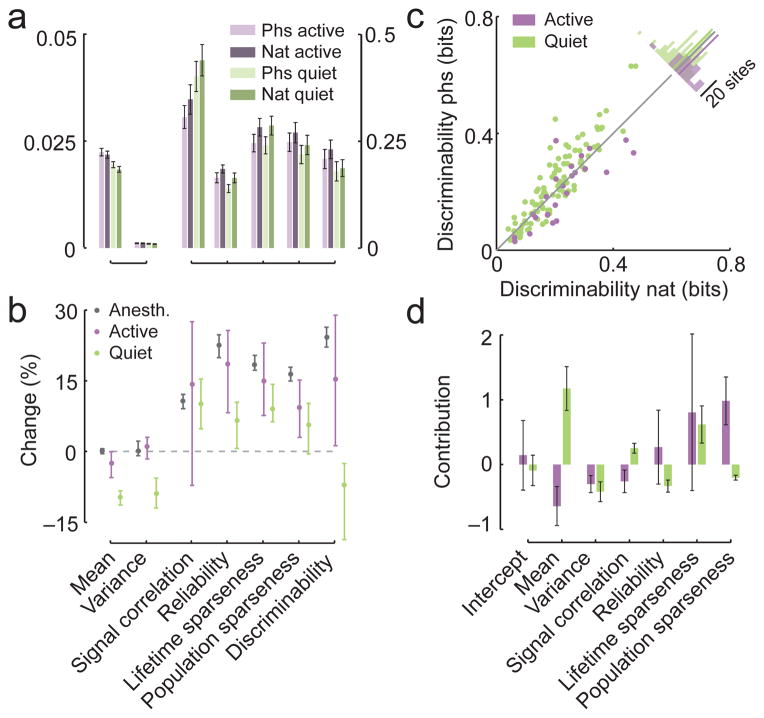
Neural codes are believed to have adapted to the statistical properties of the natural environment. However, the principles that govern the organization of ensemble activity in the visual cortex during natural visual input are unknown. We recorded populations of up to 500 neurons in the mouse primary visual cortex and characterized the structure of their activity, comparing responses to natural movies with those to control stimuli. We found that higher order correlations in natural scenes induced a sparser code, in which information is encoded by reliable activation of a smaller set of neurons and can be read out more easily. This computationally advantageous encoding for natural scenes was state-dependent and apparent only in anesthetized and active awake animals, but not during quiet wakefulness. Our results argue for a functional benefit of sparsification that could be a general principle governing the structure of the population activity throughout cortical microcircuits.


Figures

Figure 1
Figure 1. Experimental setup and example session
A. Illustration of the stimuli. Top, selected frames from a natural movie recorded from the viewpoint of a mouse using a MouseCam. Bottom, selected frames of the phase-scrambled movie, obtained by removing the higher-order correlations from the natural movie. First- and second-order correlations are matched between both stimulus types. B. Example session of 3D AOD two-photon recordings with 139 neurons. Grey balls indicate the position of the cell bodies. The activity of green neurons is shown in D. The spikes of the red neuron were recorded simultaneously using a patch pipette and are shown in C. C. Reconstruction quality of the spike rate from Calcium signals. From top to bottom: dF/F, spike rate inferred using nonnegative deconvolution, measured spike rate using patching and a scatter plot of true vs. inferred rate with linear regression line (grey) for the red example neuron indicated in B. Bottom right: box plot of correlation of true vs. inferred rate for the same sample of 16 neurons imaged with 2D or 3D imaging (red line: median; black box: 25th and 75th percentile; whiskers: range). D. Responses of the population of neurons shown in B (green neurons) for both stimulus types. Shown are responses of 20/139 cells, and 8 trials each.
Figure 2
Figure 2. Image features contributing to population activation in V1
A. Population receptive fields from 16 sites recorded in a single animal superimposed on the screen. Different colors indicate different sites. B. The population responses to one movie for the 16 sites shown in A. C. Scatter plot of the linear correlation coefficients between the population responses of all pairs of sites shown in A. vs. their center to center distance in degrees (N = 120 pairs). The regression line is shown in gray. D. Population responses and image statistics. The mean, contrast, kurtosis and motion of the movie for one example session evaluated within the population receptive field (blue, red, green and purple respectively) are plotted on top of the population response to that movie (gray). E. A linear regression model from the image statistics from D can explain part of the population response. The population activity is partially followed by the predicted activity of the linear regression model (gray and yellow, respectively). F. Boxplot of Variance Explained of a linear regression model (N=21 sites with at least 4 different movies; red line: median; black box: 25th and 75th percentile; whiskers: range), using the image statistics within the population receptive field of natural and phase scrambled images for predicting the activity of either the individual cell responses (Cell Activity) or the population response (Pop. Activity). G. Average weights of the regression model for the four image properties within the population receptive field of the two classes of stimuli (Nat, Phs) and the population response (N=21 sites, ±1SEM).
Figure 3
Figure 3. Higher order correlations in natural images change population structure
A. Mean measures of population activity (± 1SEM; n = 315 sites in layer 2/3 under anesthesia). Note the separate axis on the left and the right. B. Median change in measures of population activity between stimulation with natural and phase scrambled movies separately for L4 (n = 46 sites) and L2/3 (n = 315 sites) of V1 and L2/3 of the secondary visual areas LM and AL (n =117 sites; blue, red and green, respectively). Positive values indicate that the measure is higher under stimulation with natural movies. Error bars encompass the 95%-confidence intervals of the median. C. Scatter plot of population sparseness for stimulation with natural and phase-scrambled movies. Inset shows histogram of absolute change with red bar indicating the mean difference (*p < 0.001, bootstrap). D. Median change in measures of population activity between stimulation with natural and phase scrambled movies separately for 2D and 3D imaging (n = 332 sites for 2D imaging shown in blue; 30 sites for 3D imaging shown in red) and single neuron recordings (green; 29 cells). Pairwise signal correlations and population sparseness could not be evaluated for single neuron activity. Positive values indicate that the measure is higher under stimulation with natural movies. Error bars encompass the 95%-confidence intervals of the median.
Figure 4
Figure 4. The population representation of natural movie scenes is easier to discriminate
A. Discriminability between pairs of scenes from natural movies and phase scrambled movies based on the population response (n = 362 sites). Inset shows histogram of absolute change with red bar indicating the mean difference (*p < 0.001, bootstrap). B. Contributions of the change in different measures of the population structure towards predicting the average change in classification performance between natural and phase scrambled movies. Error bars show standard error for the regression coefficients scaled by the mean difference. C. Low-dimensional representation of a 22-dimensional neural activity space from the responses of one site to natural and phase scrambled stimuli, illustrating how spread out the representation of different movie scenes in the reduced space. D. Scatter plot of the difference in the spherical variance of each site between the natural and the phase scrambled stimuli, compared to the difference in the average population sparseness of each site between the two stimulus conditions. E. Illustration of the geometrical intuition behind the relationship between population sparseness and classification performance: population sparseness measures the average sin of the angle between the main diagonal and the population response vector
Figure 5
Figure 5. A sparse coding model with normalization is consistent with the results
A. Schematic of three LNP models used to generate the simulated responses. The initial linear filtering is the same for all (see methods). For Model 1, the filter output is rectified and used as a rate to generate Poisson spiking. An adaptive non-linearity is assumed that is adjusted to match the mean activity between the two classes for Model 2, and a normalization stage for Model 3. B. Median change in average activity, population sparseness and discriminability in the sparse coding model (286 model neurons) for Model 1, Model 2 and Model 3 (purple, green and yellow, respectively) and the in vivo results (gray). Error bars encompass the 95%-confidence intervals of the median.
Figure 6
Figure 6. Active but not quiet wakefulness resemble anesthetized state
A. Mean measures of population activity for the responses to phase scrambled and natural stimuli (light and dark shading respectively) in the active (n = 23 sites) and quiet states (n = 100 sites) of awake animals (purple and green respectively; ± 1 SEM). Note the separate axis on the left and the right. B. Median change in measures of population activity between stimulation with natural and phase scrambled movies separately for the anesthetized, active and quiet state of the animal (gray, purple and green, respectively). Positive values indicate that the measure is higher under stimulation with natural movies. Error bars encompass the 95%-confidence intervals of the median. C. Discriminability between pairs of scenes from natural movies and phase scrambled movies based on the population response for the active and awake states (purple and green respectively). Inset shows histogram of absolute change with the colored bar indicating their mean difference. D. Contributions of the change in different measures of the population structure towards predicting the average change in classification performance between natural and phase scrambled movies for the two awake states. Error bars show standard error for the regression coefficients scaled by the mean difference.

References

    1. Attneave F. Some informational aspects of visual perception. Psychol Rev. 1954;61:183. - PubMed
    1. Barlow HB. The coding of sensory messages. Curr Probl Anim Behav. 1961:331–360.
    1. Simoncelli EP, Olshausen BA. Natural image statistics and neural representation. Annu Rev Neurosci. 2001;24:1193–1216. - PubMed
    1. Olshausen BA, Field DJ. Emergence of simple-cell receptive field properties by learning a sparse code for natural images. Nature. 1996;381:607–609. - PubMed
    1. Bell AJ, Sejnowski TJ. The ‘independent components’ of natural scenes are edge filters. Vision Res. 1997;37:3327–3338. - PMC - PubMed

Publication types