. 2014 May;21(5):456-63.
doi: 10.1038/nsmb.2814. Epub 2014 Apr 20.

Conformational changes required for H(+)/Cl(-) exchange mediated by a CLC transporter

Affiliations

Conformational changes required for H(+)/Cl(-) exchange mediated by a CLC transporter

Daniel Basilio et al. Nat Struct Mol Biol. 2014 May.

Abstract

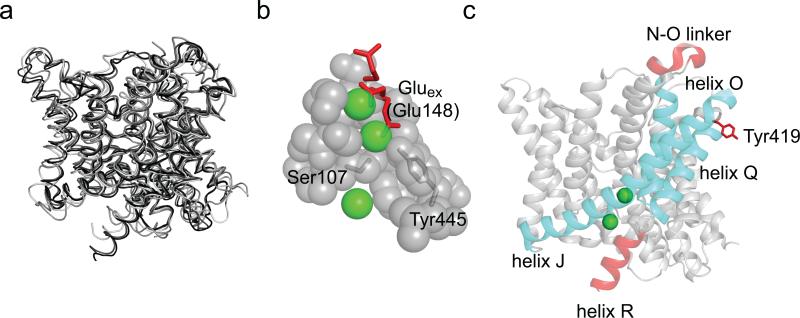
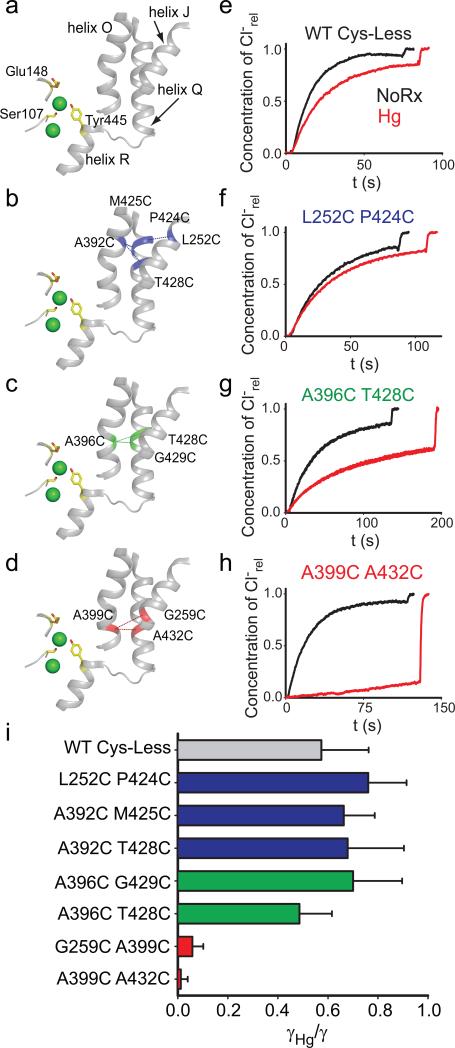
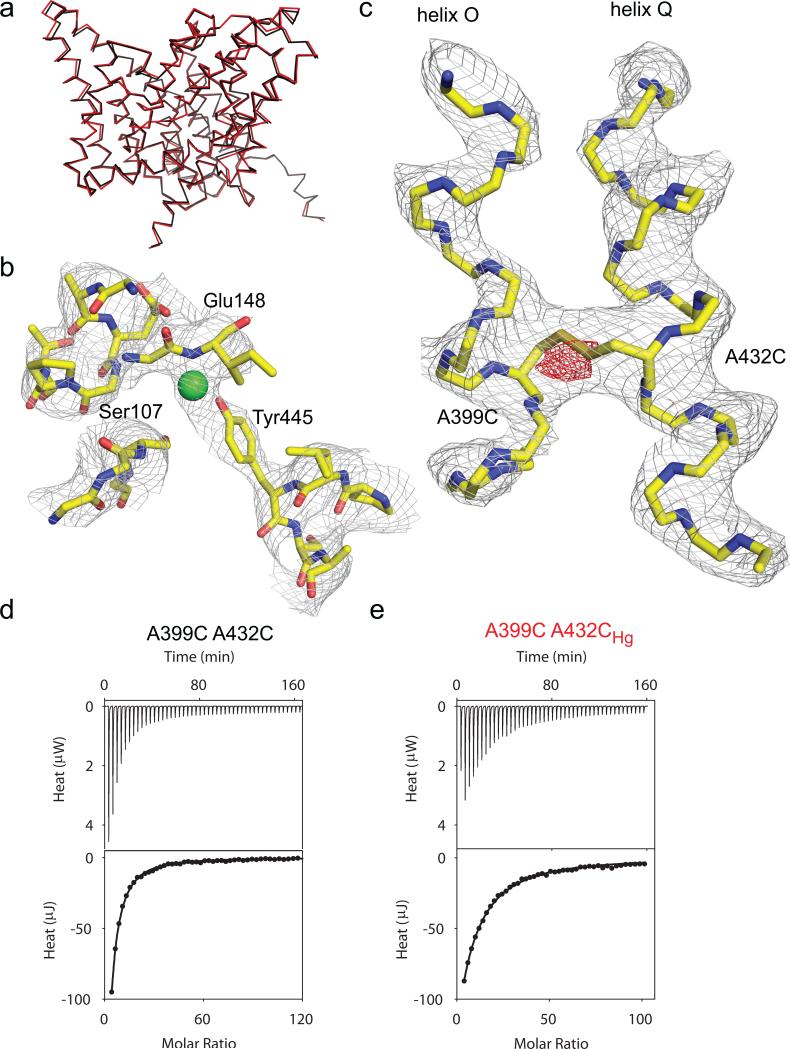
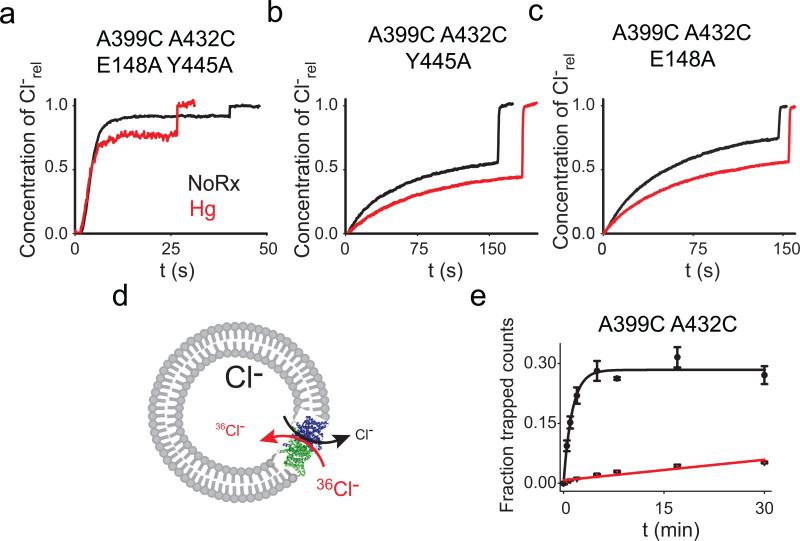
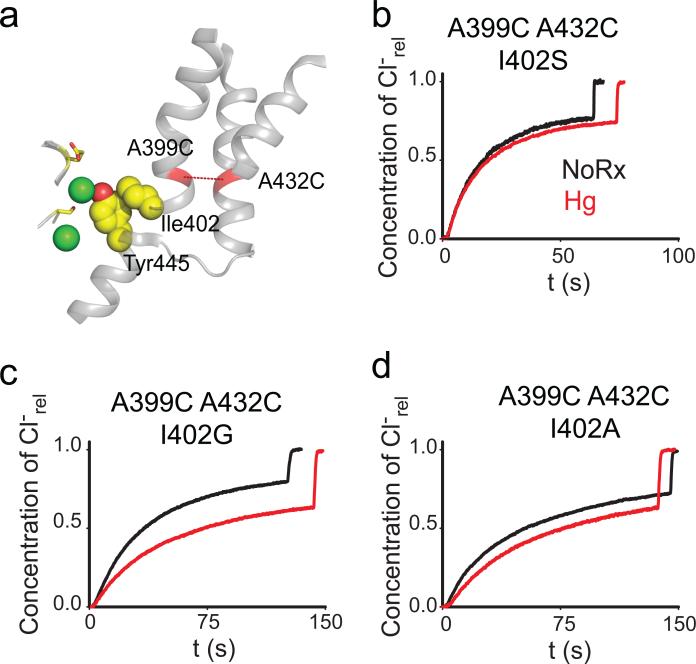
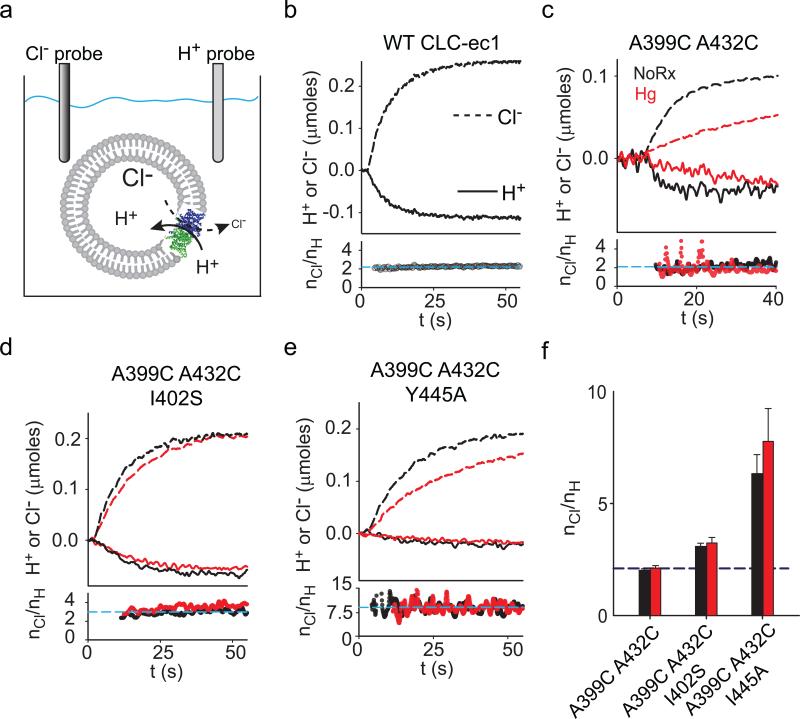
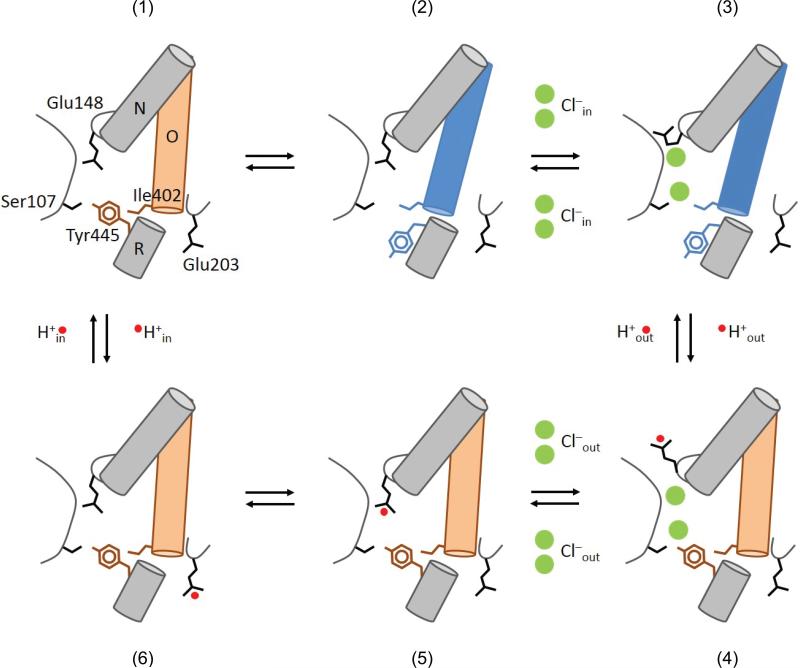
CLC-type exchangers mediate transmembrane Cl(-) transport. Mutations altering their gating properties cause numerous genetic disorders. However, their transport mechanism remains poorly understood. In conventional models, two gates alternatively expose substrates to the intra- or extracellular solutions. A glutamate was identified as the only gate in the CLCs, suggesting that CLCs function by a nonconventional mechanism. Here we show that transport in CLC-ec1, a prokaryotic homolog, is inhibited by cross-links constraining movement of helix O far from the transport pathway. Cross-linked CLC-ec1 adopts a wild-type-like structure, indicating stabilization of a native conformation. Movements of helix O are transduced to the ion pathway via a direct contact between its C terminus and a tyrosine that is a constitutive element of the second gate of CLC transporters. Therefore, the CLC exchangers have two gates that are coupled through conformational rearrangements outside the ion pathway.


Figures

Figure 1
Figure 1. Structural arrangement of CLC-ec1
a) Overlay of the backbone of four CLC homologues: CLC-ec1 (1OTS, black), stCLC (1KPL, dark gray), spCLC (3Q17, medium gray) and cmCLC (3ORG, light gray). b) Close up view of the Cl binding site of CLC-ec1. Highlighted in red is the side chain of E148. The three conformations are taken from cmCLC (down), WT CLC-ec1 (middle) and E148Q CLC-ec1 (up). Cl ions are shown as green spheres. c) Ribbon representation of a single subunit of CLC-ec1. Highlighted in red are areas that were reported in the literature to be involved in conformational changes-. Helices J, O and Q are shown in cyan.
Figure 2
Figure 2. Functional effects of crosslinking helices J, O and Q
a-d) View of the relative position of the Cl binding site, helices J, O, Q and R (a). The positions of the crosslinks are indicated by dashed lines and the residues are shown in blue (b, external region), green (c, central region) or red (d, internal region). The residues S107, E148 and Y445 are shown as yellow sticks. Cl ions are shown as green spheres. e-h) Representative time courses of Cl efflux from proteoliposomes reconstituted with WT CLC-ec1 (e), L252C P424C (f), A396C T428C (g) or A399C A432C (h) mutants CLC-ec1 before (black) and after (red) treatment with Hg2+ to induce crosslink formation. For clarity only traces for one mutant from each group are shown, traces of the other mutants are shown in Supplementary Figure 4. i) Average reduction of the transport rate after Hg2+-induced crosslink formation. Bars are color-coded as in panels a-d. The means ± s.e.m. of the unitary transport rates and number of repeats are reported in Table 1.
Figure 3
Figure 3. Structure of the A399C A432C crosslinked mutant
a) Overlay of the backbones of WT CLC-ec1 (black, PDB ID: 1OTS) and A399C A432CHg mutant (red, PDB ID: 4MQX). b) Structure of the ion binding region of the A399C A432CHg mutant. Green sphere represents a Cl ion modeled in the central binding site. The electron density is contoured at 1 σ. c) Structure of helices O and Q in the A399C A432CHg mutant. The electron density is contoured at 1.7 σ. The fo-fc electron density is shown in red and contoured at 3.3 σ. d-e) Thermograms of Cl binding to A399C A432C (d) and A399C A432CHg (e). Upper panels show the heats released upon ion binding. Lower panels show the integrated heats (circles) and the solid line is the fit to a single site isotherm. Averaged thermodynamic parameters are reported in Supplementary Table 1.
Figure 4
Figure 4. Movement of helix O is coupled to the Cl gates
a-c) Representative traces of Cl efflux mediated by the E148A Y445A (a), Y445A (b) and E148A (c) mutants before (black) and after (red) the Hg2+-induced formation of the crosslink at A399C A432C. The average values are reported in Table 1. d) Schematic representation of the Cl uptake assay. e) 36 Cl uptake mediated by the A399C A432C mutant before (black circles) and after (red triangles) Hg2+- induced crosslink formation. Symbols represent the average of n=3-6 replicate time points. The errors are the s.e.m. Solid lines represent the fits to a rising exponential (for A399C A432C) of the form C(t)= aM*(1–exp(–t/τ) with a =0.28±0.08 and τ=0.77±0.09 min–1 for an initial rate K(A399C A432C)=0.22±0.06 min–1. The data for the crosslinked A399C A432CHg was fit to a line of the form a +K*t with a0=0.007±0.03 and K(A399C A432CHg)=0.0017±0.0002 min .The errors on the fitted values represent the uncertainty on the fit rather than the s.e.m.
Figure 5
Figure 5. I402 couples helix O to Y445
a) View of the relative position of the Cl binding site, helices J, O, Q and R, the A399C A432C crosslink (red dashed line) and the Ile402 Tyr445 contact (yellow, spacefilling representation). The gating residues Ser107 and Glu148 are shown as yellow sticks. Cl ions are shown as green spheres. b-d) Representative traces of Clefflux mediated by the I402G (b), I402A (c) and I402S (d) mutants in the background of the A399C A432C mutant before (black traces) and after (red traces) formation of the crosslink. The average values are reported in Table 1.
Figure 6
Figure 6. Effects of crosslinking helix O on the Cl/H+ exchange stoichiometry
a) Schematic representation of the simultaneous Cl and H+ flux recordings. b-e) Upper panels: simultaneous recordings of Cl efflux into (dashed lines) and H+ efflux from (solid lines) proteoliposomes reconstituted with WT CLC-ec1 (b), A399C A432C (c), A399C A432C I402S (d) or A399C A432C Y445A (e) before (black traces) and after (red traces) formation of the crosslink. Bottom panels: time course of the stoichiometry of transport (nCl/nH) determined as the ratio of the total transported Cl and H+ ions. Dashed cyan line indicates the average value for the traces shown. e) Average stoichiometry of transport for the A399C A432C (nCl/nH(NoRx)= 2.0±0.1, n=5; nCl/nH(Hg)= 2.1±0.1, n=8), A399C A432C I402S (nCl/nH(NoRx)= 3.1±0.1, n=7; nCl/nH(Hg)= 3.2±0.2, n=8) and A399C A432C Y445A (nCl/nH(NoRx)= 6.3±0.8, n=5; nCl/nH(Hg)= 7.8±1.4, n=4) mutants before (black bars) and after (red bars) Hg treatment. The dashed blue line indicates the WT value (nCl/nH= 2.2±0.1, n=5). Data shown is the average±s.e.m. of n experiments from 2+ independent preparations.
Figure 7
Figure 7. Transport cycle for Cl–H+ exchange in the CLC transporters
The details of the transport model are given in the main text. The states are (1) Apo state with the inner (Tyr445) and outer (Glu148) gates closed. The inner gate opens (2) thereby allowing Cl binding to CLC-ec1 (3). (4) The inner gate closes, the external gate opens and becomes protonated. (5) Cl ions can move to the extracellular solution and the external gate closes while still protonated. (6) The proton goes to the intracellular proton acceptor, Glu203 from which it diffuses into the intracellular solution returning the transporter to the apo state.

References

    1. Jentsch TJ. CLC chloride channels and transporters: from genes to protein structure, pathology and physiology. Crit. Rev. Biochem. Mol. Biol. 2008;43:3–36. - PubMed
    1. Accardi A, Picollo A. CLC channels and transporters: proteins with borderline personalities. Biochim Biophys Acta. 2010;1798:1457–1464. - PMC - PubMed
    1. Accardi A, Miller C. Secondary active transport mediated by a prokaryotic homologue of ClC Cl− channels. Nature. 2004;427:803–807. - PubMed
    1. Picollo A, Pusch M. Chloride/proton antiporter activity of mammalian CLC proteins ClC-4 and ClC-5. Nature. 2005;436:420–423. - PubMed
    1. Scheel O, Zdebik AA, Lourdel S, Jentsch TJ. Voltage-dependent electrogenic chloride/proton exchange by endosomal CLC proteins. Nature. 2005;436:424–427. - PubMed

Publication types

MeSH terms

Substances

Associated data

LinkOut - more resources