

Normal appearing and diffusely abnormal white matter in patients with multiple sclerosis assessed with quantitative MR
- PMID: 24747946
- PMCID: PMC3991609
- DOI: 10.1371/journal.pone.0095161
Normal appearing and diffusely abnormal white matter in patients with multiple sclerosis assessed with quantitative MR
Abstract
Introduction: Magnetic Resonance Imaging is a sensitive technique for detecting white matter (WM) MS lesions, but the relation with clinical disability is low. Because of this, changes in both 'normal appearing white matter' (NAWM) and 'diffusely abnormal white matter' (DAWM) have been of interest in recent years. MR techniques, including quantitative magnetic resonance imaging (qMRI) and quantitative magnetic resonance spectroscopy (qMRS), have been developed in order to detect and quantify such changes. In this study, qMRI and qMRS were used to investigate NAWM and DAWM in typical MS patients and in MS patients with low number of WM lesions. Patient data were compared to 'normal white matter' (NWM) in healthy controls.
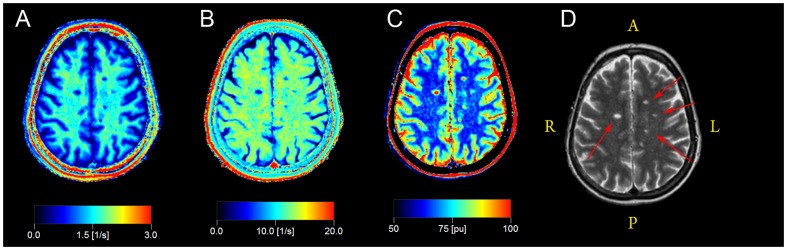
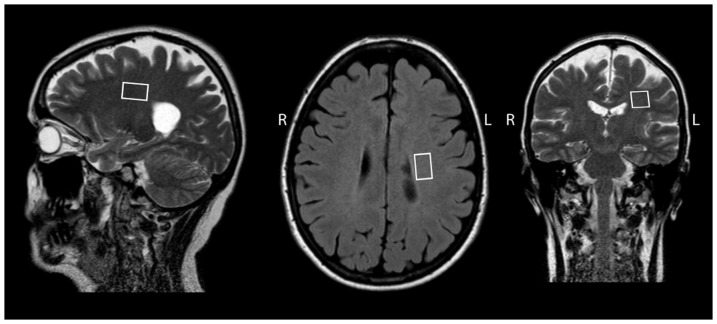
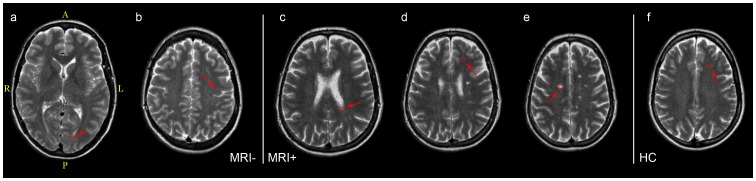
Methods: QMRI and qMRS measurements were performed on a 1.5 T Philips MR-scanner. 35 patients with clinically definite MS and 20 healthy controls were included. Twenty of the patients fulfilled the 'Barkhof-Tintoré criteria' for MS, ('MRIpos'), whereas 15 showed radiologically atypical findings with few WM lesions ('MRIneg'). QMRI properties were determined in ROIs of NAWM, DAWM and lesions in the MS groups and of NWM in controls. Descriptive statistical analysis and comparisons were performed. Correlations were calculated between qMRI measurements and (1) clinical parameters and (2) WM metabolite concentrations. Regression analyses were performed with brain parenchyma fraction and MSSS.
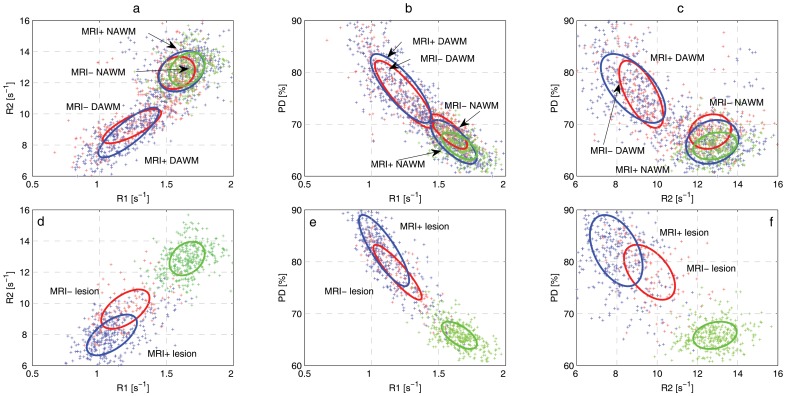
Results: NAWM in the MRIneg group was significantly different from NAWM in the MRIpos group and NWM. In addition, R1 and R2 of NAWM in the MRIpos group correlated negatively with EDSS and MSSS. DAWM was significantly different from NWM, but similar in the MS groups. N-acetyl aspartate correlated negatively with R1 and R2 in MRIneg. R2 of DAWM was associated with BPF.
Conclusions: Changes in NAWM and DAWM are independent pathological entities in the disease. The correlation between qMRI and clinical status may shed new light on the clinicoradiological paradox.
Conflict of interest statement
Figures
References
-
- Paty DW, Oger JJ, Kastrukoff LF, Hashimoto SA, Hooge JP, et al. (1988) MRI in the diagnosis of MS: a prospective study with comparison of clinical evaluation, evoked potentials, oligoclonal banding, and CT. Neurology 38: 180–185. - PubMed
-
- Barkhof F (2002) The clinico-radiological paradox in multiple sclerosis revisited. Curr Opin Neurol 15: 239–245. - PubMed
-
- Harirchian MH, Rezvanizadeh A, Fakhri M, Oghabian MA, Ghoreishi A, et al. (2010) Non-invasive brain mapping of motor-related areas of four limbs in patients with clinically isolated syndrome compared to healthy normal controls. J Clin Neurosci 17: 736–741. - PubMed
-
- Rocca MA, Colombo B, Falini A, Ghezzi A, Martinelli V, et al. (2005) Cortical adaptation in patients with MS: a cross-sectional functional MRI study of disease phenotypes. Lancet Neurol 4: 618–626. - PubMed
-
- Audoin B, Guye M, Reuter F, Au Duong MV, Confort-Gouny S, et al. (2007) Structure of WM bundles constituting the working memory system in early multiple sclerosis: a quantitative DTI tractography study. Neuroimage 36: 1324–1330. - PubMed
Publication types
MeSH terms
LinkOut - more resources
Full Text Sources
Other Literature Sources
Medical
