. 2014 May 6;111(18):6798-803.
doi: 10.1073/pnas.1318665111. Epub 2014 Apr 18.

Cortical control of adaptation and sensory relay mode in the thalamus

Affiliations

Cortical control of adaptation and sensory relay mode in the thalamus

Rebecca A Mease et al. Proc Natl Acad Sci U S A. .

Abstract

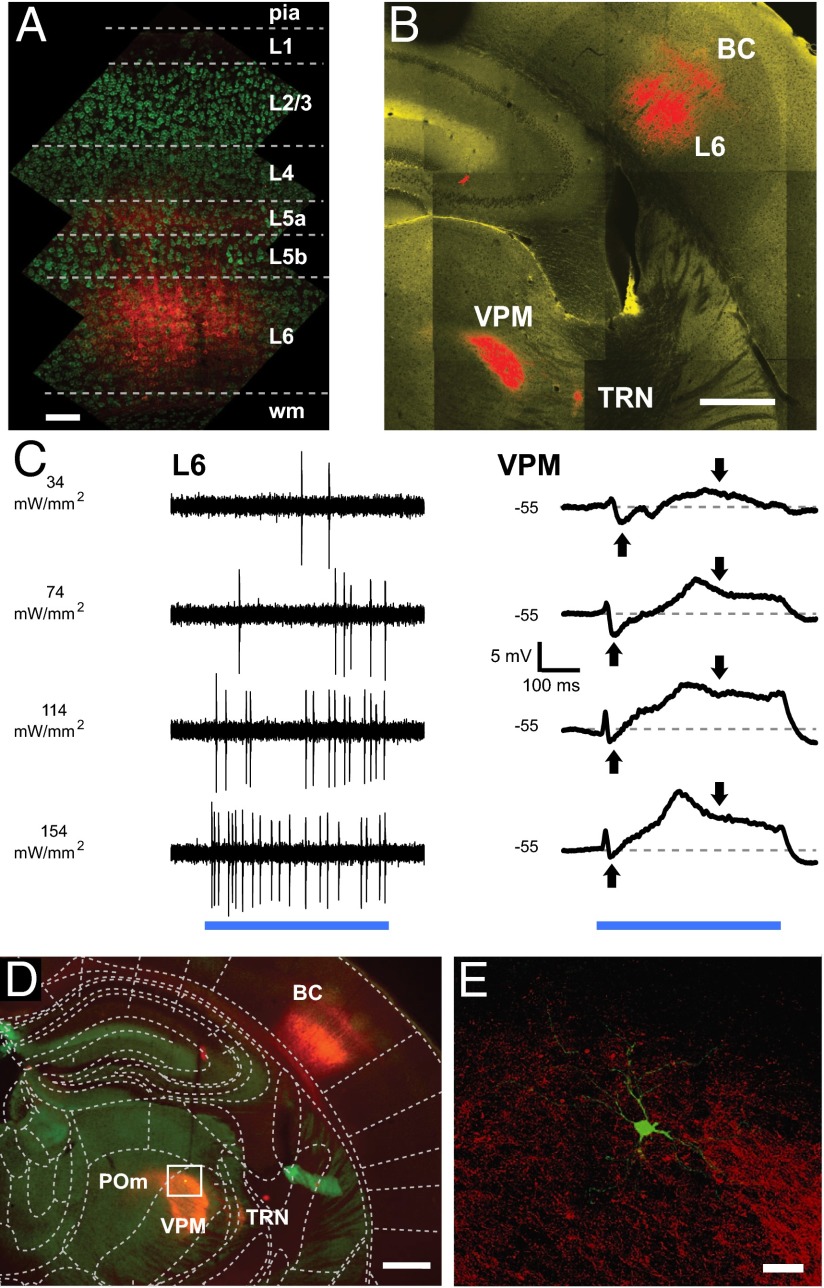
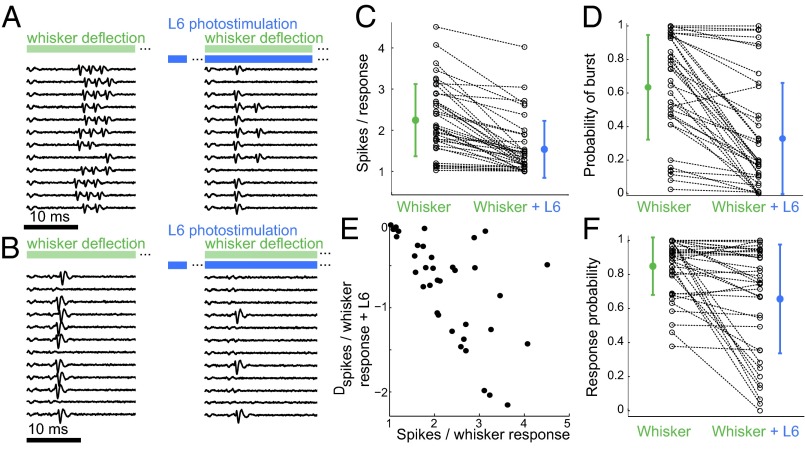
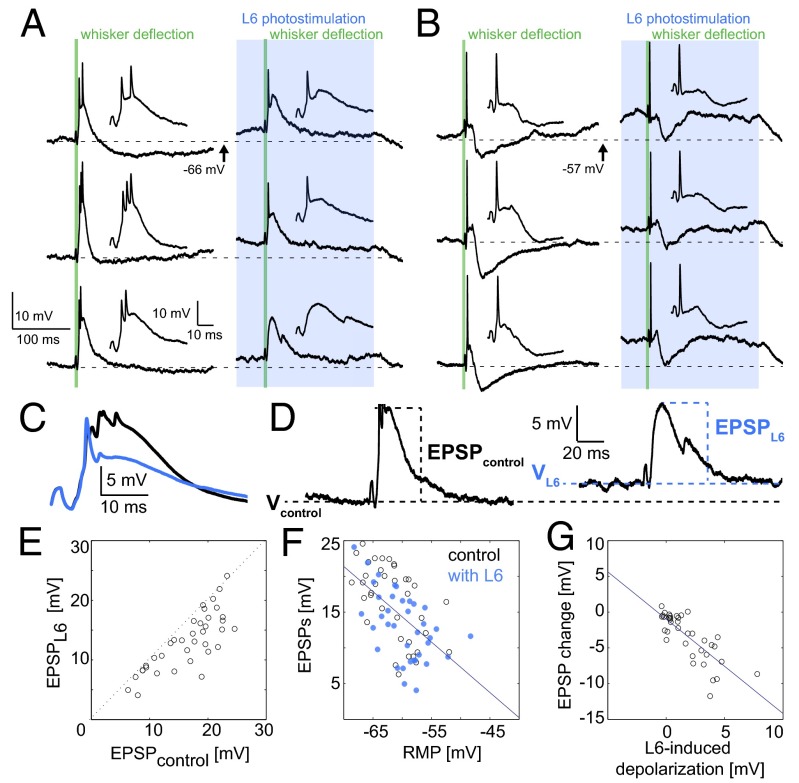
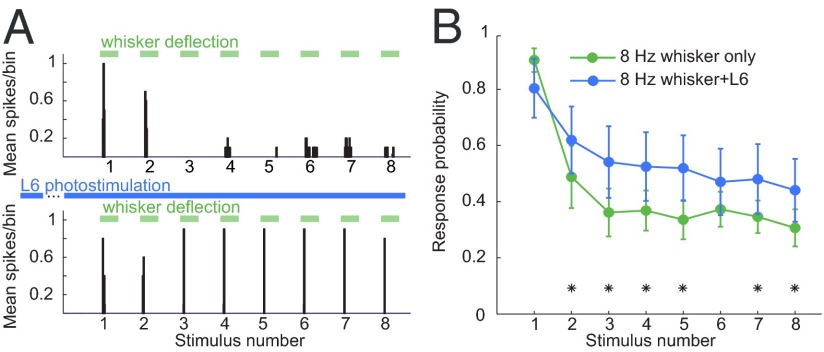
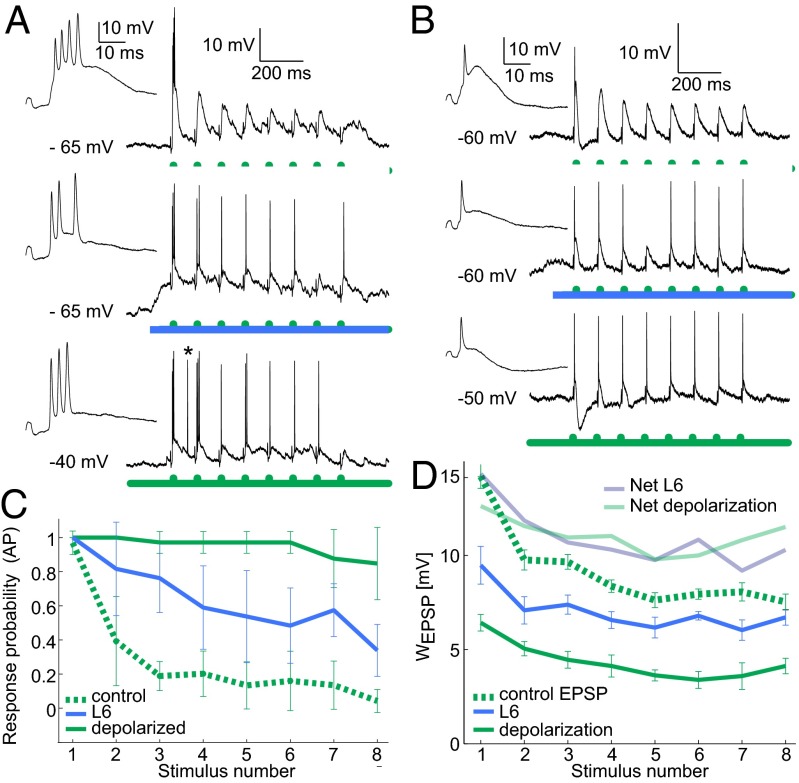
A major synaptic input to the thalamus originates from neurons in cortical layer 6 (L6); however, the function of this cortico-thalamic pathway during sensory processing is not well understood. In the mouse whisker system, we found that optogenetic stimulation of L6 in vivo results in a mixture of hyperpolarization and depolarization in the thalamic target neurons. The hyperpolarization was transient, and for longer L6 activation (>200 ms), thalamic neurons reached a depolarized resting membrane potential which affected key features of thalamic sensory processing. Most importantly, L6 stimulation reduced the adaptation of thalamic responses to repetitive whisker stimulation, thereby allowing thalamic neurons to relay higher frequencies of sensory input. Furthermore, L6 controlled the thalamic response mode by shifting thalamo-cortical transmission from bursting to single spiking. Analysis of intracellular sensory responses suggests that L6 impacts these thalamic properties by controlling the resting membrane potential and the availability of the transient calcium current IT, a hallmark of thalamic excitability. In summary, L6 input to the thalamus can shape both the overall gain and the temporal dynamics of sensory responses that reach the cortex.

Keywords: Ntsr1; firing mode; low threshold calcium spike; sensory systems; top-down modulation.


Conflict of interest statement

The authors declare no conflict of interest.

Figures

Fig. 1.
Fig. 1.
Cell-type–specific optogenetic stimulation of L6 evokes synaptic responses in the VPM. (A) ChR2-mCherry expression in the BC. Fluorescence (red) in respect to cortical layers shows labeled somata in L6 and dendritic tufts and/or terminals in L5a and L4. Cortical layer estimates are based on soma sizes and densities, visualized with a fluorescent Nissl stain (green; Neurotrace). (Scale bar: 100 µm.) (B) L6 (Ntsr1) neurons expressing ChR2-mCherry (red) in the BC project to the VPM and the TRN in the somatosensory thalamus. (Scale bar: 500 µm). (C, Left) Juxtacellular recording of L6 spikes in response to light stimulation (500 ms; blue bar) at varying laser intensities. (Right) Biphasic mean intracellular VPM responses to the same stimuli. Downward/upward arrows indicate depolarization/hyperpolarization; dashed lines show control RMP. (D) Low-magnification fluorescence micrograph of a VPM neuron (green dot) labeled after the recording. Red fluorescence in the thalamus indicates labeled L6 boutons. The boxed region is shown in E. (Scale bar: 500 µm.) (E) Confocal fluorescence image of the VPM neuron (green) in D with labeled L6 axons and boutons (red). (Scale bar: 50 µm.)
Fig. 2.
Fig. 2.
L6 activation influences the sensory response mode and the probability of response in the VPM. (A) Juxtacellular recording of a VPM neuron in response to whisker stimulation (Left, green) and whisker stimulation paired with L6 photostimulation (Right, blue). L6 stimulation started 200 ms before whisker stimulation as indicated by the gap in the blue bar. (B) As in A, but for a neuron in tonic mode. (C and D) Population summaries (n = 38) for number of spikes per whisker response (C) and the probability of burst per whisker response (D). Only successful responses were considered; dotted lines indicate pairings for individual neurons. Colored markers show mean values for whisker stimulation alone (green) or whisker stimulation combined with L6 input (blue). Error bars show SD. L6 activation decreased both the number of spikes per whisker response (2.3 ± 0.9–1.6 ± 0.7 spikes per response) (C) and the probability of a burst per whisker response (0.64 ± 0.3–0.33 ± 0.33) (D). (E) Data from C replotted to show how the L6-induced reduction in the number of spikes per whisker response (Dspikes, y-axis) depends on the initial burstiness (x-axis). (F) Summary of the probability of response per whisker deflection alone and per whisker deflection combined with L6 input, Plotting conventions are as in C and D. The average probabilities of response across the populations were 0.84 ± 0.17 for the control condition and 0.66 ±0.32 with L6 activation (P = 2.6*10−4, paired t test, n = 38).
Fig. 3.
Fig. 3.
L6 activation switches sensory responses in the VPM to tonic mode by depolarization. The L6 photostimulus (blue) started 200 ms before the 2-ms whisker stimulus (green). Two milliseconds (vs. 50 ms in the juxtacellular recordings) were used to minimize electrical piezo artifacts. (A) Whole-cell recording of (Left) a VPM neuron in response to whisker deflection (green) and (Right) whisker deflection paired with L6 photostimulation (blue box), showing three of 25 repetitions. The membrane potentials at the time of the whisker stimulus typically were higher with L6 stimulation and dropped back to baseline when the photostimulus ended. Insets show the first 50 ms of the whisker responses. (B) As in A, but for a neuron in tonic mode under control conditions (control RMP was ∼57 mV). Scale is as in A. (C) Intracellular whisker responses (mean from 25 repetitions from neuron in A) during control (black) and L6 activation (blue trace). (D) Intracellular whisker responses show measurements taken for the EPSP population analysis in EG. Note base depolarization by L6: the dashed black lines indicate the control RMP (VControl), and the dashed blue lines indicate the membrane potential during L6 activation (VL6). LTS sizes were estimated from whisker EPSP magnitudes in control and L6 trials. (E) Population cell-by-cell (n = 13) comparison of median EPSPWhisker and EPSPL6 for single whisker deflections. (F) Comparison between EPSPcontrol (black circles) and EPSPL6 (blue circles) from the same recordings shown in E. EPSP magnitudes were correlated with membrane potential (Vcontrol or VL6); r = −0.57. The line shows the linear best fit. (G) L6-induced decrease in whisker response (EPSPL6 − EPSPWhisker) is correlated with underlying L6-induced depolarization (VL6 − Vcontrol); r = −0.79. The line shows the linear best fit. Small changes in RMP by L6-activation led to small changes in EPSP magnitude, whereas larger L6-induced depolarization led to more marked decreases in EPSP magnitude.
Fig. 4.
Fig. 4.
Activation of L6 alters the relay of high-frequency sensory stimuli. VPM neurons were stimulated with 8-Hz whisker deflection trains (green bars) with and without L6 photoactivation (blue bars). (A, Upper) PSTH of a VPM neuron’s spiking response in control condition. (Lower) Response to the same stimulus during L6 photostimulation (blue bars) starting 200 ms before the whisker deflection train. (B) Population average of the probability of VPM spike responses (n = 10) for control trials (green trace) and during L6 stimulation (blue trace). Asterisks indicate response probabilities that were changed significantly by L6 activation (Methods).
Fig. 5.
Fig. 5.
L6 activity enhances the relay of frequency stimuli by reducing supra- and subthreshold adaptation and decreasing distance to threshold. (A, Top) Intracellular response to 8-Hz whisker deflection (green). (Middle) Response to the same whisker stimulus but with activated L6. (Bottom) Response to the same whisker stimulus from elevated membrane potential (injected current: 350 pA; spontaneous AP marked with asterisk.). Insets show responses to the first whisker deflection at higher time resolution. (B) As in A but for a neuron that fired mostly tonic APs in control conditions. (C) Summary of AP probabilities for the three conditions in A and B from five VPM neurons. Green dashed line: whisker stimulation alone; blue solid line: whisker + L6 stimulation; green solid line: whisker stimulation + injected current (300–450 pA). Error bars indicate SD. (D) EPSP quantification for a sample VPM whole-cell recording with 8-Hz whisker stimulation alone (green dashed line), whisker + L6 stimulation (blue), or injected current sufficient to depolarize the cell to −40 mV (green solid line). L6 activation and depolarization decreased EPSP magnitude and subthreshold adaptation between successive stimuli. Mean magnitudes are shown; error bars show SD. Depolarization compensates for decreased EPSP magnitude: Light blue and light green traces show the net sum of depolarization and mean EPSP magnitude for L6 activation or depolarization, respectively. EPSP magnitude and depolarization were quantified as in Fig. 3D.

References

    1. Fairhall AL, Lewen GD, Bialek W, de Ruyter Van Steveninck RR. Efficiency and ambiguity in an adaptive neural code. Nature. 2001;412(6849):787–792. - PubMed
    1. Wark B, Lundstrom BN, Fairhall A. Sensory adaptation. Curr Opin Neurobiol. 2007;17(4):423–429. - PMC - PubMed
    1. Barlow H. Possible Principles Underlying the Transformation of Sensory Messages. Cambridge, MA: MIT Press; 1961.
    1. Diamond ME, Armstrong-James M, Ebner FF. Somatic sensory responses in the rostral sector of the posterior group (POm) and in the ventral posterior medial nucleus (VPM) of the rat thalamus. J Comp Neurol. 1992;318(4):462–476. - PubMed
    1. Simons DJ, Carvell GE. Thalamocortical response transformation in the rat vibrissa/barrel system. J Neurophysiol. 1989;61(2):311–330. - PubMed

Publication types

LinkOut - more resources