. 2014 Apr 18;9(4):e95216.
doi: 10.1371/journal.pone.0095216. eCollection 2014.

A new lncRNA, APTR, associates with and represses the CDKN1A/p21 promoter by recruiting polycomb proteins

Affiliations

A new lncRNA, APTR, associates with and represses the CDKN1A/p21 promoter by recruiting polycomb proteins

Masamitsu Negishi et al. PLoS One. .

Abstract

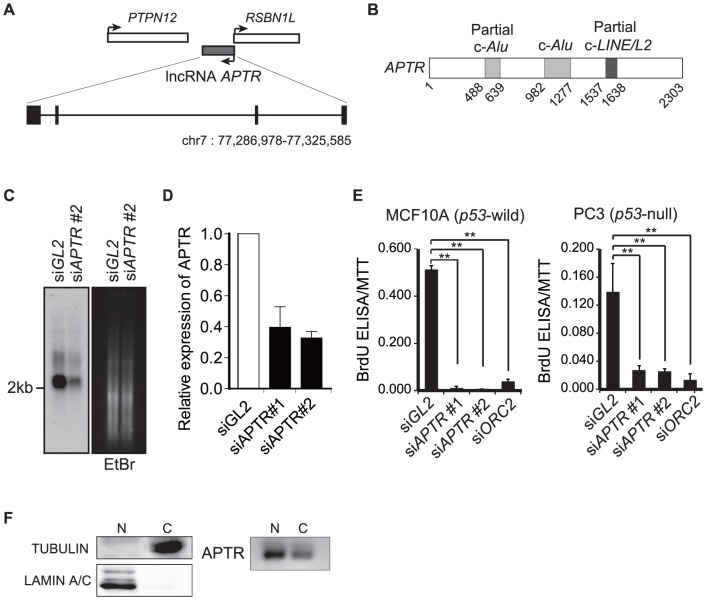
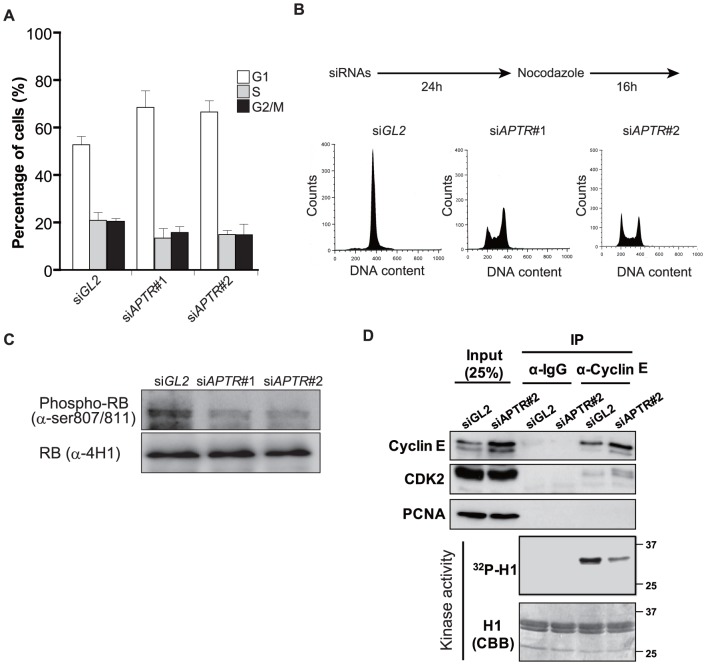
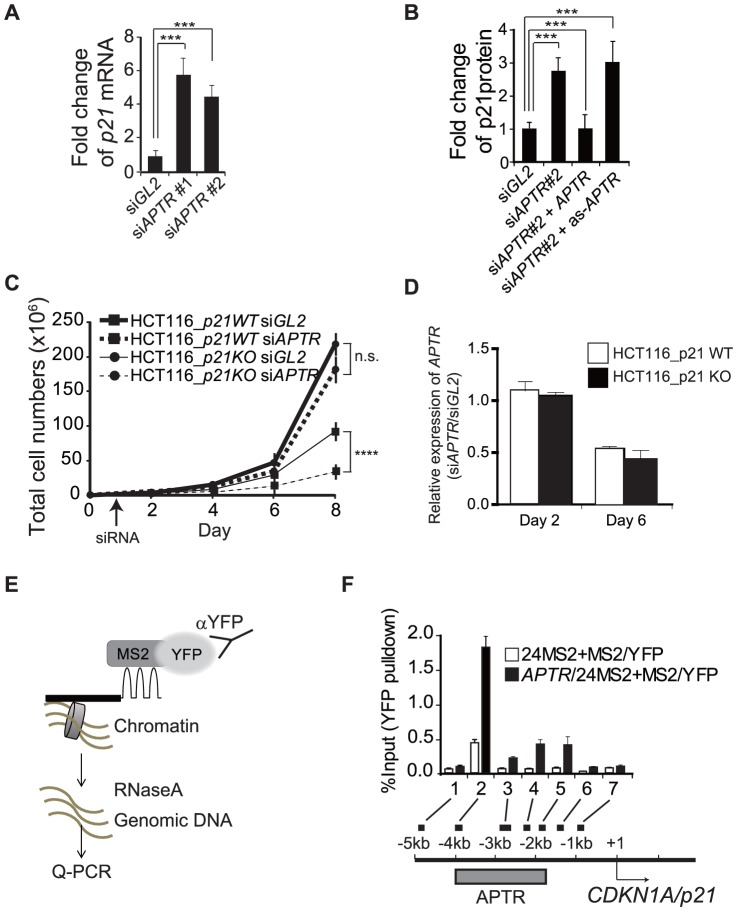
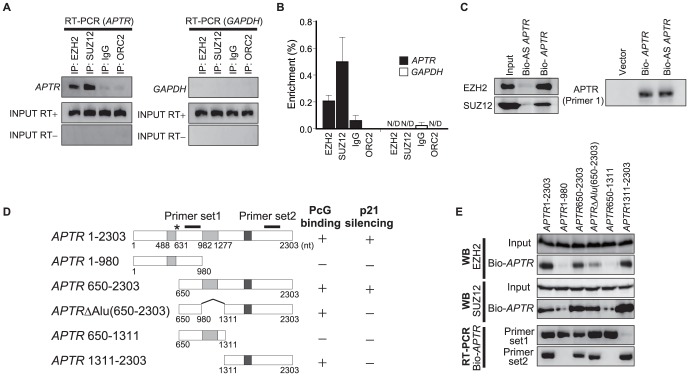
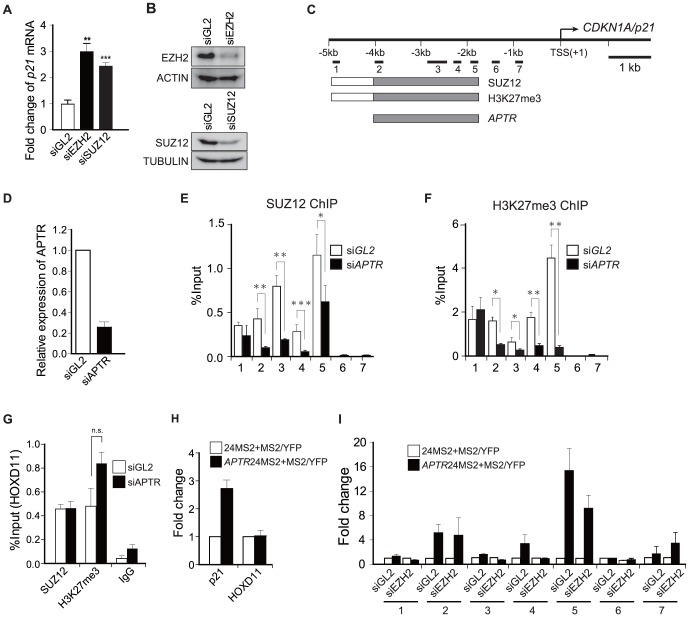
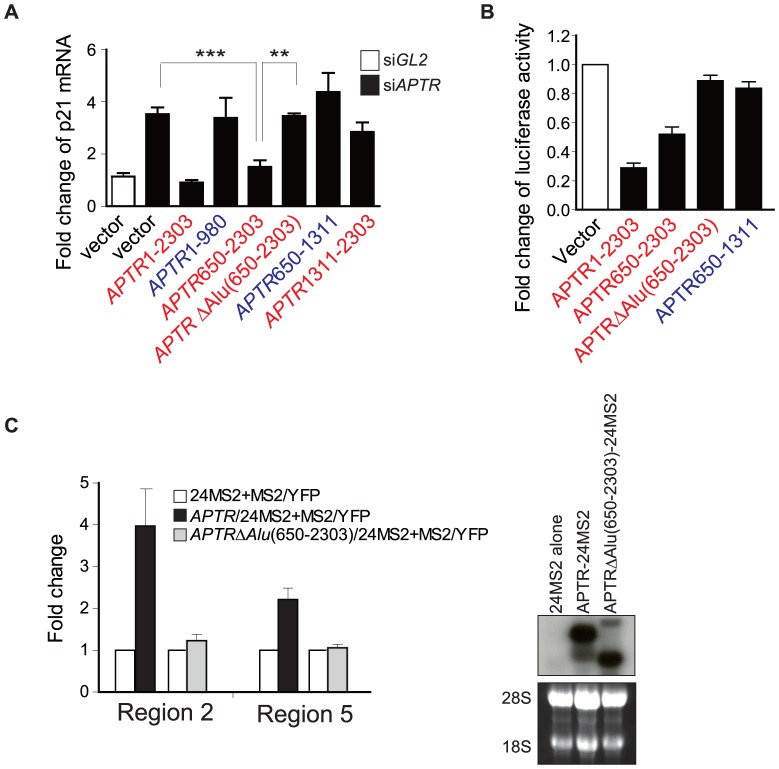
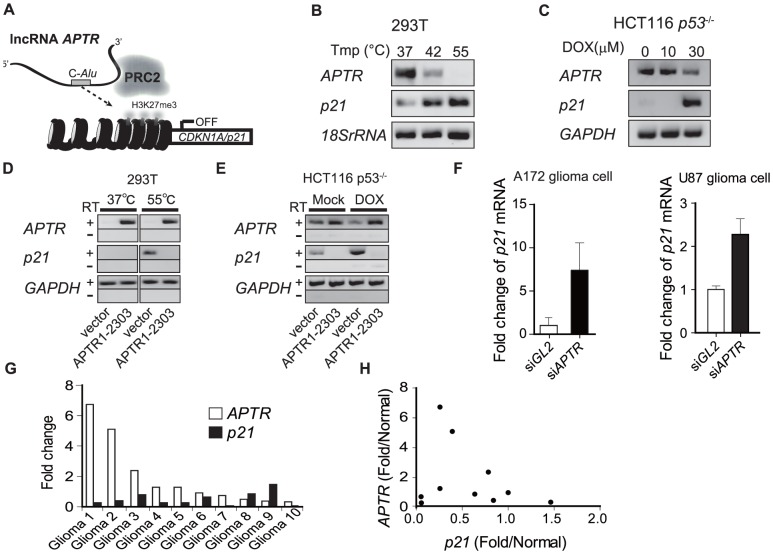
Long noncoding RNAs (lncRNAs) have emerged as a major regulator of cell physiology, but many of which have no known function. CDKN1A/p21 is an important inhibitor of the cell-cycle, regulator of the DNA damage response and effector of the tumor suppressor p53, playing a crucial role in tumor development and prevention. In order to identify a regulator for tumor progression, we performed an siRNA screen of human lncRNAs required for cell proliferation, and identified a novel lncRNA, APTR, that acts in trans to repress the CDKN1A/p21 promoter independent of p53 to promote cell proliferation. APTR associates with the promoter of CDKN1A/p21 and this association requires a complementary-Alu sequence encoded in APTR. A different module of APTR associates with and recruits the Polycomb repressive complex 2 (PRC2) to epigenetically repress the p21 promoter. A decrease in APTR is necessary for the induction of p21 after heat stress and DNA damage by doxorubicin, and the levels of APTR and p21 are anti-correlated in human glioblastomas. Our data identify a new regulator of the cell-cycle inhibitor CDKN1A/p21 that acts as a proliferative factor in cancer cell lines and in glioblastomas and demonstrate that Alu elements present in lncRNAs can contribute to targeting regulatory lncRNAs to promoters.


Conflict of interest statement

Competing Interests: The authors have declared that no competing interests exist.

Figures

Figure 1
Figure 1. LncRNA APTR knockdown inhibits cell proliferation in a p53-independent manner.
(A) Schematic of the APTR locus. Black boxes represent exons. (B) Schematic of lncRNA APTR. “c-“: complementary to Alu or LINE elements. (C) Northern blot of APTR on poly(A) RNA in 293T cells transfected with siGL2 or siAPTR#2, at 72 hr after siRNA transfection. Probe: APTR cDNA (651–950). (D) Relative APTR expression levels normalized to GAPDH in 293T cells transfected with siGL2 or siAPTR#1, #2, at 72 hr after siRNA transfection. (E) APTR knockdown inhibits cell proliferation. BrdU incorporation (DNA synthesis) was measured by BrdU ELISA, 72 hr after siRNA transfection, and normalized to MTT assays (number of viable cells). siOrc2 was used as a positive control known to inhibit cell proliferation. **: P<0.005. (F) Subcellular expression levels of APTR in 293T cells. α-TUBULIN and LAMIN A/C were analyzed as markers for cytoplasm or nuclear fraction (left panel). APTR expression levels in the fractions were analyzed by RT-PCR (right panel).
Figure 2
Figure 2. APTR depletion suppresses the G1/S phase progression.
(A) MCF10A cells transfected with siAPTR #1 or #2 accumulate in the G1 phase of the cell-cycle as measured by two color FACS for propidium-iodide and BrdU (mean ±s.e.m., n = 3). (B) 293T cells transfected with siGL2 or siAPTR #2 were analyzed by FACS for propidium-iodide in presence of Nocodazole (0.1 µg/ml). Schematic of the Nocodazole treatment procedure was presented on the top. (C) Immunoblot shows that Retinoblastoma protein is hypo-phosphorylated in 293T cells transfected with siAPTR #1 and #2. Total RB protein was analyzed as a loading control. (D) Reduced kinase activity of Cyclin E/CDK2 in 293T cells transfected with siAPTR#2. Cyclin E1 and CDK2 were analyzed by IP and immunoblot with indicated antibodies. PCNA was analyzed as a loading control. Kinase activity: autoradiogram of 32P labeled histone H1 after in vitro kinase assays with immunoprecipitates. CBB; coomassie blue staining to show equal amounts of H1 were added to all the lanes.
Figure 3
Figure 3. APTR suppresses p21 transcription.
(A) Q-RT-PCR shows induction of p21 mRNA (normalized to GAPDH) after siAPTR. Fold change compared to siGL2-transfected 293T cells (mean ±s.e.m., n>6, ***: P<0.0005). (B) The induction of p21 protein in the siAPTR#2 transfected 293T cells is prevented by overexpression of sense but not antisense APTR. Fold change of p21 normalized to ACTIN, compared to siGL2-transfected cells (mean ±s.e.m., n>3, **: P<0.005). (C) Growth suppression after siAPTR is alleviated in p21 −/− HCT116 cells. Mean ±s.e.m. n = 9. Right: APTR expression levels (Normalized to GAPDH) measured by Q-RT-PCR in p21 +/+ or p21 −/− HCT116 cells at the indicated days after transfection of siRNAs (n.s.: not significant, ****: P<0.0001). (D) Q-RT-PCR shows fold change of APTR (normalized to GAPDH), compared to the siGL2-transfected cells in the two cell lines in C (mean ±.e.m., n = 3). Note that cells were transfected on Day 1, so Day 2 is 1 day after transfection and Day 6 is 5 days after transfection. Thus si-APTR does not decrease APTR on day 1 after transfection, but the APTR RNA remains low up to day 5. (E) Schematic of MS2-CLIP. The dark line is APTR RNA fused to MS2 binding sequences. (F) APTR associates with the p21 promoter. Top: The % of input DNA present in the MS2BP-YFP CLIP is shown in cells expressing MS2 alone or MS2-APTR (mean ±s.e.m, n>6). 1–7 refer to the primer pairs in the schematic. Bottom: locations of p21 promoter fragments amplified by primer pairs 1–7 in the CLIP assay. Grey bar: area where APTR binds.
Figure 4
Figure 4. APTR interacts with PRC2 proteins EZH2 and SUZ12.
(A) APTR interacts specifically with EZH2 and SUZ12 in vivo. Top: RNA Immunoprecipitates of 293T cell lysates probed for APTR by RT-PCR using primer set 1 in Fig. 4D. GAPDH was analyzed as a negative control in the right. IgG, ORC2: IP negative controls. Middle and bottom: input RNA analyzed with and without RT. (B) Enrichment of endogenous APTR in the RNA immunoprecipitates of endogenous EZH2 and SUZ12. RNA immunoprecipitation analysis in Figure 4A was analyzed by Q-RT-PCR. IgG and ORC2 were analyzed as a negative IP control. GAPDH was analyzed as a negative control. N/D represents not detectable. Error bars indicate Mean ±s.e.m. (n = 3). (C) Left: Immunoblot for EZH2 and SUZ12 after mixing in vitro transcribed biotinylated sense-/antisense-APTR with cell lysates and pull-down on streptavidin beads. Right: RT-PCR to show equal levels of biotinylated sense- or antisense-APTR (input RNA). (D) Schema of wt APTR (as in Fig. 1B) and deletion mutants with locations of primer sets 1 and 2 used to detect APTR. Summary of Figure 4D (PcG binding) and Figure 6A (p21 silencing) indicated on the right. (E) EZH2 and SUZ12 interact with the 3′-portion of APTR in an experiment similar to Figure 4C. Top 4 panels: Proteins input or pulled down by biotinylated APTR detected by immunoblots. Bottom 2 panels: WT and mutant APTR were pulled down at comparable levels on strepavidin beads as detected by RT-PCR with primer sets 1 and 2 (note that some deletions can be detected only by one primer pair).
Figure 5
Figure 5. APTR regulates p21 epigenetically via the PRC2 complex.
(A) Q-RT-PCR shows induction of p21 mRNA normalized to GAPDH after EZH2 or SUZ12 knockdown on the left. Fold change compared to siGL2-transfected cells. Mean ±s.e.m, n>6, **: P = 0.006. ***: P<0.0001). (B) Endogenous EZH2 and SUZ12 were analyzed by immunoblot after EZH2 or SUZ12 knockdown as a control for Figure 5A. (C) Schematic of p21 promoter and primer pairs for CLIP PCR (as in Figure 3F). Boxes: binding of indicated proteins/RNA in control cells (Figure 3F, 5E–F). Grey areas: regions where binding is downregulated by siAPTR#2. (D) qRT-PCR shows APTR knockdown efficiency by siAPTR#2 in Figure 5E–G. (E–F) ChIP of SUZ12 or H3K27me3 on the p21 promoter in 293T cells transfected by either siGL2 or siAPTR#2. X-axes: primer-pairs 1–7 in Figure 3F. Y-axes: %Input values were presented. Mean ±s.e.m. n = 6. (G) ChIP of SUZ12 or H3K27me3 on the HOXD11 locus in 293T cells transfected by either siGL2 or siAPTR#2. X- axis: antibodies used for ChIP. Y-axis: % input of HOXD11 locus in precipitates. (n.s.: not significant, Mean ±s.e.m. n = 6) (H) CLIP of MS2-APTR or MS2 RNA alone in the p21 promoter (primer-pair 2 in Figure 3F) and the HOXD11 locus. Mean ±s.e.m. n = 6. Y-axis shows amount of specific DNA in the precipitate normalized to that in the CLIP of MS2 alone. (I) CLIP of MS2-APTR or MS2 RNA alone on the p21 promoter in 293T cells transfected by siGL2 or siEZH2. X-axes: primer-pairs 1-7 in Figure 3F. Y-axis: amount of specific DNA in the precipitate normalized to that in CLIP of MS2 alone. Mean ±s.e.m. n = 3.
Figure 6
Figure 6. The embedded c-Alu and the 3′ end of APTR are each required for p21 suppression.
(A) Q-RT-PCR of p21 mRNA after siAPTR#2 (black bars) and transfection of empty vector or vector expressing wild-type or mutant APTR in 293T cells. X-axis: empty vector or form of APTR expressed by transfected plasmid. Red represents the mutants that bind to PRC2. Blue represents the ones that do not bind to PRC2. Y-axis: fold change of p21 normalized to GAPDH relative to siGL2-transfected cells receiving empty vector (white bar). Mean ±s.e.m; n = 6, ***: P<0.0005. **: P<0.005. (B) Firefly luciferase activity of p21 promoter in cells transfected with empty vector or vector expressing wild-type or deletion mutants of APTR. Red represents the mutants that bind to PRC2. Blue represents the ones that do not bind to PRC2. Firefly luciferase activities were normalized to Renilla luciferase from co-transfected plasmid. (C) CLIP of MS2-APTR or MS2-APTRΔAlu(650–2303) or MS2 RNA alone (negative control) on two sites in the p21 promoter (2 and 5 as defined in Figure 3F). Y-axis: amount of specific DNA in the precipitate normalized to that in CLIP of MS2 RNA alone. Mean ±s.e.m., n = 6. Northern blot on the right with APTR cDNA (651–950), shows that the APTR fusion RNAs are expressed.
Figure 7
Figure 7. The implication of APTR-mediated p21 silencing in normal cell function and cancer.
(A) A schematic of the lncRNA APTR-mediated p21 gene silencing. APTR suppresses p21 gene expression by guiding the PRC2 complex to the p21 promoter. (B–C) RT-PCR of indicated transcripts in indicated cells. GAPDH and 18SrRNA are loading controls. (D–E) Overexpression of exogenous APTR (indicated at bottom) suppresses the induction of p21 after heat shock or after Doxorubicin in indicated cells. RT: reverse transcriptase. Fewer PCR cycles were done compared to Figure 7B explaining why endogenous APTR is not seen. (F) siAPTR induces p21 in human glioma cells. Q-RT-PCR of p21 mRNA normalized to GAPDH. Mean ±s.e.m; n = 3. (G) Levels of APTR and p21 mRNAs in ten GBMs. Fold change in the GBM relative to normal brain tissue (average of two normal brains). (H) Scatter plot of the data in Figure 7G to show the anti-correlation between APTR and p21 RNAs. Pearson R = −0.254. unpaired t test P = 0.004, n = 10.

Similar articles

Cited by

References

    1. Rinn JL, Kertesz M, Wang JK, Squazzo SL, Xu X, et al. (2007) Functional demarcation of active and silent chromatin domains in human HOX loci by noncoding RNAs. Cell 129: 1311–1323. - PMC - PubMed
    1. Loewer S, Cabili MN, Guttman M, Loh YH, Thomas K, et al. (2010) Large intergenic non-coding RNA-RoR modulates reprogramming of human induced pluripotent stem cells. Nat Genet 42: 1113–1117. - PMC - PubMed
    1. Wang KC, Chang HY (2011) Molecular mechanisms of long noncoding RNAs. Mol Cell 43: 904–914. - PMC - PubMed
    1. Zhao J, Sun BK, Erwin JA, Song JJ, Lee JT (2008) Polycomb proteins targeted by a short repeat RNA to the mouse X chromosome. Science 322: 750–756. - PMC - PubMed
    1. Bracken AP, Helin K (2009) Polycomb group proteins: navigators of lineage pathways led astray in cancer. Nat Rev Cancer 9: 773–784. - PubMed

Publication types