

Diagnostic testing of pediatric fevers: meta-analysis of 13 national surveys assessing influences of malaria endemicity and source of care on test uptake for febrile children under five years
- PMID: 24748201
- PMCID: PMC3991688
- DOI: 10.1371/journal.pone.0095483
Diagnostic testing of pediatric fevers: meta-analysis of 13 national surveys assessing influences of malaria endemicity and source of care on test uptake for febrile children under five years
Abstract
Background: In 2010, the World Health Organization revised guidelines to recommend diagnosis of all suspected malaria cases prior to treatment. There has been no systematic assessment of malaria test uptake for pediatric fevers at the population level as countries start implementing guidelines. We examined test use for pediatric fevers in relation to malaria endemicity and treatment-seeking behavior in multiple sub-Saharan African countries in initial years of implementation.
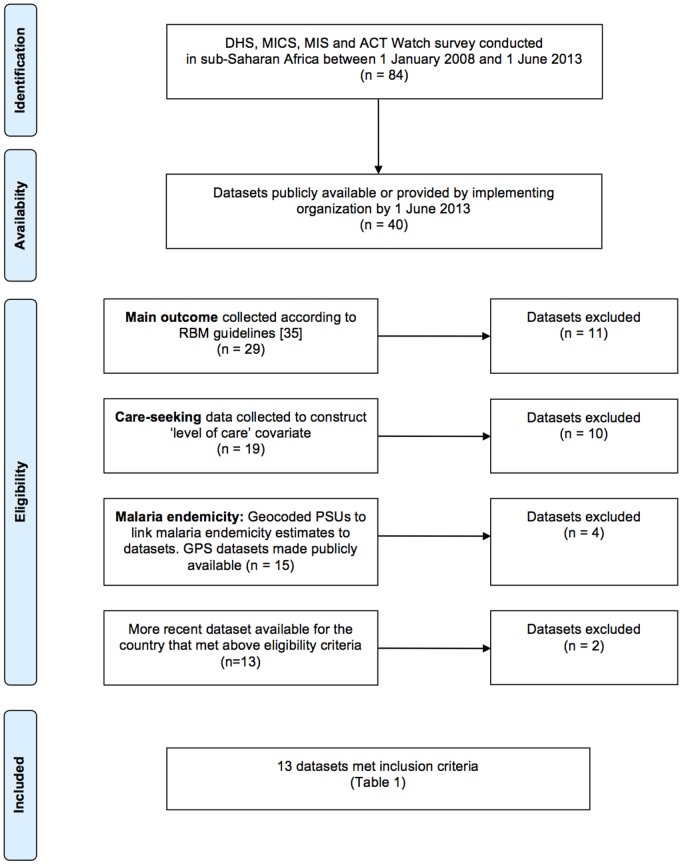
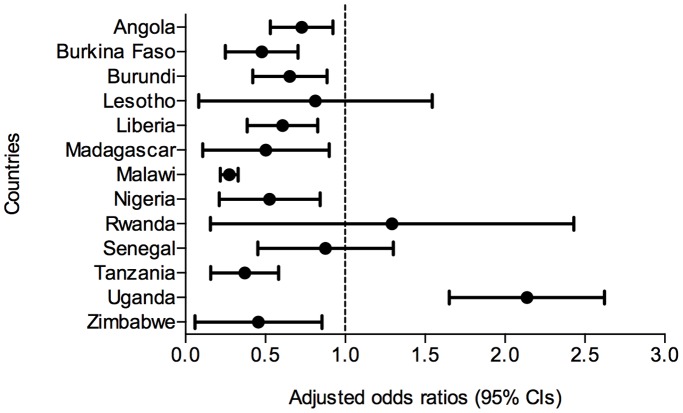
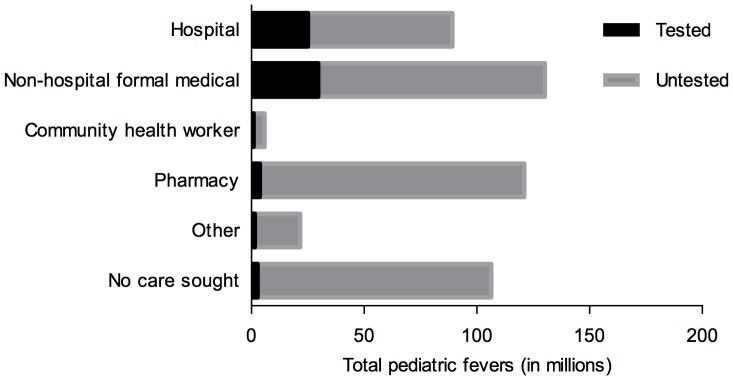
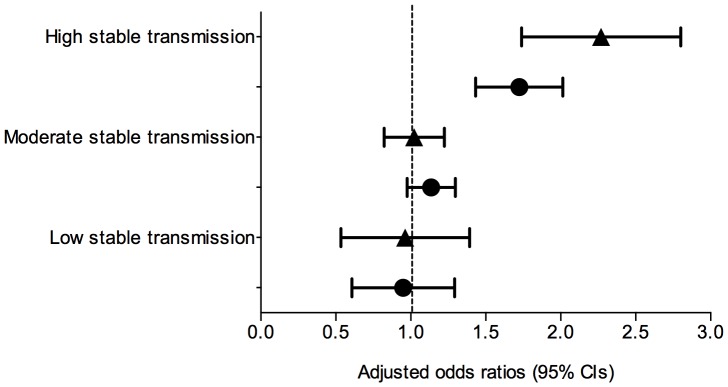
Methods and findings: We compiled data from national population-based surveys reporting fever prevalence, care-seeking and diagnostic use for children under five years in 13 sub-Saharan African countries in 2009-2011/12 (n = 105,791). Mixed-effects logistic regression models quantified the influence of source of care and malaria endemicity on test use after adjusting for socioeconomic covariates. Results were stratified by malaria endemicity categories: low (PfPR2-10<5%), moderate (PfPR2-10 5-40%), high (PfPR2-10>40%). Among febrile under-fives surveyed, 16.9% (95% CI: 11.8%-21.9%) were tested. Compared to hospitals, febrile children attending non-hospital sources (OR: 0.62, 95% CI: 0.56-0.69) and community health workers (OR: 0.31, 95% CI: 0.23-0.43) were less often tested. Febrile children in high-risk areas had reduced odds of testing compared to low-risk settings (OR: 0.51, 95% CI: 0.42-0.62). Febrile children in least poor households were more often tested than in poorest (OR: 1.63, 95% CI: 1.39-1.91), as were children with better-educated mothers compared to least educated (OR: 1.33, 95% CI: 1.16-1.54).
Conclusions: Diagnostic testing of pediatric fevers was low and inequitable at the outset of new guidelines. Greater testing is needed at lower or less formal sources where pediatric fevers are commonly managed, particularly to reach the poorest. Lower test uptake in high-risk settings merits further investigation given potential implications for diagnostic scale-up in these areas. Findings could inform continued implementation of new guidelines to improve access to and equity in point-of-care diagnostics use for pediatric fevers.
Conflict of interest statement
Figures
References
-
- World Health Organization (2000) The use of anti-malarial drugs: report of a WHO informal consultation. Geneva: World Health Organization.
-
- Källander K, Nsungwa-Sabiiti J, Peterson S (2004) Symptom overlap for malaria and pneumonia – policy implications for home management strategies. Acta Trop 90: 211–4. - PubMed
-
- World Health Organization (2010) Guidelines for the treatment of malaria. Geneva: World Health Organization.
Publication types
MeSH terms
Grants and funding
LinkOut - more resources
Full Text Sources
Other Literature Sources
Medical
