

The influence of between-farm distance and farm size on the spread of classical swine fever during the 1997-1998 epidemic in The Netherlands
- PMID: 24748233
- PMCID: PMC3991596
- DOI: 10.1371/journal.pone.0095278
The influence of between-farm distance and farm size on the spread of classical swine fever during the 1997-1998 epidemic in The Netherlands
Abstract
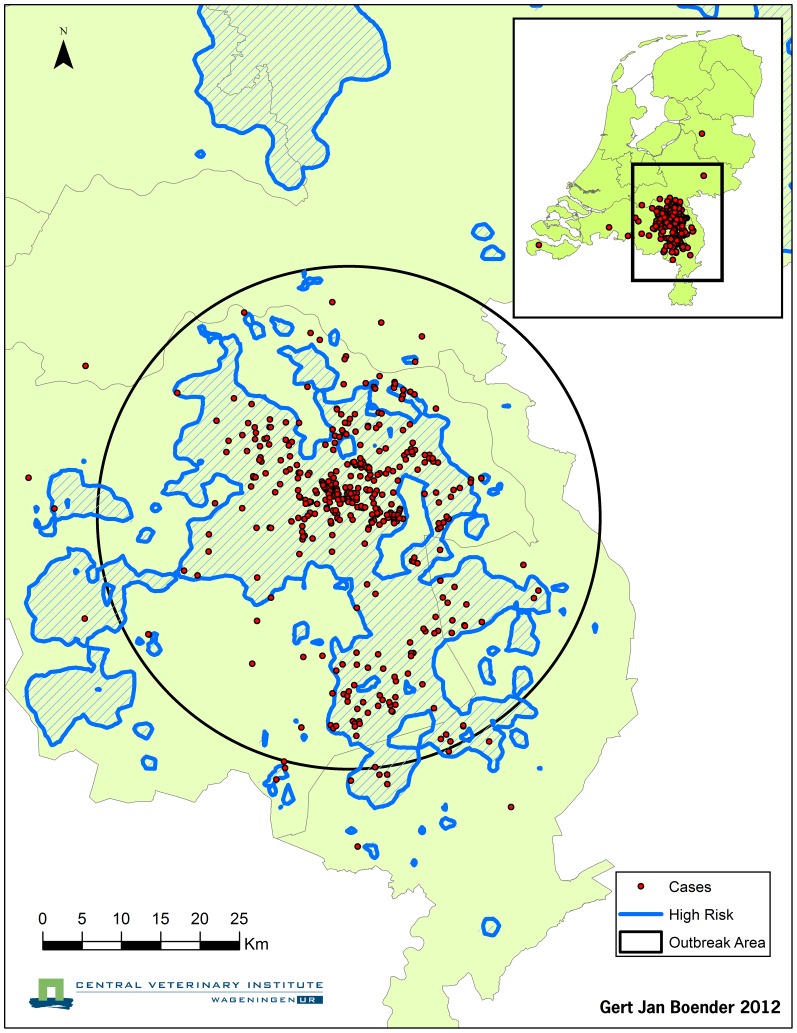
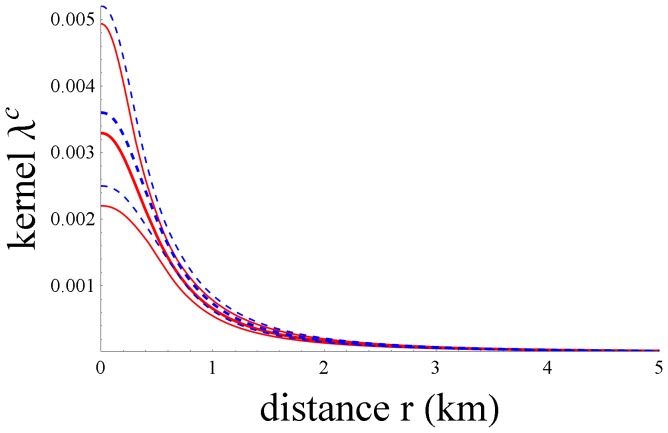
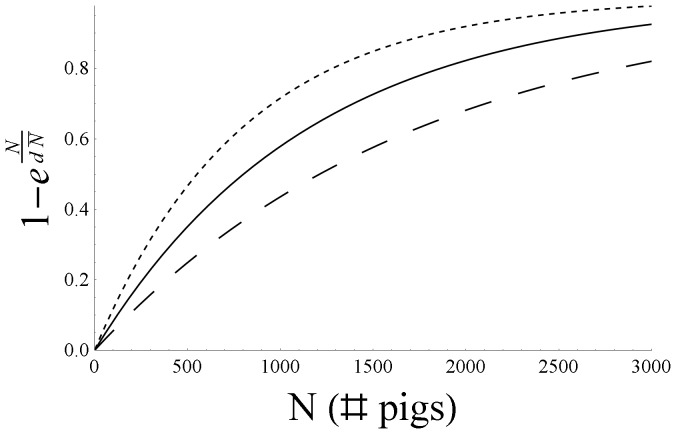
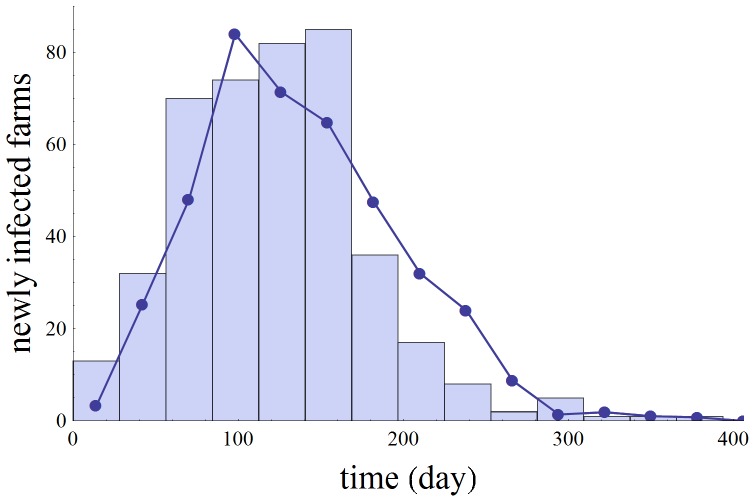
As the size of livestock farms in The Netherlands is on the increase for economic reasons, an important question is how disease introduction risks and risks of onward transmission scale with farm size (i.e. with the number of animals on the farm). Here we use the epidemic data of the 1997-1998 epidemic of Classical Swine Fever (CSF) Virus in The Netherlands to address this question for CSF risks. This dataset is one of the most powerful ones statistically as in this epidemic a total of 428 pig farms where infected, with the majority of farm sizes ranging between 27 and 1750 pigs, including piglets. We have extended the earlier models for the transmission risk as a function of between-farm distance, by adding two factors. These factors describe the effect of farm size on the susceptibility of a 'receiving' farm and on the infectivity of a 'sending' farm (or 'source' farm), respectively. Using the best-fitting model, we show that the size of a farm has a significant influence on both farm-level susceptibility and infectivity for CSF. Although larger farms are both more susceptible to CSF and, when infected, more infectious to other farms than smaller farms, the increase is less than linear. The higher the farm size, the smaller the effect of increments of farm size on the susceptibility and infectivity of a farm. Because of changes in the Dutch pig farming characteristics, a straightforward extrapolation of the observed farm size dependencies from 1997/1998 to present times would not be justified. However, based on our results one may expect that also for the current pig farming characteristics in The Netherlands, farm susceptibility and infectivity depend non-linearly on farm size, with some saturation effect for relatively large farm sizes.
Conflict of interest statement
Figures
References
-
- Pluimers FH, de Leeuw PW, Smak JA, Elbers ARW, Stegeman JA (1999) Classical swine fever in The Netherlands 1997–1998: a description of organisation and measures to eradicate the disease. Preventive Veterinary Medicine 42: 139–155. - PubMed
-
- Centraal Bureau voor de Statistiek: gewassen, dieren en grondgebruik naar regio. Available: http://statline.cbs.nl/StatWeb/publication/?DM=SLNL&PA=80780NED&D1=502,5.... Accessed 2 December 2013.
-
- Stegeman JA, Elbers ARW, de Smit H, Moser H, Smak JA, et al. (2000) The 1997–1998 epidemic of classical swine fever in the Netherlands. Vet Microbiol 73: 183–196. - PubMed
-
- Elbers ARW, Stegeman JA, Moser H, Ekker HM, Smak JA, et al. (1999) The classical swine fever epidemic 1997–1998 in the Netherlands: descriptive epidemiology. Prev Vet Med 42: 157–184. - PubMed
-
- Benard HJ, Stärk KDC, Morris RS, Pfeiffer DU, Moser H (1999) The 1997–1998 classical swine fever epidemic in the Netherlands - a survival analysis. Prev Vet Med 42: 235–248. - PubMed
Publication types
MeSH terms
LinkOut - more resources
Full Text Sources
Other Literature Sources
Research Materials
