

Targeting c-Met receptor overcomes TRAIL-resistance in brain tumors
- PMID: 24748276
- PMCID: PMC3991662
- DOI: 10.1371/journal.pone.0095490
Targeting c-Met receptor overcomes TRAIL-resistance in brain tumors
Abstract
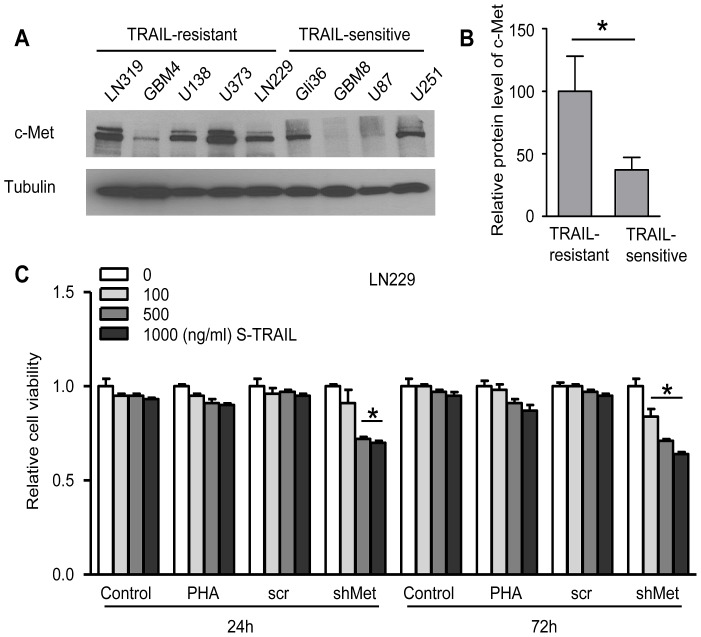
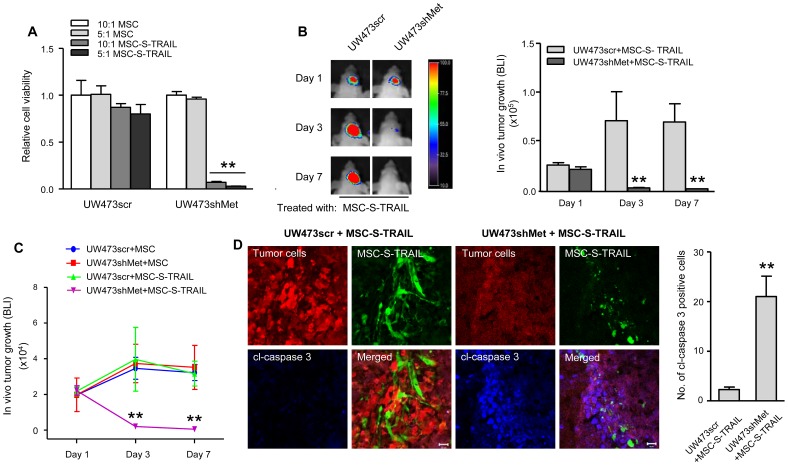
Tumor necrosis factor related apoptosis-inducing ligand (TRAIL) induced apoptosis specifically in tumor cells. However, with approximately half of all known tumor lines being resistant to TRAIL, the identification of TRAIL sensitizers and their mechanism of action become critical to broadly use TRAIL as a therapeutic agent. In this study, we explored whether c-Met protein contributes to TRAIL sensitivity. We found a direct correlation between the c-Met expression level and TRAIL resistance. We show that the knock down c-Met protein, but not inhibition, sensitized brain tumor cells to TRAIL-mediated apoptosis by interrupting the interaction between c-Met and TRAIL cognate death receptor (DR) 5. This interruption greatly induces the formation of death-inducing signaling complex (DISC) and subsequent downstream apoptosis signaling. Using intracranially implanted brain tumor cells and stem cell (SC) lines engineered with different combinations of fluorescent and bioluminescent proteins, we show that SC expressing a potent and secretable TRAIL (S-TRAIL) have a significant anti-tumor effect in mice bearing c-Met knock down of TRAIL-resistant brain tumors. To our best knowledge, this is the first study that demonstrates c-Met contributes to TRAIL sensitivity of brain tumor cells and has implications for developing effective therapies for brain tumor patients.
Conflict of interest statement
Figures


Similar articles
-
Hepatocyte growth factor enhances death receptor-induced apoptosis by up-regulating DR5.BMC Cancer. 2008 Nov 7;8:325. doi: 10.1186/1471-2407-8-325. BMC Cancer. 2008. PMID: 18992144 Free PMC article.
-
Cell-surface galectin-3 confers resistance to TRAIL by impeding trafficking of death receptors in metastatic colon adenocarcinoma cells.Cell Death Differ. 2012 Mar;19(3):523-33. doi: 10.1038/cdd.2011.123. Epub 2011 Sep 23. Cell Death Differ. 2012. PMID: 21941373 Free PMC article.
-
Real-time imaging of the dynamics of death receptors and therapeutics that overcome TRAIL resistance in tumors.Oncogene. 2013 Jun 6;32(23):2818-27. doi: 10.1038/onc.2012.304. Epub 2012 Jul 23. Oncogene. 2013. PMID: 22824792 Free PMC article.
-
Playing the DISC: turning on TRAIL death receptor-mediated apoptosis in cancer.Biochim Biophys Acta. 2010 Apr;1805(2):123-40. doi: 10.1016/j.bbcan.2009.11.004. Epub 2009 Dec 2. Biochim Biophys Acta. 2010. PMID: 19961901 Review.
-
Down-regulation of intracellular anti-apoptotic proteins, particularly c-FLIP by therapeutic agents; the novel view to overcome resistance to TRAIL.J Cell Physiol. 2018 Oct;233(10):6470-6485. doi: 10.1002/jcp.26585. Epub 2018 May 9. J Cell Physiol. 2018. PMID: 29741767 Review.
Cited by
-
Mesenchymal Epithelial Transition Factor Signaling in Pediatric Nervous System Tumors: Implications for Malignancy and Cancer Stem Cell Enrichment.Front Cell Dev Biol. 2021 May 13;9:654103. doi: 10.3389/fcell.2021.654103. eCollection 2021. Front Cell Dev Biol. 2021. PMID: 34055785 Free PMC article. Review.
-
Combination therapy with c-met inhibitor and TRAIL enhances apoptosis in dedifferentiated liposarcoma patient-derived cells.BMC Cancer. 2019 May 24;19(1):496. doi: 10.1186/s12885-019-5713-2. BMC Cancer. 2019. PMID: 31126284 Free PMC article.
-
c-Met and Other Cell Surface Molecules: Interaction, Activation and Functional Consequences.Biomedicines. 2015 Jan 15;3(1):46-70. doi: 10.3390/biomedicines3010046. Biomedicines. 2015. PMID: 28536399 Free PMC article. Review.
-
Visualization of Diagnostic and Therapeutic Targets in Glioma With Molecular Imaging.Front Immunol. 2020 Oct 30;11:592389. doi: 10.3389/fimmu.2020.592389. eCollection 2020. Front Immunol. 2020. PMID: 33193439 Free PMC article. Review.
-
Stem cell-based therapies for cancer treatment: separating hope from hype.Nat Rev Cancer. 2014 Oct;14(10):683-91. doi: 10.1038/nrc3798. Epub 2014 Sep 1. Nat Rev Cancer. 2014. PMID: 25176333 Free PMC article. Review.
References
-
- Bottaro DP, Rubin JS, Faletto DL, Chan AM, Kmiecik TE, et al. (1991) Identification of the hepatocyte growth factor receptor as the c-met proto-oncogene product. . Science 251: 802–804. - PubMed
-
- Cooper CS, Park M, Blair DG, Tainsky MA, Huebner K, et al. (1984) Molecular cloning of a new transforming gene from a chemically transformed human cell line. Nature 311: 29–33. - PubMed
-
- Birchmeier C, Birchmeier W, Gherardi E, Vande Woude GF (2003) Met, metastasis, motility and more. . Nat Rev Mol Cell Biol 4: 915–925. - PubMed
-
- Abounader R, Lal B, Luddy C, Koe G, Davidson B, et al. (2002) In vivo targeting of SF/HGF and c-met expression via U1snRNA/ribozymes inhibits glioma growth and angiogenesis and promotes apoptosis. Faseb J 16: 108–110. - PubMed
Publication types
MeSH terms
Substances
LinkOut - more resources
Full Text Sources
Other Literature Sources
Medical
Miscellaneous
