

Global migration and the changing distribution of sickle haemoglobin: a quantitative study of temporal trends between 1960 and 2000
- PMID: 24748392
- PMCID: PMC3986033
- DOI: 10.1016/S2214-109X(13)70150-5
Global migration and the changing distribution of sickle haemoglobin: a quantitative study of temporal trends between 1960 and 2000
Abstract
Background: Changes in the geographical distribution of genetic disorders are often thought to happen slowly, especially when compared with infectious diseases. Whereas mutations, genetic drift, and natural selection take place over many generations, epidemics can spread through large populations within a few days or weeks. Nevertheless, population movements can interfere with these processes, and few studies have been done of their eff ect on genetic disorders. We aimed to investigate the eff ect of global migration on the distribution of the sickle-cell gene-the most common and clinically significant haemoglobin structural variant.
Methods: For each country, we extracted data from the World Bank’s Global Bilateral Migration Database about international human migrations between 1960 and 2000. We combined this information with evidence-based estimates of national HbS allele frequencies, generated within a Bayesian geostatistical framework, to analyse temporal changes in the net numbers of migrants, and classified countries with an index summarising these temporal trends.
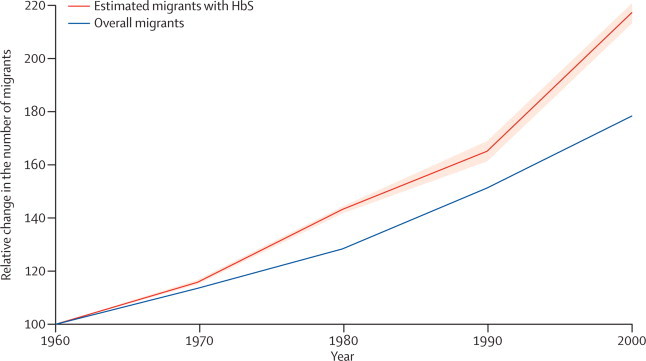
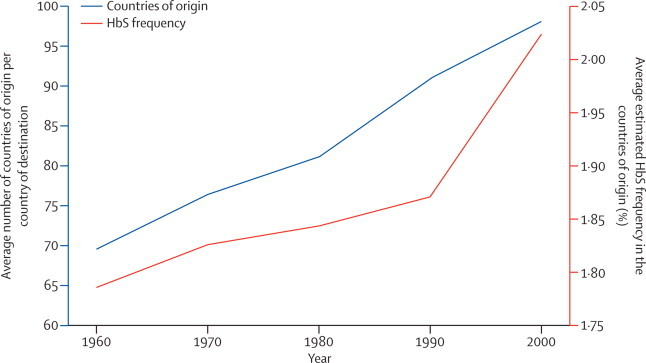
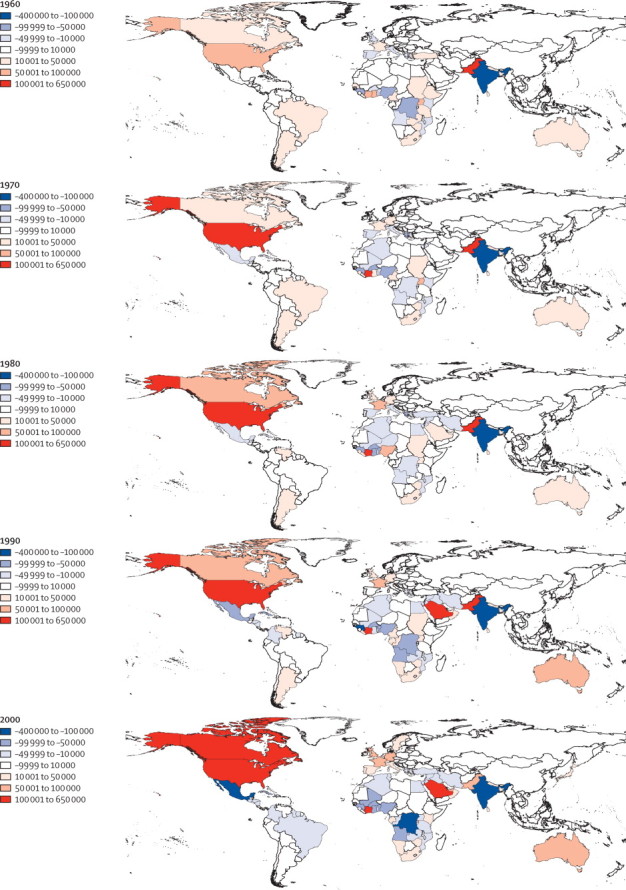
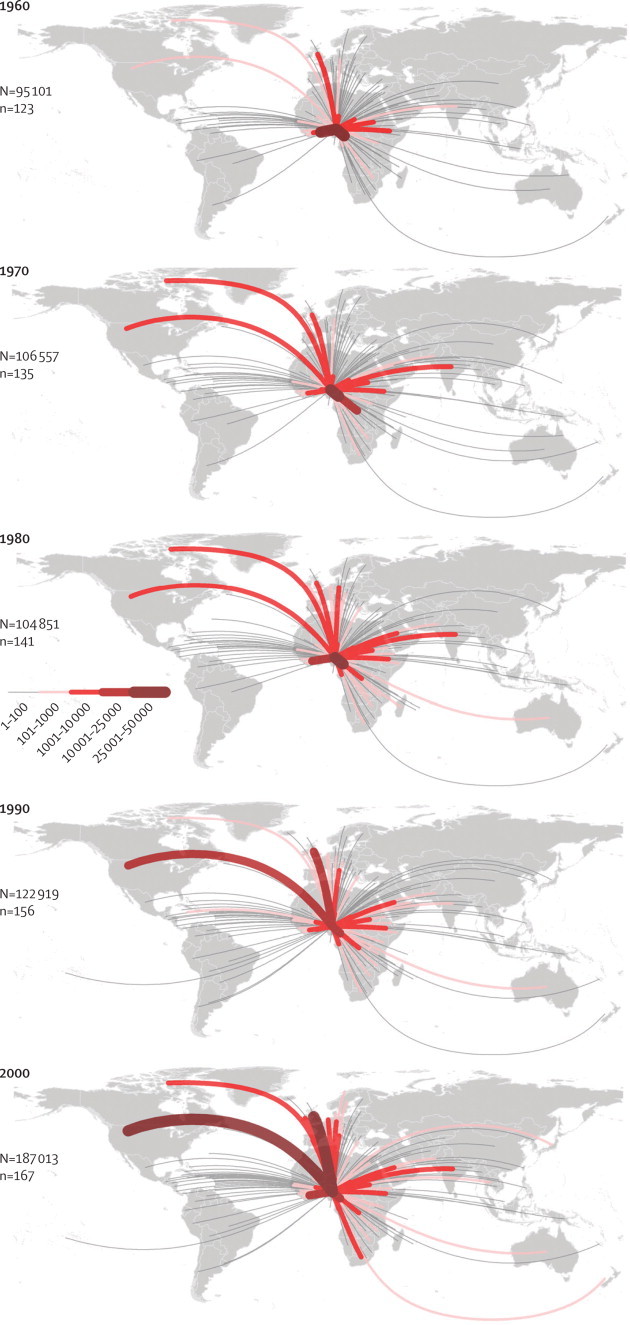
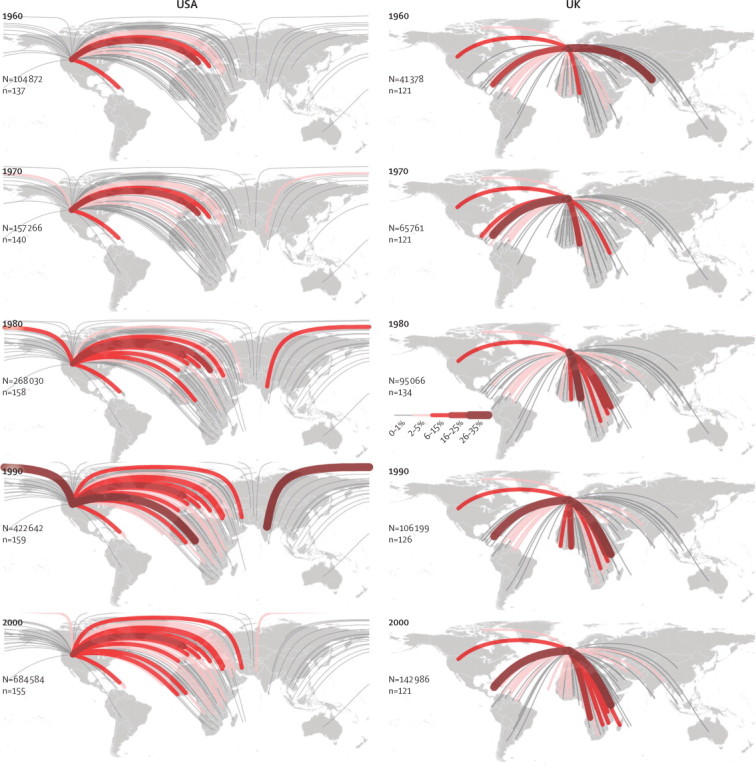
Findings: The number of international migrants increased from 92.6 million in 1960, to 165.2 million in 2000. The estimated global number of migrants with HbS increased from about 1.6 million in 1960, to 3.6 million in 2000. This increase was largely due to an increase in the number of migrants from countries with HbS allele frequencies higher than 10%, from 3.1 million in 1960, to 14.2 million in 2000. Additionally, the mean number of countries of origin for each destination country increased from 70 (SE 46) in 1960, to 98 (48) in 2000, showing an increasing diversity in the network of international migrations between countries. Our index of change map shows a patchy distribution of the magnitude of temporal changes, with the highest positive and negative values scattered across all continents.
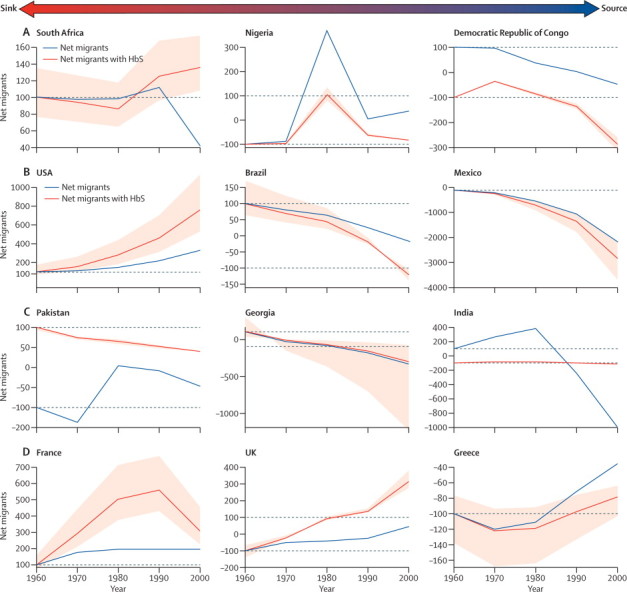
Interpretation: Global human population movements have had a substantial eff ect on the distribution of the HbS gene. Population movements can create a long-term burden on health-care systems. Our findings, which emphasise countries in which migration fluxes are changing the most, should increase awareness about the global burden of haemoglobinopathies and encourage policy makers to implement specific public health interventions, such as screening programmes and genetic counselling.
Funding: Wellcome Trust, European Research Council, Bill & Melinda Gates Foundation, National Institute of Allergy and Infectious Diseases-National Institutes of Health, the Research and Policy for Infectious Disease Dynamics program, Fogarty International Center.
Figures
Comment in
-
Sickle haemoglobin comes of age.Lancet Glob Health. 2014 Feb;2(2):e59-60. doi: 10.1016/S2214-109X(13)70167-0. Epub 2014 Jan 14. Lancet Glob Health. 2014. PMID: 25104653 No abstract available.
References
-
- Özden Ç, Parsons CR, Schiff M, Walmsley TL. Where on earth is everybody? The evolution of global bilateral migration 1960–2000. June, 2011. http://www-wds.worldbank.org/servlet/WDSContentServer/WDSP/IB/2011/06/28... (accessed Jan 1, 2014).
-
- WHO . The world health report 2007—a safer future: global public health security in the 21st century. World Health Organization; Geneva: 2007.
Publication types
MeSH terms
Substances
Grants and funding
LinkOut - more resources
Full Text Sources
Other Literature Sources
Medical
