. 2014 Jun;42(10):6603-15.
doi: 10.1093/nar/gku286. Epub 2014 Apr 19.

Genome-wide RNA-binding analysis of the trypanosome U1 snRNP proteins U1C and U1-70K reveals cis/trans-spliceosomal network

Affiliations

Genome-wide RNA-binding analysis of the trypanosome U1 snRNP proteins U1C and U1-70K reveals cis/trans-spliceosomal network

Christian Preußer et al. Nucleic Acids Res. 2014 Jun.

Abstract

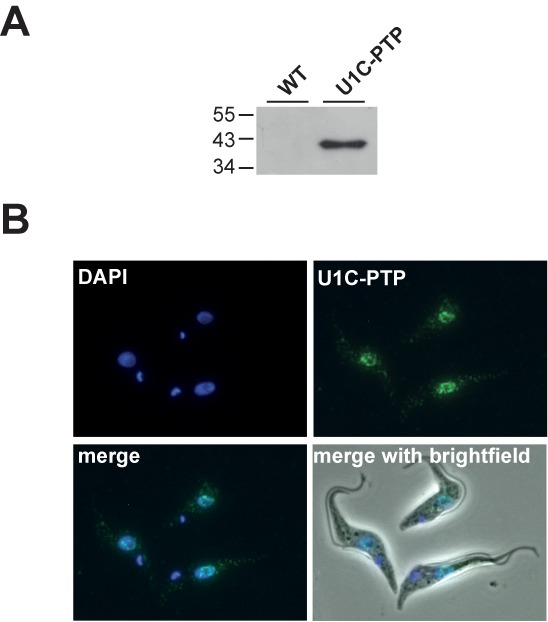
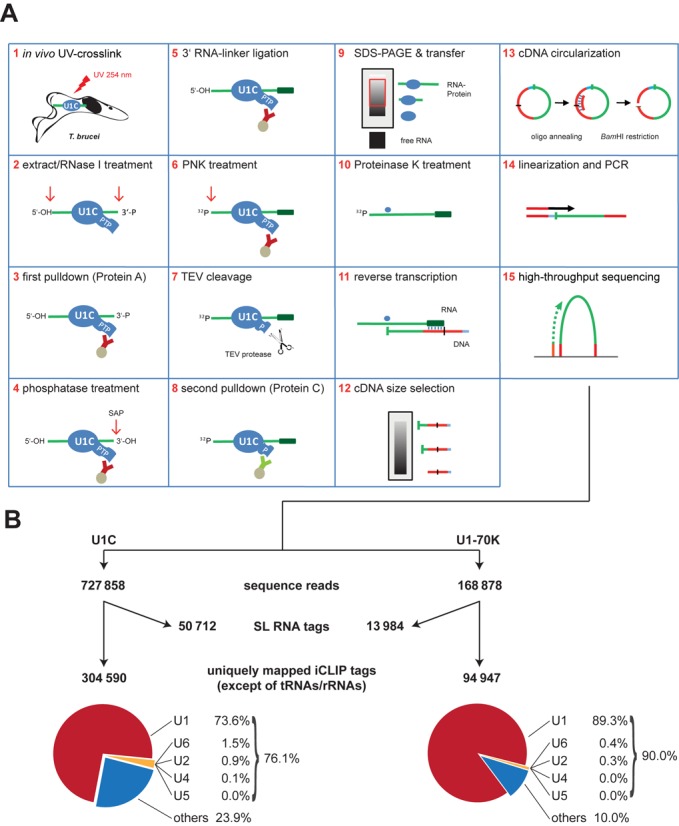
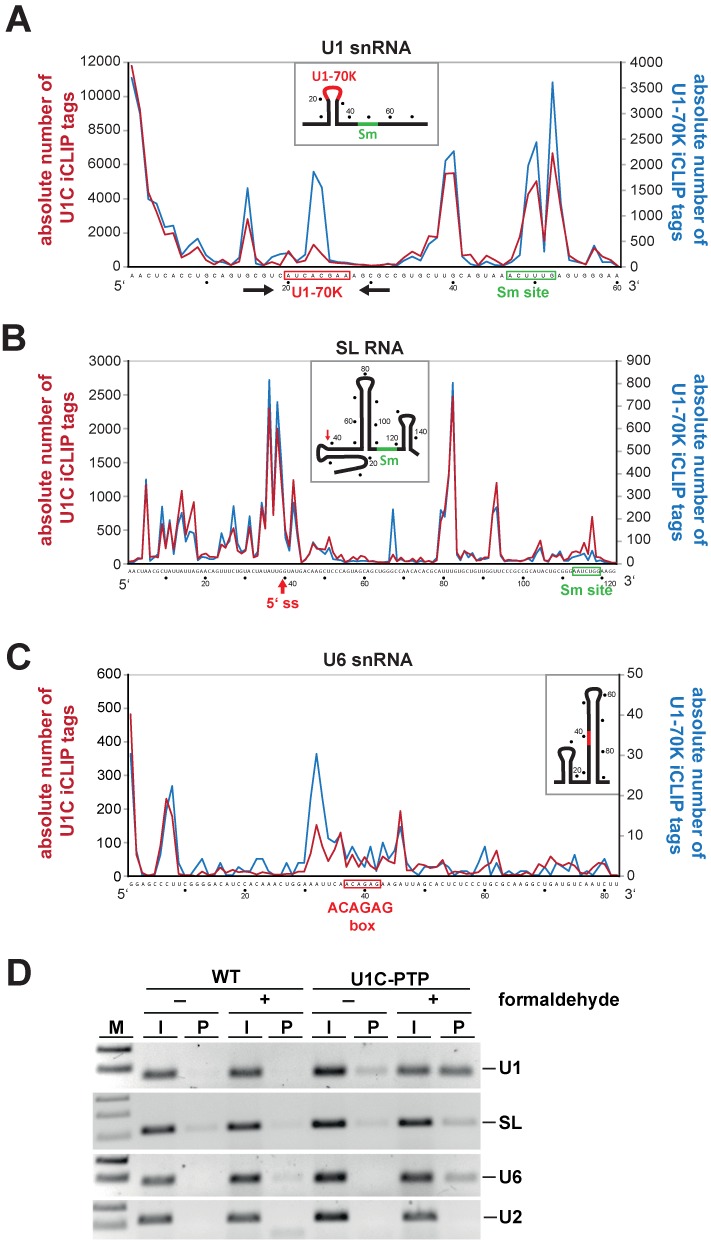
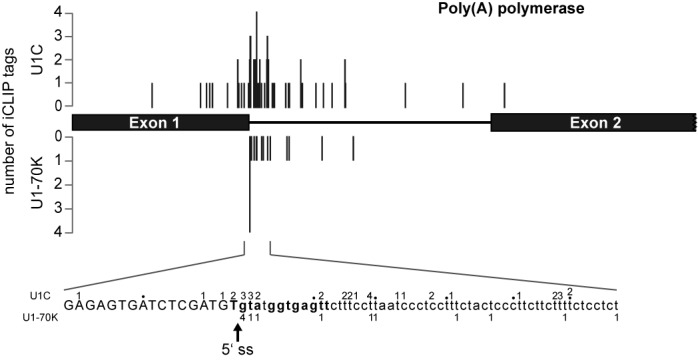
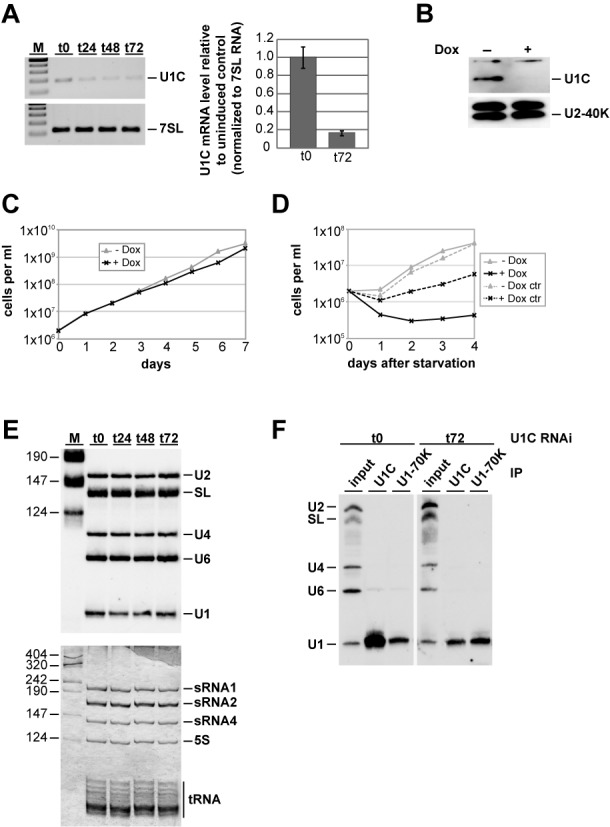
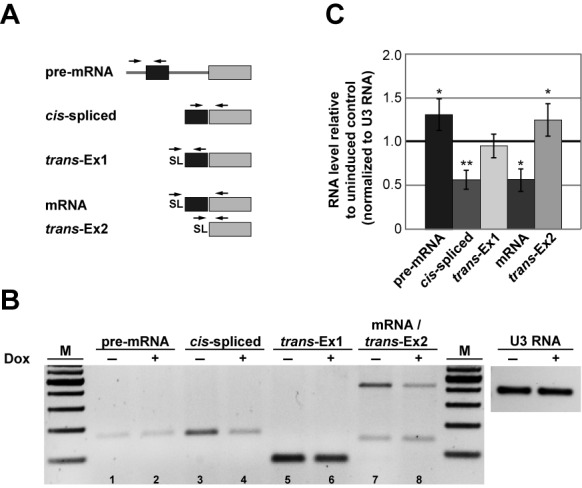
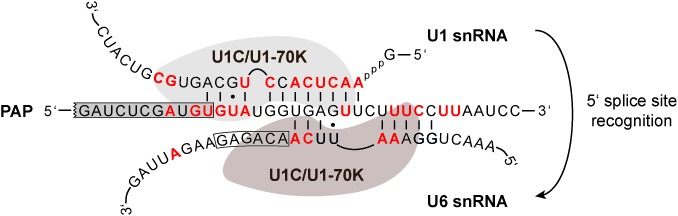
Trans-splicing in trypanosomes adds a 39-nucleotide mini-exon from the spliced leader (SL) RNA to the 5' end of each protein-coding sequence. On the other hand, cis-splicing of the few intron-containing genes requires the U1 small nuclear ribonucleoprotein (snRNP) particle. To search for potential new functions of the U1 snRNP in Trypanosoma brucei, we applied genome-wide individual-nucleotide resolution crosslinking-immunoprecipitation (iCLIP), focusing on the U1 snRNP-specific proteins U1C and U1-70K. Surprisingly, U1C and U1-70K interact not only with the U1, but also with U6 and SL RNAs. In addition, mapping of crosslinks to the cis-spliced PAP [poly(A) polymerase] pre-mRNA indicate an active role of these proteins in 5' splice site recognition. In sum, our results demonstrate that the iCLIP approach provides insight into stable and transient RNA-protein contacts within the spliceosomal network. We propose that the U1 snRNP may represent an evolutionary link between the cis- and trans-splicing machineries, playing a dual role in 5' splice site recognition on the trans-spliceosomal SL RNP as well as on pre-mRNA cis-introns.


Figures

Figure 1.
Figure 1.
Expression and nuclear localization of Trypanosoma brucei U1C-PTP. (A) Expression of U1C-PTP was controlled by western blotting with polyclonal antibodies against the protein A epitope of the PTP tag, comparing wild-type (WT) and U1C-PTP expressing cells (U1C-PTP). Protein size markers in kDa. (B) T. brucei cells stably expressing U1C-PTP were fixed and stained with DAPI (DAPI). In parallel, PTP-tagged U1C was detected by anti-protein A primary antibody and Alexa-Fluor-488-coupled secondary antibody (U1C-PTP). In addition, merged views are shown (‘merge’: DAPI and U1C-PTP staining; ‘merge with brightfield’).
Figure 2.
Figure 2.
Genome-wide mapping of U1C and U1-70K RNA–protein interactions in trypanosomes by iCLIP-Seq: strategy and statistics. (A) Schematic overview of the iCLIP-Seq approach, as adapted for Trypanosoma brucei cell lines stably expressing PTP-tagged RNA-binding proteins (here: U1C). For a detailed description, see ‘Results’ section. (B) Summary of distribution of U1C and U1-70K iCLIP tags. The numbers of sequence reads, of uniquely mapped reads for the Tb427 genome and of the separately aligned SL RNA tags represent the sum of three (U1C) or two (U1-70K) biological replicates (for the numbers of the individual experiments, see Supplementary Figure S1). The pie charts show the distribution of uniquely mapped reads in snRNAs (U1, U2, U4, U5 and U6) and genomic regions other than snRNA and SL RNA loci (‘others’).
Figure 3.
Figure 3.
Crosslink site profiles of Trypanosoma brucei U1C and U1-70K on the U1, SL and U6 snRNAs. (A–C) The numbers of random-barcode-filtered iCLIP tag counts for U1C (red line) and U1-70K (blue line) iCLIP tags (crosslink sites) on the U1, SL and U6 snRNAs are plotted in single-nucleotide resolution. Only truncated versions of the entire RNA sequences without the last 15 nucleotides are shown (U1 snRNA: nucleotides 1–60; SL RNA: 1–123; U6 snRNA: 1–82), since for technical reasons iCLIP tags further 3′ cannot be mapped. Schematic models of the secondary structures are depicted for each RNA. (A) iCLIP profiles on the U1 snRNA. The U1-70K (red) and the Sm binding sites (green) are boxed, the stem-loop structure is indicated by arrows. (B) iCLIP profiles on the SL RNA. The 5′ splice site (5′ss; after position 39) is highlighted by a red arrow, the Sm site boxed in green. (C) iCLIP profiles on the U6 snRNA. The highly conserved ACAGAG hexanucleotide, which interacts with the 5′ splice site, is boxed in red. (D) Validations of U1C iCLIP tags for the U1, SL and U6 snRNAs. Cell extracts were prepared from T. brucei wild-type (WT) cells and a cell line stably expressing PTP-tagged U1C, without (−) and with (+) prior crosslinking by formaldehyde. Extracts were subjected to IgG pulldown of PTP-tagged complexes, followed by crosslink reversal. Copurifying U1, SL and U6 snRNAs (as indicated on the right) were detected by RT-PCR (lanes P). For comparison, 1% of the total input is shown (lanes I). M, markers (100 and 200 bp; for panel SL: 100, 200 and 300 bp).
Figure 4.
Figure 4.
Crosslink site profiles of Trypanosoma brucei U1C and U1-70K on the poly(A) polymerase (PAP) pre-mRNA. The numbers of random-barcode-filtered iCLIP tags for U1C and U1-70K are plotted on the Y-axis with the corresponding crosslink sites. Shown are the exon–intron–exon region of the PAP pre-mRNA (top) and detailed information on the absolute number of CLIP tags at nucleotide resolution for the 5′ splice site region (bottom; U1C above, U1-70K below the sequence); the arrow marks the 5′ splice site (5′ ss).
Figure 5.
Figure 5.
Effects of RNAi-mediated depletion of Trypanosoma brucei U1C on growth and U1 snRNP integrity. (A, B) RNAi-mediated knockdown of U1C expression. 24, 48 or 72 h after RNAi induction (as indicated), RNA was analyzed by semiquantitative RT-PCR (top) and real-time PCR (bottom). In addition, RNA from uninduced cells (t0) was included, and, as a control, 7SL RNA was measured from the same RNA samples (A). M, markers (100, 200, 300, 400 and 500 bp). In parallel, U1C protein was detected by immunoblotting with affinity-purified polyclonal antibodies, using U2-40K protein as a control (B). (C) Growth curve of a representative clonal procyclic T. brucei cell line, in which RNAi against the U1C mRNA was induced. Cells were grown for 7 days in the absence (−Dox; gray line with triangles) or in the presence of doxycyline (+Dox; black line with crosses), counted every day, and diluted back to 2 × 10⁶ cells/ml. (D) Recovery of procyclic cells with or without induction of U1C RNAi from starvation stress. Cells were grown for 1 day in the absence (−Dox) or in the presence of 1 mg/ml doxycycline (+Dox). As a control for growth effects of doxycycline, control cells (ctr) were grown for 1 day under the same conditions. 2 × 10⁶ cells/ml were collected, washed twice in phosphate-buffered saline (PBS), resuspended in the original volume of PBS, and incubated at 27°C for 2 h. After starvation stress, cells were harvested again, resuspended in the original volume SDM-79, and grown in the absence (−Dox; gray line with triangles) or in the presence of doxycyline (+Dox; black line with crosses). (E) U1C knockdown does not affect snRNA steady-state levels. From uninduced cells (t0) and 24, 48 and 72 h after silencing of U1C expression, equal amounts of RNA were analyzed by northern blot hybridization, using a mixed probe for U2, SL, U4, U6 and U1 snRNAs (top panel). As a loading control, equal amounts of RNAs were detected by silver staining (bottom panel). Positions of snRNAs, ribosomal RNAs and tRNAs are marked on the right. M, markers (in nucleotides). (F) Immunoprecipitation analysis of U1 snRNPs upon U1C knockdown. From uninduced cells (t0) and 72 h after U1C knockdown (t72), whole-cell extracts were prepared and subjected to immunoprecipitation (IP), using anti-U1C or U1-70K antibodies (as indicated). Copurifying RNAs were analyzed by northern blotting, using a mixed probe for U2, SL, U4, U6 and U1 snRNAs (positions indicated on the left). For comparison, 5% of each input is shown (lanes ‘input’).
Figure 6.
Figure 6.
U1C depletion decreases the efficiency of cis-splicing. (A) Schematic overview of the primer combinations used to detect PAP [poly(A) polymerase, Tb927.3.3160] pre-mRNA and mRNA by combinations of exon-, intergenic-region, intron- or SL-specific primers. The same primer pairs detected both cis-spliced and cis-unspliced products, as well as trans-spliced mRNA (mRNA) and aberrant trans-splicing at exon 2 (trans-Ex2). (B) Inhibition of cis-splicing by U1C knockdown. Total RNA from uninduced (−) and induced (+) cells after 72 h were analyzed by semiquantitative RT-PCR, using the primer combinations described in panel (A). As a control, U3 RNA was measured from the same RNA samples. M, markers (100, 200, 300, 400, 500, 600 and 700 bp). (C) Quantification of RT-PCR reactions shown in panel (B). Error bars represent standard deviations from three independent experiments. *P < 0.05 and **P < 0.01 versus uninduced control.
Figure 7.
Figure 7.
Model of 5′ splice site recognition in the PAP pre-mRNA and summary of U1C/U1-70K iCLIP tags. This schematic shows how the 5′ splice site in the cis-intron of the poly(A) polymerase (PAP) pre-mRNA can be sequentially recognized by the U1 snRNA (5′ terminal region) and the U6 snRNA (internal region), based on the proposed U1 snRNA (27) and a hypothetical, extended U6 snRNA base-pairing (this study). Boxed are the exonic nucleotides of the PAP pre-mRNA and the conserved ACAGAG sequence of the U6 snRNA. The iCLIP-derived U1C/U1-70K-crosslinked nucleotides in all three RNAs (U1, U6 and PAP) are highlighted in red, to allow direct comparison with the base-pairing interactions.

Similar articles

Cited by

References

    1. Preußer C., Jaé N., Günzl A., Bindereif A. Pre-mRNA splicing in Trypanosoma brucei: factors, mechanisms, and regulation. In: Bindereif A, editor. mRNA Metabolism in Trypanosomes. Berlin-Heidelberg: Springer-Verlag GmbH; 2012. pp. 49–77.
    1. Berriman M., Ghedin E., Hertz-Fowler C., Blandin G., Renauld H., Bartholomeu D.C., Lennard N.J., Caler E., Hamlin N.E., Haas B., et al. The genome of the African trypanosome Trypanosoma brucei. Science. 2005;309:416–422. - PubMed
    1. Siegel T.N., Hekstra D.R., Wang X., Dewell S., Cross G.A.M. Genome-wide analysis of mRNA abundance in two life-cycle stages of Trypanosoma brucei and identification of splicing and polyadenylation sites. Nucleic Acids Res. 2010;38:4946–4957. - PMC - PubMed
    1. Djikeng A., Ferreira L., D’Angelo M., Dolezal P., Lamb T., Murta S., Triggs V., Ulbert S., Villarino A., Renzi S., et al. Characterization of a candidate Trypanosoma brucei U1 small nuclear RNA gene. Mol. Biochem. Parasitol. 2001;113:109–115. - PubMed
    1. Palfi Z., Schimanski B., Günzl A., Lücke S., Bindereif A. U1 small nuclear RNP from Trypanosoma brucei: a minimal U1 snRNA with unusual protein components. Nucleic Acids Res. 2005;33:2493–2503. - PMC - PubMed

Publication types

MeSH terms

Associated data