. 2014 Jun;42(10):6286-99.
doi: 10.1093/nar/gku242. Epub 2014 Apr 19.

Histone H3 K79 methylation states play distinct roles in UV-induced sister chromatid exchange and cell cycle checkpoint arrest in Saccharomyces cerevisiae

Affiliations

Histone H3 K79 methylation states play distinct roles in UV-induced sister chromatid exchange and cell cycle checkpoint arrest in Saccharomyces cerevisiae

Alyssa A Rossodivita et al. Nucleic Acids Res. 2014 Jun.

Abstract

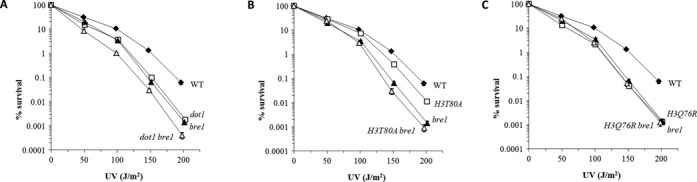
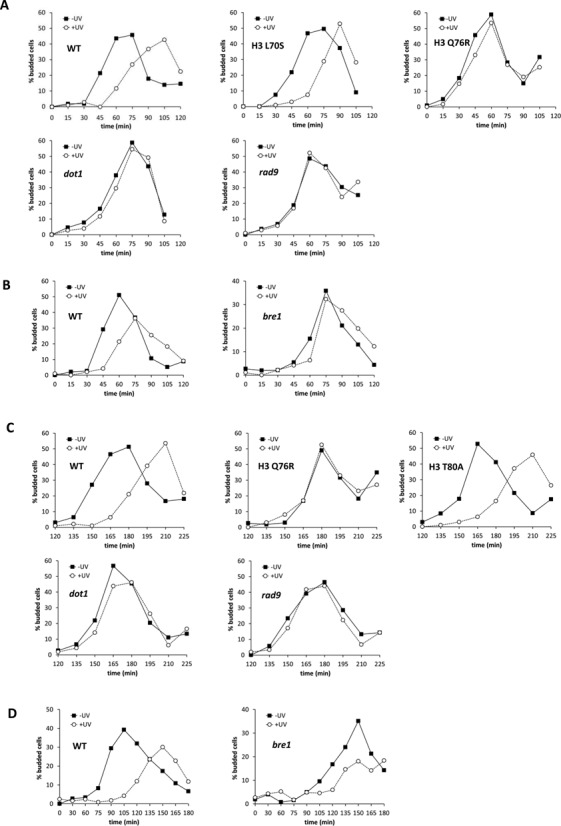
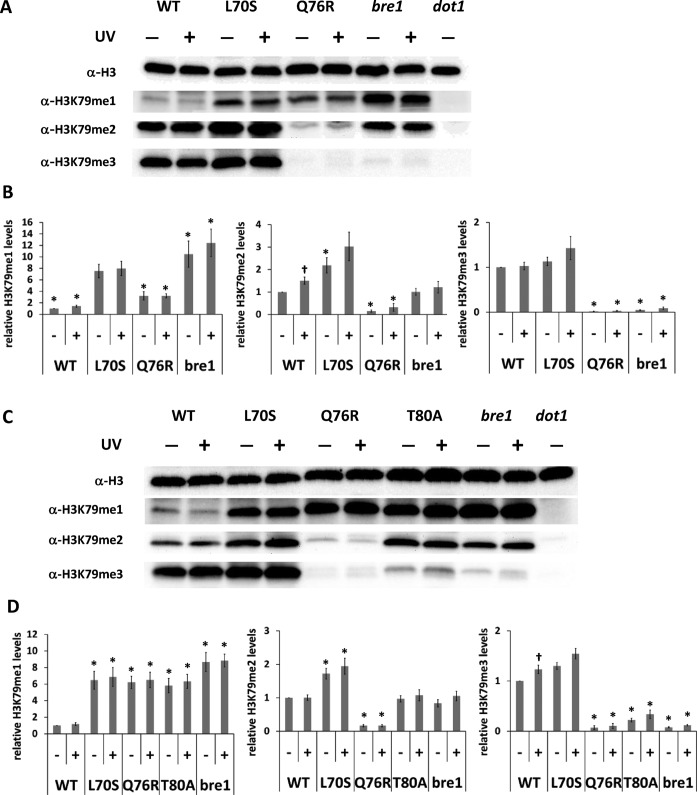
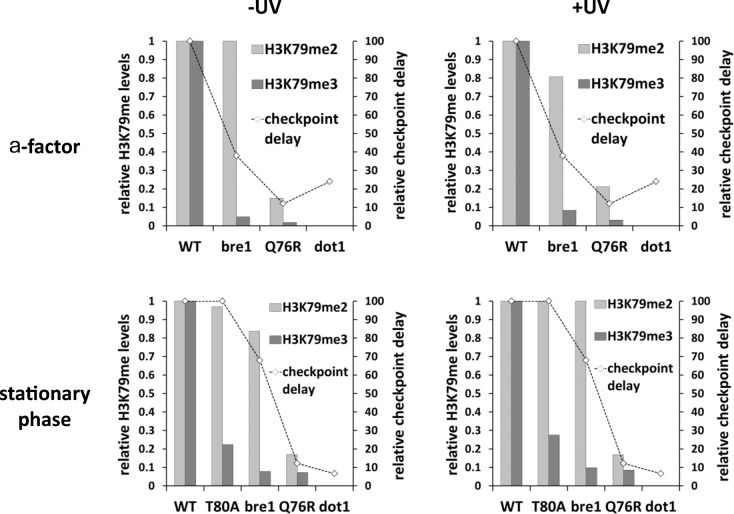
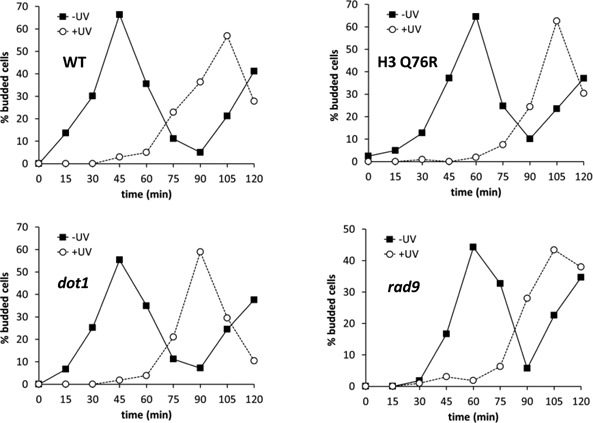
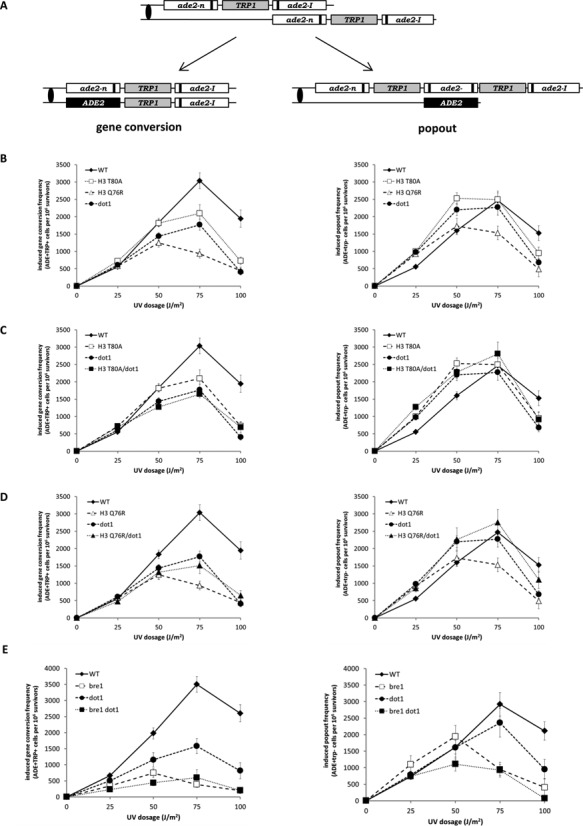
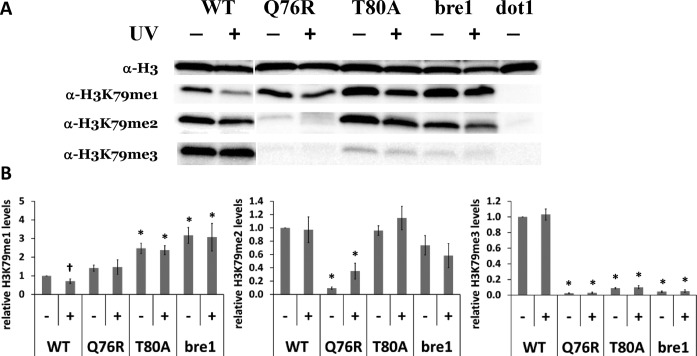
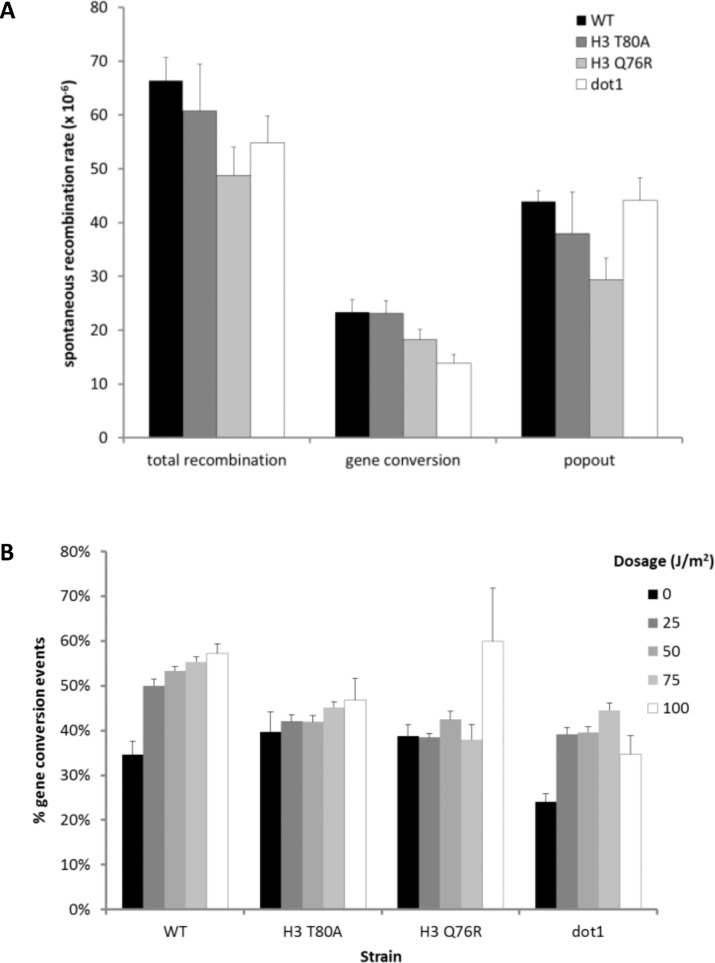
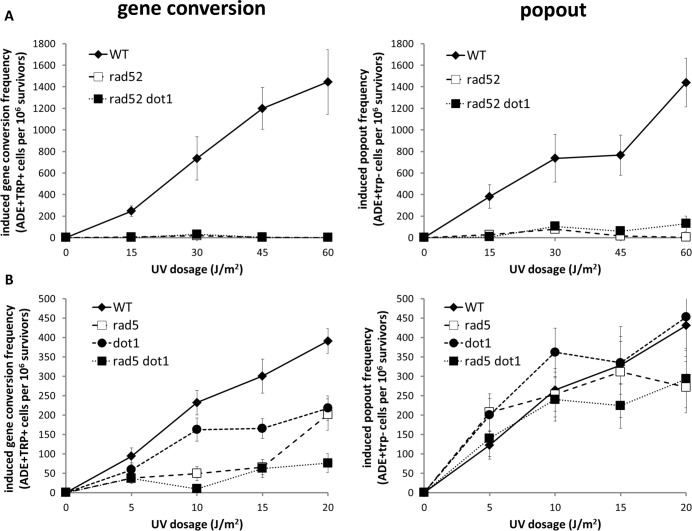
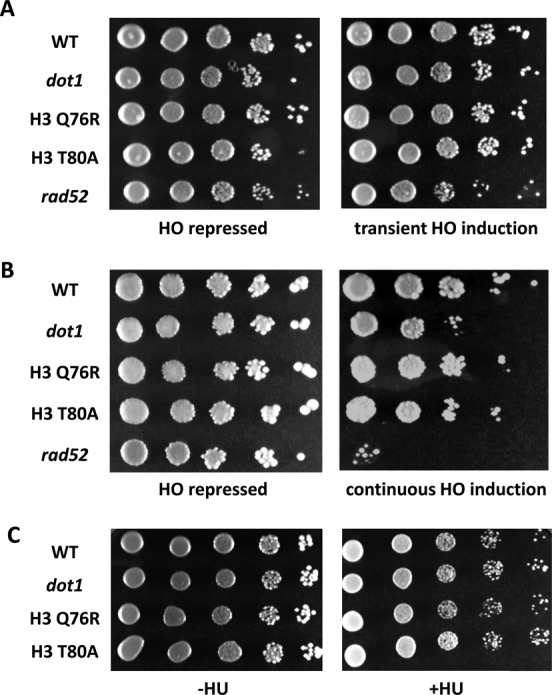
Histone post-translational modifications have been shown to contribute to DNA damage repair. Prior studies have suggested that specific H3K79 methylation states play distinct roles in the response to UV-induced DNA damage. To evaluate these observations, we examined the effect of altered H3K79 methylation patterns on UV-induced G1/S checkpoint response and sister chromatid exchange (SCE). We found that the di- and trimethylated states both contribute to activation of the G1/S checkpoint to varying degrees, depending on the synchronization method, although methylation is not required for checkpoint in response to high levels of UV damage. In contrast, UV-induced SCE is largely a product of the trimethylated state, which influences the usage of gene conversion versus popout mechanisms. Regulation of H3K79 methylation by H2BK123 ubiquitylation is important for both checkpoint function and SCE. H3K79 methylation is not required for the repair of double-stranded breaks caused by transient HO endonuclease expression, but does play a modest role in survival from continuous exposure. The overall results provide evidence for the participation of H3K79 methylation in UV-induced recombination repair and checkpoint activation, and further indicate that the di- and trimethylation states play distinct roles in these DNA damage response pathways.


Figures

Figure 1.
Figure 1.
Epistasis analysis between BRE1 and H3K79 methylation mutants. UV survival assays were done as described in the Materials and Methods section. Values are averages of at least three independent experiments; error bars represent one standard error. Strains used were (A) ABY34u0 (WT), ABY34D (dot1), ABY34br1 (bre1) and ABY34Dbr1 (dot1 bre1); (B) same as (A), except JTY307 (H3 T80A) and ABY307br1 (h3T80A bre1); (C) same as (A) except JTY106 (H3 Q76R) and ABY106br1 (H3 Q76R bre1).
Figure 2.
Figure 2.
UV-induced G1/S checkpoint analysis of H3K79 methylation mutants. Strains were arrested with α-factor (A and B) or growth to stationary phase (C and D), and exposed to UV (50 J/m2), and the frequency of small budded cells was measured over time, as described in the Materials and Methods section. Representative experiments are shown; quantitative compilation of data is displayed in Table 2. Strains utilized were (A and C) JTY34 (WT), JTY34D (dot1), JTY106 (H3 Q76R), JTY309 (H3 L70S) and AAY34r9 (rad9), and (B and D) ABY34u0 (WT) and ABY34br1 (bre1).
Figure 3.
Figure 3.
Western blot analysis of H3K79 methylation levels following UV exposure. Cultures were grown and arrested either with α-factor (A) or by growth into stationary phase (C), and exposed to UV, as in Figure 2. Strains used were the same as those in Figure 2, except also bar1 in (A), in order to utilize lower concentrations of α-factor. Samples were collected 30 (A) or 60 (C) minutes after UV exposure. (B and D) Densitometry of H3K79me1, H3K79me2 and H3K79me3 levels from α-factor and stationary phase arrested cultures, respectively. Values represent mean of at least four independent exposures, normalized to the unexposed wild-type levels for each methylation state; error bars represent one standard error. *, significantly different from corresponding WT value (p < 0.01); †, significant difference between UV exposed and unexposed (p < 0.01).
Figure 4.
Figure 4.
Correlation of H3K79 dimethylation and trimethylation levels relative to checkpoint delay time. Labels above and to the left of the graphs indicate the relevant conditions for each data set. K79 methylation levels from Figure 3 were normalized to WT levels for each methylation state on each graph. Checkpoint delay times from Table 2 were similarly normalized relative to WT levels, and are reported as percentages. Monomethylation levels were excluded to enable appropriate scaling of the relative methylation levels and checkpoint delays.
Figure 5.
Figure 5.
G1/S checkpoint analysis of H3K79 methylation mutants at 100 J/m2. Conditions and strains used are as described in Figure 2.
Figure 6.
Figure 6.
UV-induced sister chromatid exchange analysis of H3K79 methylation mutants. UV-induced SCE assays were performed as described in the Materials and Methods section. Values indicated are the number of cells of the indicated phenotype per 106 UV-surviving cells, reported as the mean of at least five independent experiments; error bars represent the standard error. Graphs on the left depict gene conversion frequencies, while those on the right represent popout frequencies. (A) Schematic depiction of the reporter construct used (32), and the potential recombination outcomes. The black vertical bars in the ade2-n and ade2-I boxes represent the relative position of the mutation in each respective allele. Interchromatid exchange outcomes are shown; intrachromatid exchanges are also possible, but not schematically shown. The bottom chromatid for each outcome (ADE+ TRP+ for gene conversion, ADE+ trp− for popout) represents the chromatid that is phenotypically detected in this assay. Strains used are as follows: (B) JTY34ATA (WT), JTY106ATA (H3 Q76R), JTY307ATA (H3 T80A), JTY34DATA (dot1); (C) same as (B) except JTY307DATA (H3T80A/dot1); (D) same as (B) except with JTY106DATA (H3 Q76R/dot1); (E) ABY34ATAu0 (WT), ABY34ATAbr1 (bre1), ABY34DATA (dot1) and ABY34DATAbr1 (bre1 dot1).
Figure 7.
Figure 7.
Western blot analysis of H4K79 methylation levels in log phase cultures. Cultures were grown in conditions comparable to those used for sister chromatid exchange assays in Figure 6, except that strains lacked the SCE reporter construct, to avoid mixed populations of ade− and ADE+ cells (which exhibit distinct growth kinetics). Suspended cultures were exposed to UV at 125 J/m2 (corresponding to ∼75 J/m2 for plate exposures, based on relative survival frequencies), and incubated for 1 h after exposure. Representative blots (A) and densitometry (B) are shown as described in Figure 3.
Figure 8.
Figure 8.
Spontaneous sister chromatid exchange analysis of H3K79 methylation mutants. (A) Spontaneous sister chromatid exchange rates were measured by the method of the median (34,35), using the SCE reporter strains listed in Figure 6, as described in the Materials and Methods section. Values reported are means of at least three independent experiments. Error bars represent the standard error. (B) Percentage of total SCE events (spontaneous for 0 J/m2, UV induced for other dosages) that were categorized as gene conversion events. Data are calculated from experiments reported in Figures 6 and 8A.
Figure 9.
Figure 9.
UV-induced sister chromatid exchange analysis of BRE1, RAD5 and RAD52 mutants. UV-induced SCE assays were done as described in the Materials and Methods section, and as depicted in Figure 6. Gene conversion events are shown on the left, and popout events on the right. Strains used are as follows: (A) JTY34ATA (WT), TSY34ATAr52 (rad52) and TSY34DATAr52 (rad52 dot1); (B) JTY34ATA (WT), DVY34ATAr5 (rad5), JTY34DATA (dot1) and DVY34DATAr52 (rad5 dot1).
Figure 10.
Figure 10.
HO endonuclease and hydroxyurea sensitivity analysis of H3 K79 methylation mutants. (A) Strains were transformed with a plasmid possessing a galactose-inducible gene encoding for endonuclease HO. Cultures were grown in liquid media containing either glucose (HO repressed) or galactose (transient HO induction) for 4 h, followed by 10-fold serial diluting and spot plating on selectable media with glucose. Plates were photographed after ∼4 days of growth. Images shown are representative of the replicated experiments executed. Strains used: JTY34 (WT), JTY34D (dot1), JTY106 (H3 Q76R), JTY307 (H3 T80A) and JTY34r52 (rad52). (B) HO transformed strains listed in (A) were grown in selectable media with glucose overnight, followed by serial diluting and plating on selectable media containing either glucose (HO repressed) or galactose (continuous HO induction). (C) Overnight cultures were serially diluted 10-fold and spot-plated on YEPD plates lacking (−HU) or containing (+HU) hydroxyurea at 200 mM.

Similar articles

Cited by

References

    1. Jackson S.P., Bartek J. The DNA-damage response in human biology and disease. Nature. 2009;461:1071–1078. - PMC - PubMed
    1. Kupiec M. Damage-induced recombination in the yeast Saccharomyces cerevisiae. Mutat. Res. 2000;451:91–105. - PubMed
    1. Thoma F. Repair of UV lesions in nucleosomes—intrinsic properties and remodeling. DNA Repair (Amst) 2005;4:855–869. - PubMed
    1. Friedberg E.C., Walker G.C., Siede W., Wood R.D., Schultz R.A., Ellenberger T. DNA Repair and Mutagenesis. 2nd edn. Washington, DC: ASM Press; 2006.
    1. Prakash S., Prakash L. Nucleotide excision repair in yeast. Mutat. Res. 2000;451:13–24. - PubMed

Publication types

MeSH terms