. 2014 Jun;42(10):6709-25.
doi: 10.1093/nar/gku266. Epub 2014 Apr 19.

Structural and biophysical characterization of Staphylococcus aureus SaMazF shows conservation of functional dynamics

Affiliations

Structural and biophysical characterization of Staphylococcus aureus SaMazF shows conservation of functional dynamics

Valentina Zorzini et al. Nucleic Acids Res. 2014 Jun.

Abstract

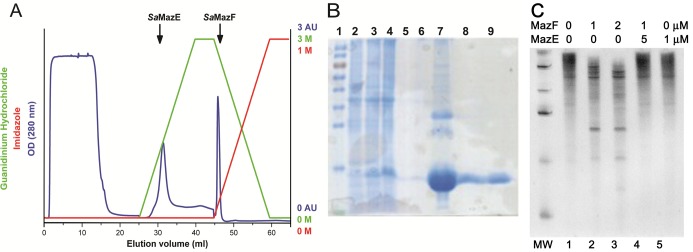
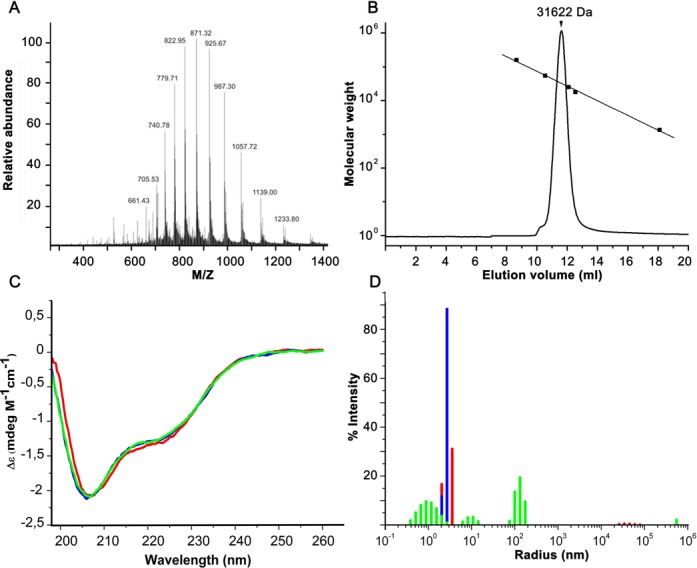
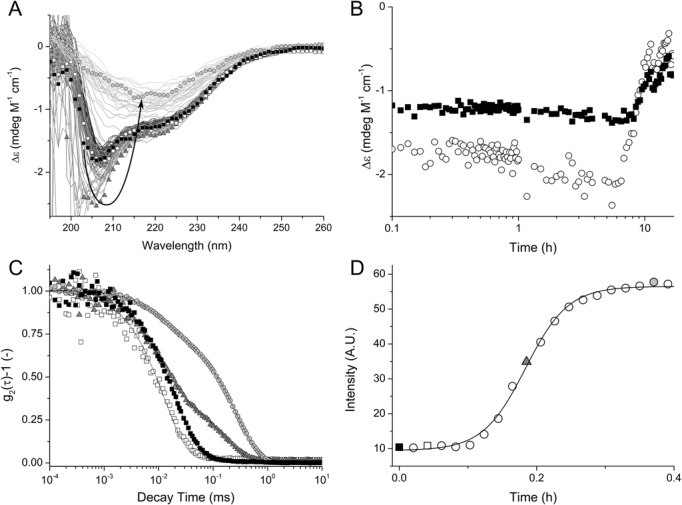
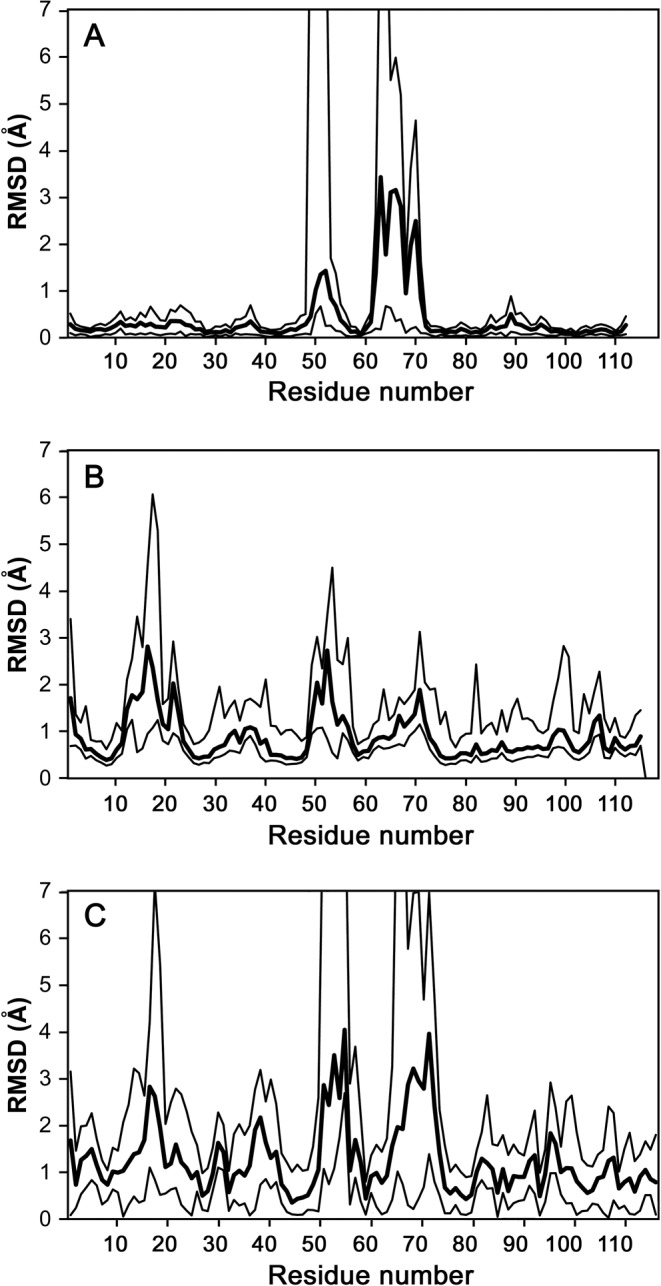
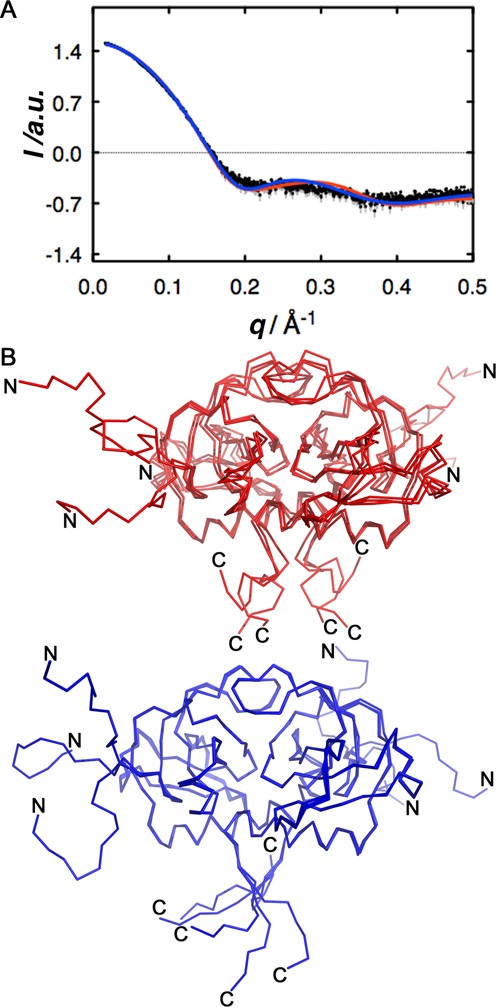
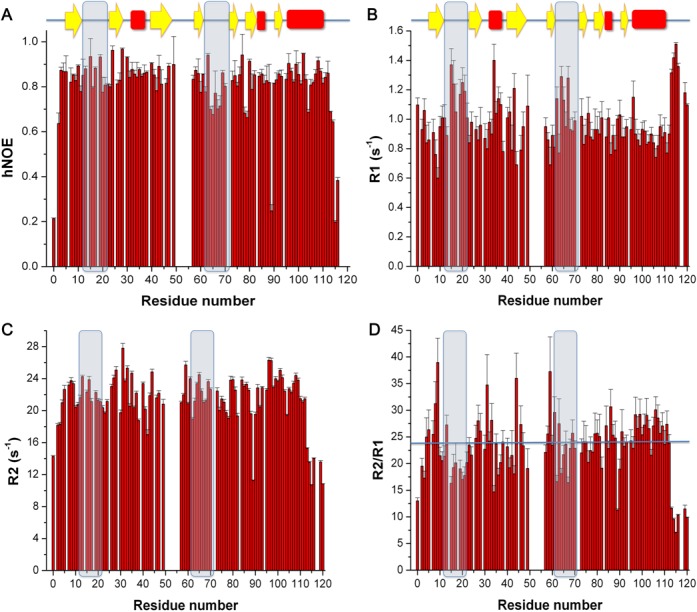
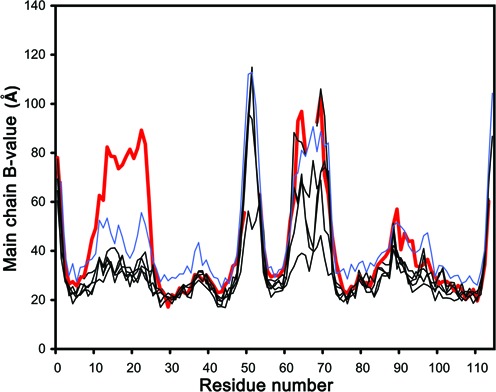
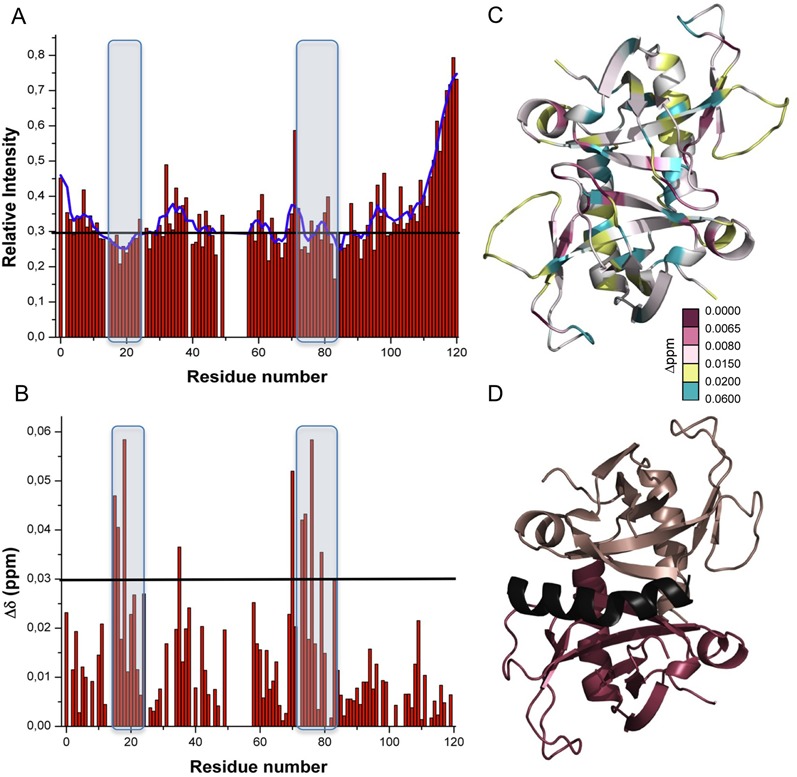
The Staphylococcus aureus genome contains three toxin-antitoxin modules, including one mazEF module, SamazEF. Using an on-column separation protocol we are able to obtain large amounts of wild-type SaMazF toxin. The protein is well-folded and highly resistant against thermal unfolding but aggregates at elevated temperatures. Crystallographic and nuclear magnetic resonance (NMR) solution studies show a well-defined dimer. Differences in structure and dynamics between the X-ray and NMR structural ensembles are found in three loop regions, two of which undergo motions that are of functional relevance. The same segments also show functionally relevant dynamics in the distantly related CcdB family despite divergence of function. NMR chemical shift mapping and analysis of residue conservation in the MazF family suggests a conserved mode for the inhibition of MazF by MazE.


Figures

Figure 1.
Figure 1.
Purification of SaMazF. (A) Ni-NTA purification of SaMazE and SaMazF. After loading, SaMazE is eluted using a gradient of guanidinium hydrochloride while SaMazF remains bound to the column. SaMazF is eluted using an immidazole gradient and subsequently dialyzed to remove the guanidinium. (B) SDS-PAGE showing the progress of expression and purification. Lane 1: molecular weight marker (Fermentas PageRuler). Lane 2: E. coli extract prior to induction. Lane 3: E. coli 2 h post induction. Lane 4: E. coli extract after overnight induction. Lane 5: SaMazE eluted from the Ni-NTA column. Lane 6: fractions in between the SaMazE and SaMazF peaks. Lane 7: SaMazF eluted from the Ni-NTA column. Lanes 8 and 9: SaMazF after further purification on SEC. (C) RNase activity of SaMazF. The figure shows the ribonuclease activity of SaMazF against bacteriophage MS2 genomic RNA. Lane 1: New England Biolabs Inc. low range ssRNA ladder (50, 80, 150, 300, 500 and 1000 bases). Lane 2: intact RNA control, excluding any nonspecific RNase contamination. Lanes 3 and 4: cleaved RNA by an active SaMazF at 1 μM and 2 μM, respectively. Lane 5: RNA degradation inhibition of SaMazF by the presence of SaMazE. Lane 6: SaMazE sample incubated with RNA.
Figure 2.
Figure 2.
Biophysical characterization. (A) Electrospray mass spectrum of SaMazF. The m/z values for the major peaks are indicated. (B) Analytical gel filtration. Shown is the elution profile of SaMazF on a superdex HR75 10/30 column together with the elution volumes of four molecular weight standards (bovine gamma-globulin, 158.0 kDa; ovalbumin, 44.0 kDa; myoglobin–F-plasmid CcdB, 25.4 kDa and 17.0 kDa; vitamin B12, 1.35 kDa) plotted versus their molecular weights. (C) CD spectra of SaMazF in 20 mM Na-phosphate pH 7.0 and at different concentrations of NaCl (0 mM green, 75 mM blue and 300 mM red). (D) DLS-derived intensity versus radius histogram of SaMazF under the same conditions as in panel (B). The same color scheme is used.
Figure 3.
Figure 3.
Thermal stability of SaMazF. (A) CD spectra of SaMazF at 293 K (white squares) and at different time intervals at 343 K (thin lines). Spectra corresponding to key structural states are indicated by symbols (t = 0 min, open circles; t = 270 min, gray triangles; t = 960 min, gray circles). The initial CD signals at 293 K and 343 K are essentially identical. After a lag phase, the minimum at 207 nm deepens, followed by a slow transition to a mainly β-structure containing state. (B) CD signal at 207 nm (white circles) and 220 nm (black squares) at 343 K followed in function of time. The duration of the lag phase is strongly dependent on temperature and protein concentration, indicating a nucleation event. (C) Normalized intensity correlation functions of a 0.2 μm filtered buffered SaMazF solution (20 mM Tris-HCl pH 7.0, 75 mM NaCl) after 0 min of incubation at 343 K (black squares), 2.5 min (open squares), 11 min (gray triangles) and 22 min (gray circles), respectively. Full lines represent fits with Equation (1). At t = 0, the correlation function is well characterized by a single exponential decay with a characteristic time of 2.5 ± 0.1 × 10⁻² ms, indicative of the monodisperse nature of the sample. After 7 min of incubation at 343 K, a second decay appears in the correlation function, which is correlated with an intensity increase of the scattered light. This corresponds to the formation of a second, ‘slower’ species in solution, considerably larger than a native MazF dimer. Both the relative amplitude and the decay time of the second population increase as a function of incubation time, corresponding to an increase in characteristic size and number density, e.g. 36 ± 5 nm for t = 11 min and 49 ± 5 nm for t = 22 min. Conversely, the characteristic size of the ‘faster’ species (presumed native SaMazF dimer) is constant as a function of time suggesting that the overall fold is unperturbed, i.e. 2.7 ± 0.2 nm, 2.8 ± 0.3 nm, 2.6 ± 0.3 nm and 2.7 ± 0.2 nm for t = 0, 2.5, 11 and 22 min, respectively. (D) Scattered intensity at 343 K as a function of time: full line represents a Boltzmann sigmoidal curve fit. The data points indicated as grey triangle or black and open square correspond to the equivalent curves in panel C.
Figure 4.
Figure 4.
Overall structure of SaMazF. (A) Amino acid sequence of SaMazF. Secondary structure elements derived from the X-ray structures of SaMazF are indicated by yellow arrows (β-strands) and red bars (α-helices) and are labeled. (B) Overall structure of the SaMazF dimer. Shown is a cartoon figure of the dimer formed by chains A and B of crystal form I. Chain A is colored according to secondary structure as in (A). Loop regions Leu12-Gly22, Gly48-Lys54 and Lys64-Lys70 are colored green and labeled as S1-S2, S3-S4 and S4-S5, respectively. Chain B is shown in gray. N- and C-termini are indicated. Dotted lines show the connection between the extremities of loops that lack electron density. Panel (B) was prepared using PyMol (84).
Figure 5.
Figure 5.
Structural variability of SaMazF. (A) Per residue RMSDs within the X-ray ensemble. The mean RMSDs for all pair-wise comparisons of SaMazF monomers within the X-ray ensemble (seven independent monomers—form III is represented by a single monomer only because of the imposed NCS restraints) are shown as a bold line. The minimum and maximum values for each residue are represented by the thin lines. When no coordinates were available (due to lack of electron density), an arbitrary RMSD of 10 Å was used. The largest variability is seen for amino acids Lys64-Lys70 and to a lesser extent for Gly48-Lys54. (B) Per residue RMSDs within the NMR ensemble. Similar plot as in (A), but now using the 20 lowest energy NMR structures that were deposited in the Protein Data Bank. The largest variability is seen for amino acids Leu12-Ser18, Gly48-Lys54 and Lys64-Lys70. (C) Comparison of the X-ray and NMR ensemble. Plotted are the mean RMSDs for all pair-wise comparisons of SaMazF monomers in the X-ray ensemble with those in the NMR ensemble.
Figure 6.
Figure 6.
Crystal packing. (A) Stick representation of the backbone conformations of loop Gly48-Lys54 in the X-ray ensemble (above) and in the NMR ensemble (below) and colored according to atom type (carbon, orange; nitrogen, blue; oxygen, red). Within the X-ray ensemble, this loop is involved in crystal packing in each chain. (B) Stick representation of the backbone conformations of loop Ile61-Lys70. The ‘canonical’ conformation observed in the crystal structures in 10 out of 14 chains is shown in the upper left of the panel. Colored as in (A) except for the two chains that are not in packing contacts where carbons are drawn in green. The equivalent NMR ensemble is shown in the upper right of the panel while the three packing-driven conformations are shown at the bottom of the panel. (C) Stick representation of the backbone conformations of loop Leu12-Ser18 in the X-ray ensemble (above) and in the NMR ensemble (below). Coloring as in (A). This figure was prepared using PyMol (84).
Figure 7.
Figure 7.
Small-angle X-ray scatter. (A) Experimental scatter data. The experimental data are shown in black while the error margins are shown in gray. Analysis of the scattering curve indicates that SaMazF forms a globular dimer with a radius of gyration of 23.1 Å as determined through Guinier and p(r) analysis, and a molecular weight of about 28 kDa as determined through Guinier analysis. The theoretical scattering curves calculated from the full NMR (red) and X-ray (blue) ensembles are overlaid and predict the experimental data equally well. (B) Minimal set of NMR (red) and X-ray (blue) structures necessary to predict the experimental data. In each case, selecting three models from the full ensemble is sufficient, with the major source of variability that needs to be taken into account coming from the disordered C-terminus and the N-terminal His-tag (indicated by N and C). Panel (B) was prepared using PyMol (84).
Figure 8.
Figure 8.
Backbone dynamics of SaMazF. Backbone dynamics of SaMazF were measured at 600 MHz and 308 K. (A) 1H–15N steady-state heteronuclear NOEs in function of residue number. (B) 15N R1 in function of residue number. (C) 15N R2 in function of residue number. (D) R2 over R1 ratios in function of residue number. The solid line in panel (D) corresponds to the average R2/R1 ratio used for obtaining the rotation correlation time τc. The loops Leu12-Gly22 and Ile61-Lys70 are highlighted in all panels.
Figure 9.
Figure 9.
B-factor-derived dynamics. The average backbone B-factors are plotted in function of residue number for all six crystallographic independent monomers from crystal forms I and II and for monomer A of crystal form III. The B-factors in the latter crystal were restrained using non-crystallographic symmetry due to the lower resolution of the data and the profiles for monomers B–H are essentially identical to that of A and therefore not shown. They are in general slightly higher than those for the six monomers from crystal forms I and II over the whole residue range and therefore highlighted in blue. The thick red curve corresponds to monomer B from crystal form I and shows elevated values for residues belonging to loop S1-S2.
Figure 10.
Figure 10.
MazE binding. (A) Relative change of 1H–15N HSQC cross-peak intensities in function of residue number upon titration of SaMazF with SaMazE23–56 till a 1:1 ratio. The blue curve corresponds to average intensity changes using a sliding window of five residues. Loop S1-S2 and strands S5 and S6 are highlighted. (B) Combined 1H and 15N chemical shift differences between free and bound SaMazF in a 1:1 ratio with SaMazE23–56. Loop S1-S2 and strands S5 and S6 are highlighted. (C) Combined 1H–15N chemical shift differences plotted on a ribbon diagram of the SaMazF dimer. Residues are color-coded according to the change in chemical shift of their 1H–15N HSQC cross-peaks with red corresponding to the largest effects. The orientation is identical to the left panel in Figure 4B. (D) Equivalent view of the B. subtilis YdcE–YdcD (PDB entry 4ME7) complex. The two YdcE monomers are shown in salmon and red. Residues Met64-Glu83 of the bound antitoxin YdcD are colored black. The N-terminal domain of YdcD is omitted for clarity. Figure created in PyMol (84).

Similar articles

Cited by

References

    1. Buts L., Lah J., Dao-Thi M., Wyns L., Loris R. Toxin-antitoxin modules as bacterial metabolic stress managers. Trends Biochem. Sci. 2005;30:672–679. - PubMed
    1. Gerdes K., Christensen S.K., Lobner-Olesen A. Prokaryotic toxin-antitoxin stress response loci. Nat. Rev. Microbiol. 2005;3:371–382. - PubMed
    1. Yamaguchi Y., Park J.H., Inouye M. Toxin-antitoxin systems in bacteria and archaea. Annu. Rev. Genet. 2011;45:61–79. - PubMed
    1. Hayes F., Van Melderen L. Toxins-antitoxins: diversity, evolution and function. Crit. Rev. Biochem. Mol. Biol. 2011;46:386–408. - PubMed
    1. Wang X., Wood T.K. Toxin-antitoxin systems influence biofilm and persister cell formation and the general stress response. Appl. Environ. Microbiol. 2011;77:5577–5583. - PMC - PubMed

Publication types

MeSH terms

LinkOut - more resources