

A nanotechnological, molecular-modeling, and immunological approach to study the interaction of the anti-tumorigenic peptide p28 with the p53 family of proteins
- PMID: 24748790
- PMCID: PMC3986302
- DOI: 10.2147/IJN.S58465
A nanotechnological, molecular-modeling, and immunological approach to study the interaction of the anti-tumorigenic peptide p28 with the p53 family of proteins
Abstract
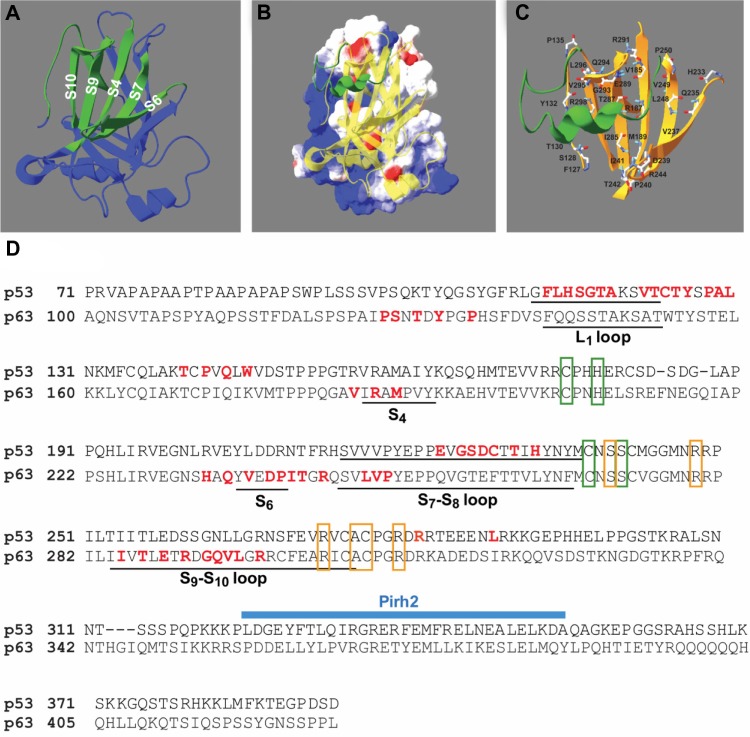
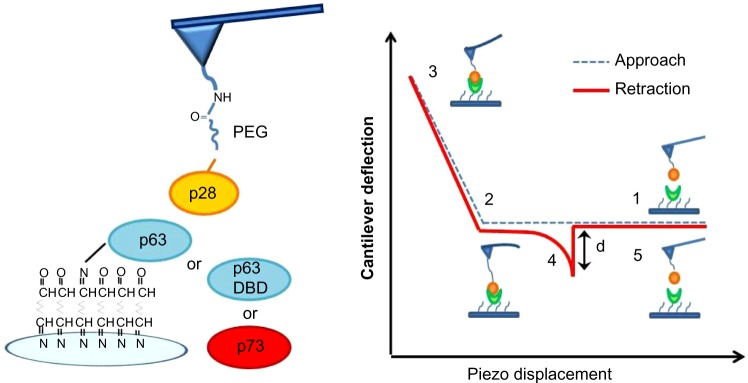
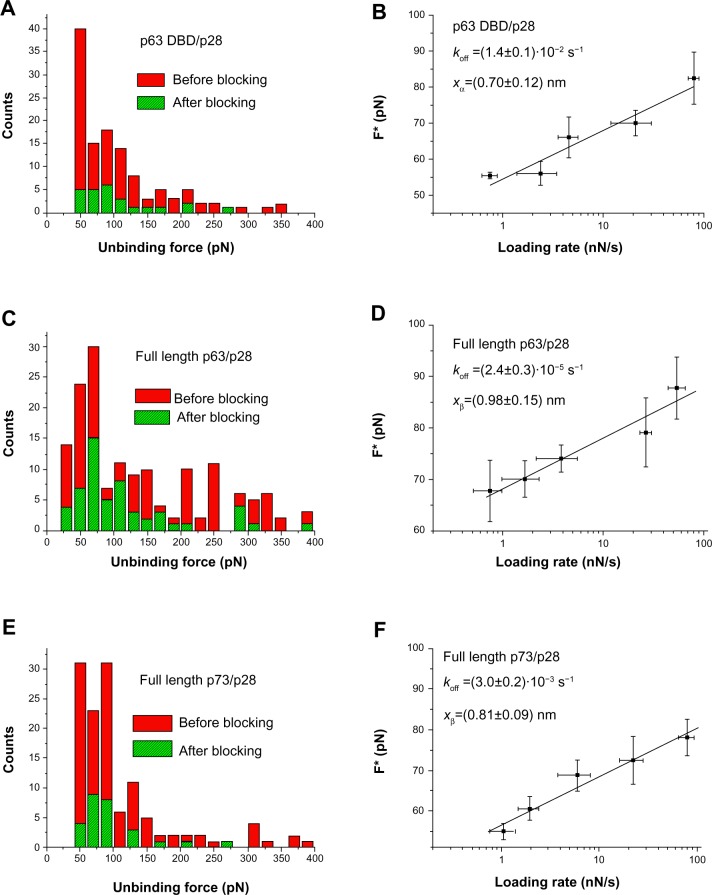
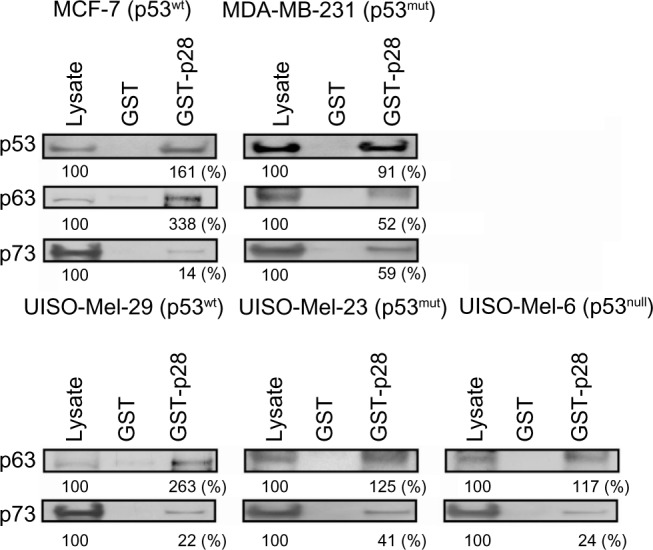
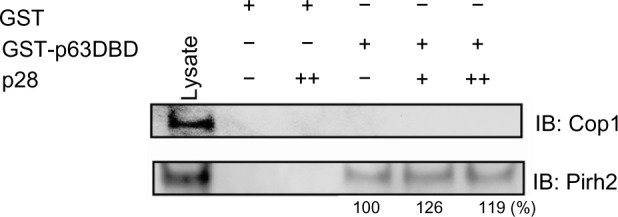
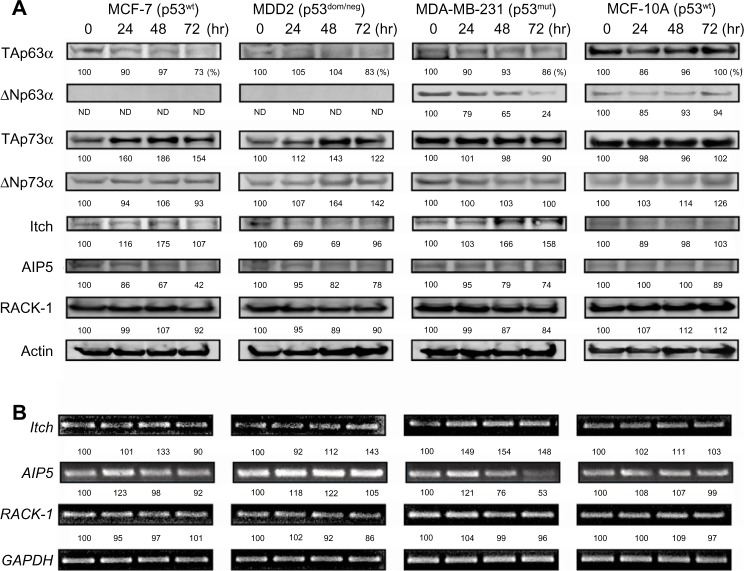
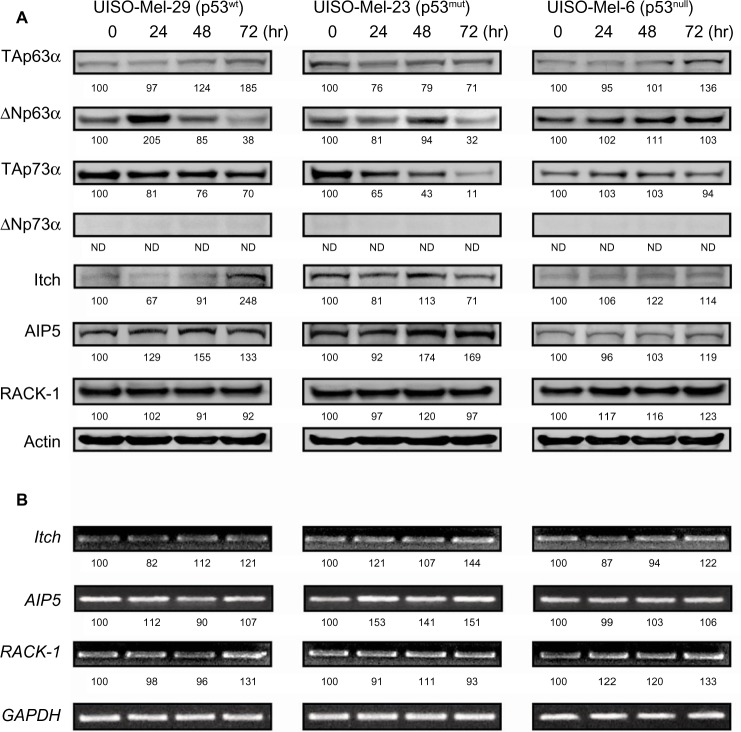
p28 is an anionic, amphipathic, cell-penetrating peptide derived from the cupredoxin azurin that binds to the DNA-binding domain (DBD) of the tumor suppressor protein, p53, and induces a post-translational increase in the level of wild type and mutated p53 in a wide variety of human cancer cells. As p63 and p73, additional members of the p53 superfamily of proteins, also appear to be involved in the cellular response to cancer therapy and are reportedly required for p53-induced apoptosis, we asked whether p28 also binds to p63 and p73. Atomic force spectroscopy demonstrates that p28 forms a stable, high-affinity complex with full-length p63, the DBD of p63, and full-length p73. Exposure to p28 decreased the level of TAp63α and ΔNp63α, the truncated form of p63, in p53 wild type and mutated human breast cancer cells, respectively. p28 increased the level of TAp73α, but not ΔNp73α, in the same breast cancer cell lines. In contrast, p28 increased the level of the TA and ΔN isoforms of p63 in p53 wild type, but not in p53 mutated melanoma cells, while decreasing TA p73α in p53 wild type and mutated human melanoma cells. All changes were mirrored by an associated change in the expression of the HECT E3 ligases Itch/AIP4, AIP5, and the RING E3 ligase Pirh2, but not in the receptor for activated C kinase or the RING E3 ligases Mdm2 and Cop1. Collectively, the data suggest that molecules such as p28 bind with high affinity to the DBD of p63 and p73 and alter their expression independent of the Mdm2 and Cop1 pathways.
Keywords: anticancer peptide; molecular interaction; p53 superfamily of proteins.
Figures
Similar articles
-
p28, a first in class peptide inhibitor of cop1 binding to p53.Br J Cancer. 2013 Jun 25;108(12):2495-504. doi: 10.1038/bjc.2013.266. Epub 2013 Jun 4. Br J Cancer. 2013. PMID: 23736031 Free PMC article.
-
Interaction of an anticancer peptide fragment of azurin with p53 and its isolated domains studied by atomic force spectroscopy.Int J Nanomedicine. 2011;6:3011-9. doi: 10.2147/IJN.S26155. Epub 2011 Nov 24. Int J Nanomedicine. 2011. PMID: 22162658 Free PMC article.
-
Modelling the interaction between the p53 DNA-binding domain and the p28 peptide fragment of Azurin.J Mol Recognit. 2011 Nov-Dec;24(6):1043-55. doi: 10.1002/jmr.1153. J Mol Recognit. 2011. PMID: 22038811
-
P53 family: at the crossroads in cancer therapy.Curr Med Chem. 2009;16(32):4328-44. doi: 10.2174/092986709789578196. Curr Med Chem. 2009. PMID: 19754415 Review.
-
Surface Plasmon Resonance Sensing of Biorecognition Interactions within the Tumor Suppressor p53 Network.Sensors (Basel). 2017 Nov 20;17(11):2680. doi: 10.3390/s17112680. Sensors (Basel). 2017. PMID: 29156626 Free PMC article. Review.
Cited by
-
Dual Role of p73 in Cancer Microenvironment and DNA Damage Response.Cells. 2021 Dec 13;10(12):3516. doi: 10.3390/cells10123516. Cells. 2021. PMID: 34944027 Free PMC article. Review.
-
Cell-Penetrating Peptides (CPPs) as Therapeutic and Diagnostic Agents for Cancer.Cancers (Basel). 2022 Nov 11;14(22):5546. doi: 10.3390/cancers14225546. Cancers (Basel). 2022. PMID: 36428639 Free PMC article. Review.
-
Toward Cancer Diagnostics of the Tumor Suppressor p53 by Surface Enhanced Raman Spectroscopy.Sensors (Basel). 2020 Dec 14;20(24):7153. doi: 10.3390/s20247153. Sensors (Basel). 2020. PMID: 33327383 Free PMC article. Review.
-
High Expression of Pirh2 is Associated with Poor Prognosis in Glioma.Cell Mol Neurobiol. 2017 Nov;37(8):1501-1509. doi: 10.1007/s10571-017-0481-5. Epub 2017 Mar 3. Cell Mol Neurobiol. 2017. PMID: 28258514 Free PMC article.
-
p28 Bacterial Peptide, as an Anticancer Agent.Front Oncol. 2020 Aug 6;10:1303. doi: 10.3389/fonc.2020.01303. eCollection 2020. Front Oncol. 2020. PMID: 32850408 Free PMC article. Review.
References
-
- Taylor BN, Mehta RR, Christov K, et al. A novel antitumor peptide: The protein transduction domain (PTD) of azurin. Proceedings of the 97th Annual Meeting of the American Association for Cancer Research; April 1–5, 2006; Washington, DC. pp. 47–47.–LB-187.
-
- Taylor BN, Mehta RR, Yamada T, et al. Noncationic peptides obtained from azurin preferentially enter cancer cells. Cancer Res. 2009;69:537–546. - PubMed
-
- Yamada T, Fialho AM, Punj V, Bratescu L, Gupta TK, Chakrabarty AM. Internalization of bacterial redox protein azurin in mammalian cells: entry domain and specificity. Cell Microbiol. 2005;7:1418–1431. - PubMed
-
- Yamada T, Mehta RR, Lekmine F, et al. A peptide fragment of azurin induces a p53-mediated cell cycle arrest in human breast cancer cells. Mol Cancer Ther. 2009;8:2947–2958. - PubMed
Publication types
MeSH terms
Substances
LinkOut - more resources
Full Text Sources
Other Literature Sources
Research Materials
Miscellaneous
