

Sex differences in the prediction of the effectiveness of paroxetine for patients with major depressive disorder identified using a receiver operating characteristic curve analysis for early response
- PMID: 24748795
- PMCID: PMC3986275
- DOI: 10.2147/NDT.S57189
Sex differences in the prediction of the effectiveness of paroxetine for patients with major depressive disorder identified using a receiver operating characteristic curve analysis for early response
Erratum in
- Neuropsychiatr Dis Treat. 2014;10:997. Norio, Yasui-Furukori [corrected to Yasui-Furukori, Norio]
Abstract
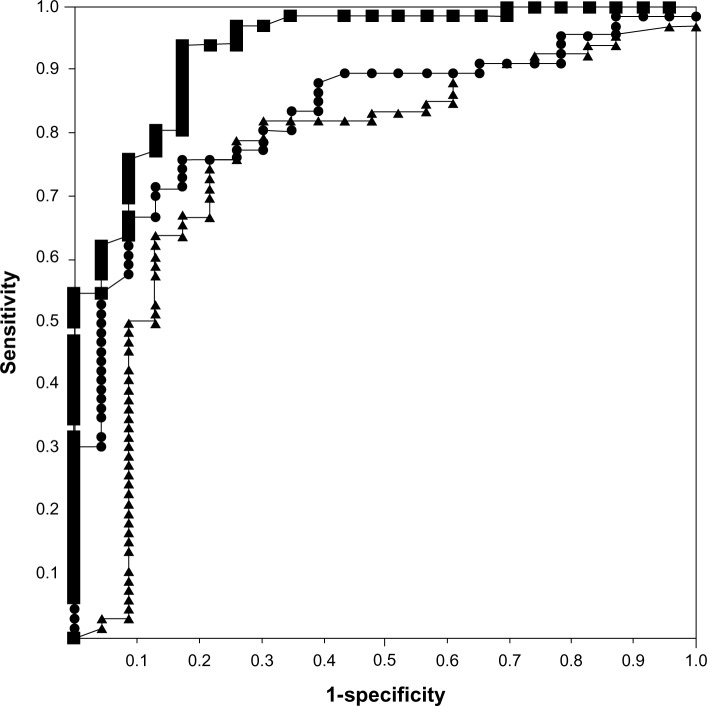
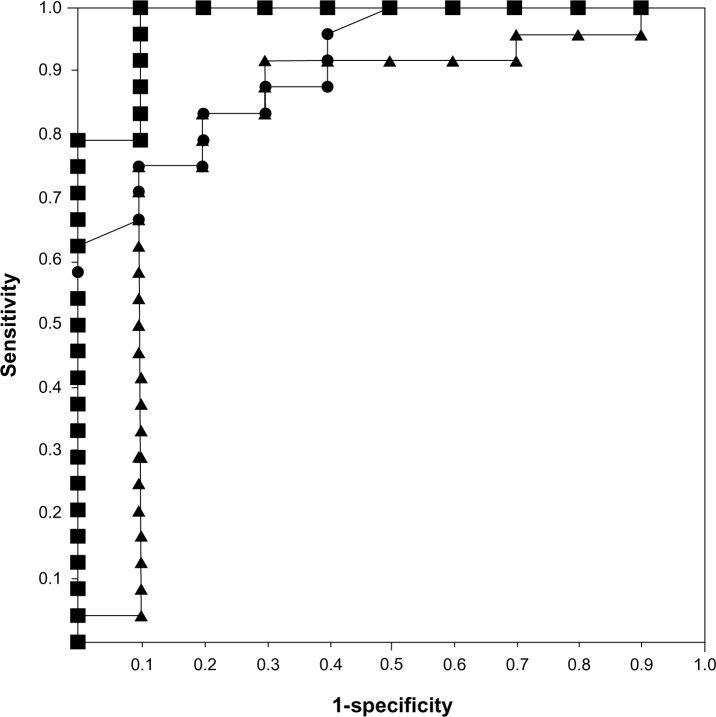
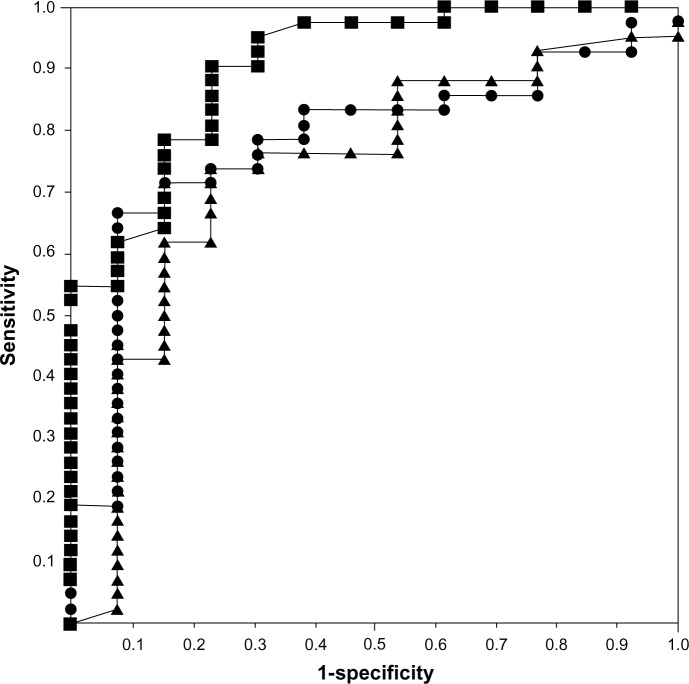
Background: We investigated cutoff values for the early response of patients with major depressive disorder to paroxetine and their sex differences by using a receiver operating characteristic (ROC) curve analysis to predict the effectiveness of paroxetine.
Methods: In total, 120 patients with major depressive disorder were enrolled and treated with 10-40 mg/day paroxetine for 6 weeks; 89 patients completed the protocol. A clinical evaluation using the Montgomery-Asberg Depression Rating Scale (MADRS) was performed at weeks 0, 1, 2, 4, and 6.
Results: In male subjects, the cutoff values for MADRS improvement rating in week 1, week 2, and week 4 were 20.9%, 34.9%, and 33.3%, respectively. The sensitivities and the specificities were 83.3% and 80.0%, 83.3% and 80.0%, and 100% and 90%, respectively. The areas under the curve (AUC) were 0.908, 0.821, and 0.979, respectively. In female subjects, the cutoff values for the MADRS improvement rating in week 1, week 2, and week 4 were 21.4%, 35.7%, and 32.3%, respectively. The sensitivities and the specificities were 71.4% and 84.6%, 73.8% and 76.9%, and 90.5% and 76.9%, respectively. The AUCs were 0.781, 0.735, and 0.904, respectively.
Conclusion: Early improvement with paroxetine may predict the long-term response. The accuracy of the prediction for the response is higher in male subjects.
Keywords: antidepressants; early response; paroxetine; receiver operating characteristic curve analysis; sex differences.
Figures
Similar articles
-
Effects of age on paroxetine efficacy in patients with major depressive disorder who do not exhibit an early response to treatment.Clin Neuropharmacol. 2015 Jan-Feb;38(1):6-10. doi: 10.1097/WNF.0000000000000058. Clin Neuropharmacol. 2015. PMID: 25580920
-
Items of the Montgomery-Åsberg Depression Rating Scale Associated With Response to Paroxetine Treatment in Patients With Major Depressive Disorder.Clin Neuropharmacol. 2016 May-Jun;39(3):135-9. doi: 10.1097/WNF.0000000000000146. Clin Neuropharmacol. 2016. PMID: 27171569
-
An attempt to construct a 7-item short version of the temperament and character inventory to predict the treatment response of patients with depression; a validation study.BMC Psychiatry. 2016 Aug 12;16:290. doi: 10.1186/s12888-016-0997-0. BMC Psychiatry. 2016. PMID: 27520460 Free PMC article.
-
Duloxetine in the acute and long-term treatment of major depressive disorder: a placebo- and paroxetine-controlled trial.Eur Neuropsychopharmacol. 2004 Dec;14(6):457-70. doi: 10.1016/j.euroneuro.2004.01.002. Eur Neuropsychopharmacol. 2004. PMID: 15589385 Clinical Trial.
-
A comparative study of the efficacy of long-term treatment with escitalopram and paroxetine in severely depressed patients.Curr Med Res Opin. 2006 Jul;22(7):1331-41. doi: 10.1185/030079906X115513. Curr Med Res Opin. 2006. PMID: 16834832 Clinical Trial.
Cited by
-
Does early improvement in depressive symptoms predict subsequent remission in patients with depression who are treated with duloxetine?Neuropsychiatr Dis Treat. 2016 May 23;12:1269-73. doi: 10.2147/NDT.S103432. eCollection 2016. Neuropsychiatr Dis Treat. 2016. PMID: 27307739 Free PMC article.
-
The association between the subjective memory complaints scale and depressive state and cognitive impairment: a factor analysis.Neuropsychiatr Dis Treat. 2015 Nov 23;11:2935-41. doi: 10.2147/NDT.S93539. eCollection 2015. Neuropsychiatr Dis Treat. 2015. PMID: 26648725 Free PMC article.
-
Prediction of treatment outcomes in psychiatry--where do we stand ?Dialogues Clin Neurosci. 2014 Dec;16(4):455-64. doi: 10.31887/DCNS.2014.16.4/fmcmahon. Dialogues Clin Neurosci. 2014. PMID: 25733951 Free PMC article. Review.
References
-
- Antonijevic IA. Depressive disorders – is it time to endorse different pathophysiologies? Psychoneuroendocrinology. 2006;31(1):1–15. - PubMed
-
- van Praag HM. Kraepelin, biological psychiatry, and beyond. Eur Arch Psychiatry Clin Neurosci. 2008;258(Suppl 2):29–32. - PubMed
-
- Lamers F, de Jonge P, Nolen WA, et al. Identifying depressive subtypes in a large cohort study: results from the Netherlands Study of Depression and Anxiety (NESDA) J Clin Psychiatry. 2010;71(12):1582–1589. - PubMed
-
- Abela JR, Skitch SA, Auerbach RP, Adams P. The impact of parental borderline personality disorder on vulnerability to depression in children of affectively ill parents. J Pers Disord. 2005;19(1):68–83. - PubMed
-
- Arias B, Gutiérrez B, Pintor L, Gastó C, Fañanás L. Variability in the 5-HT(2A) receptor gene is associated with seasonal pattern in major depression. Mol Psychiatry. 2001;6(2):239–242. - PubMed
LinkOut - more resources
Full Text Sources
Other Literature Sources
