. 2014 Mar 20;2(4):507-19.
doi: 10.1016/j.stemcr.2014.01.018. eCollection 2014 Apr 8.

Progenitor cell dynamics in the Newt Telencephalon during homeostasis and neuronal regeneration

Affiliations

Progenitor cell dynamics in the Newt Telencephalon during homeostasis and neuronal regeneration

Matthew Kirkham et al. Stem Cell Reports. .

Abstract

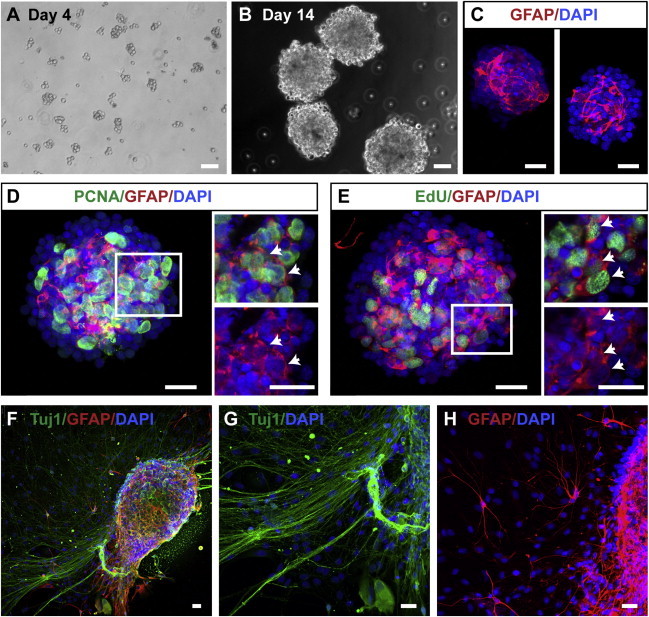
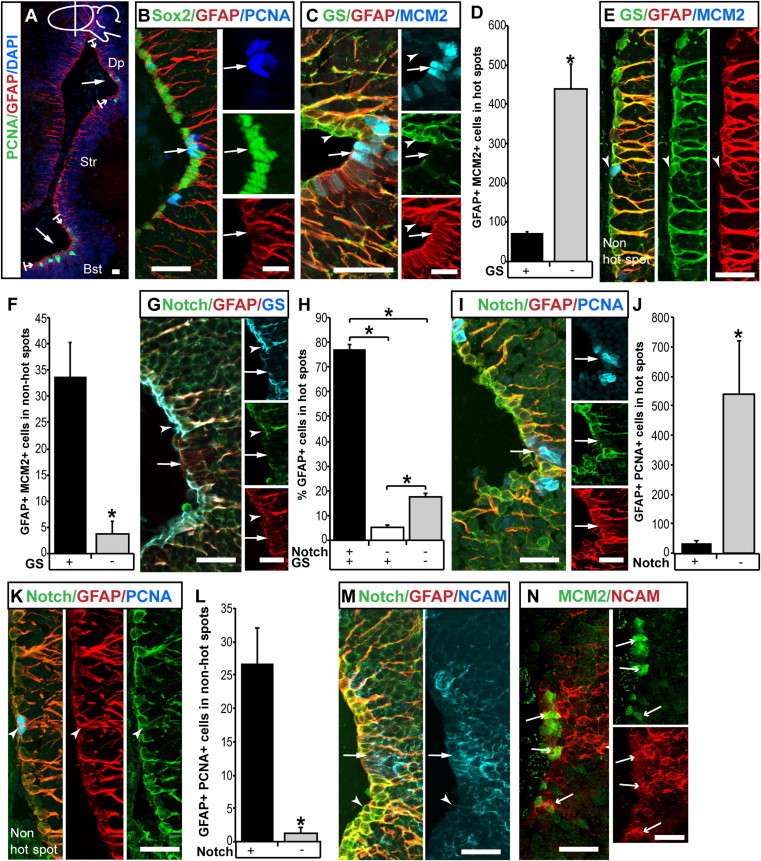
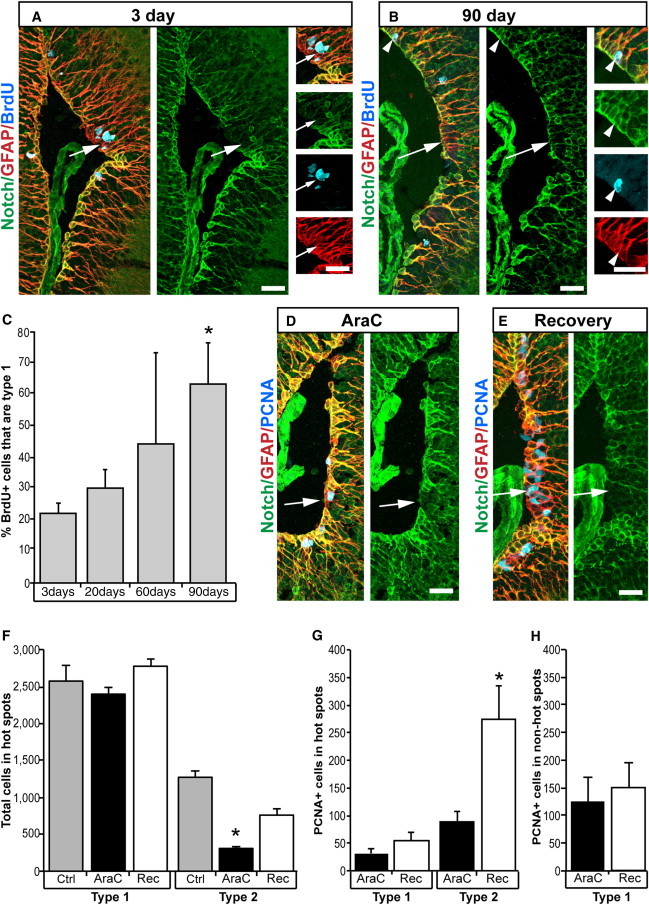
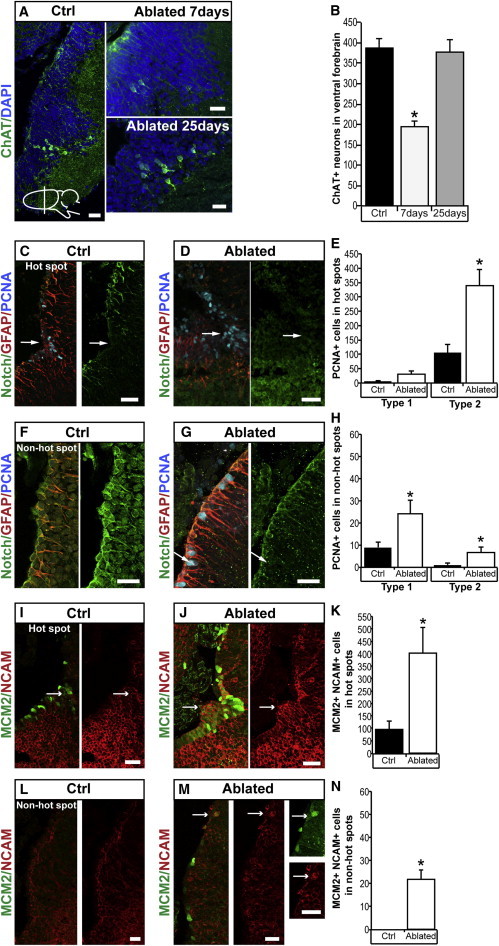
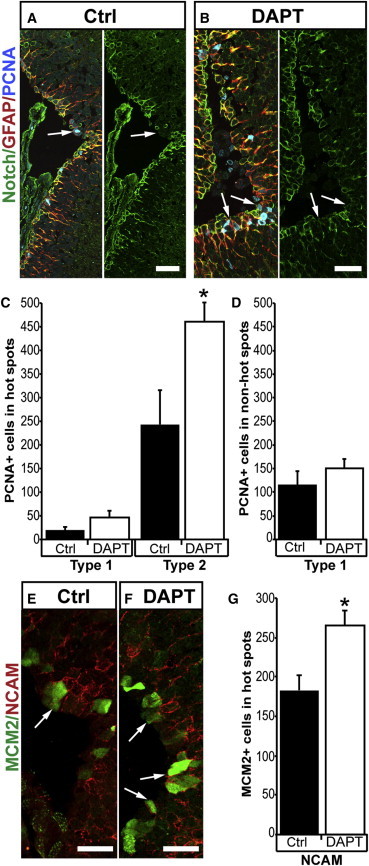
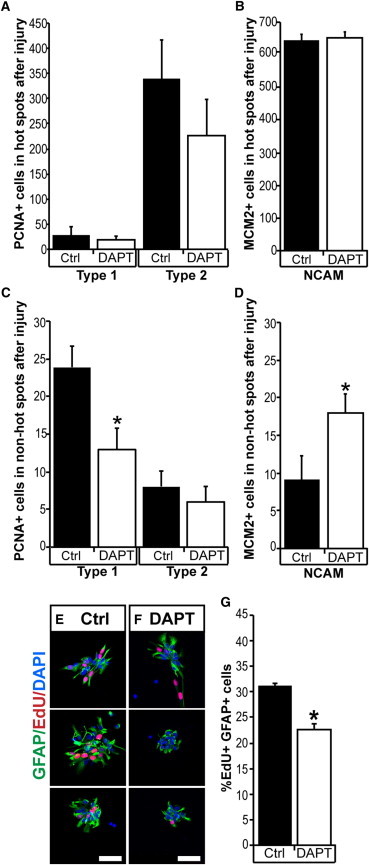
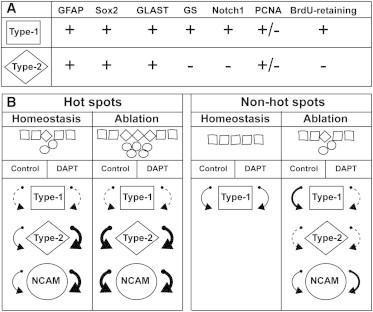
The adult newt brain has a marked neurogenic potential and is highly regenerative. Ventricular, radial glia-like ependymoglia cells give rise to neurons both during normal homeostasis and after injury, but subpopulations among ependymoglia cells have not been defined. We show here that a substantial portion of GFAP(+) ependymoglia cells in the proliferative hot spots of the telencephalon has transit-amplifying characteristics. In contrast, proliferating ependymoglia cells, which are scattered along the ventricular wall, have stem cell features in terms of label retention and insensitivity to AraC treatment. Ablation of neurons remodels the proliferation dynamics and leads to de novo formation of regions displaying features of neurogenic niches, such as the appearance of cells with transit-amplifying features and proliferating neuroblasts. The results have implication both for our understanding of the evolutionary diversification of radial glia cells as well as the processes regulating neurogenesis and regeneration in the adult vertebrate brain.


Figures

Figure 1
Figure 1
Neurosphere-Forming Cells in the Newt Brain (A and B) Isolated cells from newt brain cultured in DMEM/F12, FGF-2, and EGF formed small spheres after 4 days (A). These spheres increased in size over time (B). (C) GFAP+ cells are found in the center of the 14-day-old neurospheres. (D and E) Neurospheres cultured for 14 days in DMEM/F12, FGF-2, and EGF contain proliferating GFAP+ cells as indicated by PCNA labeling (D, arrows) and incorporate EdU (E, arrows). (F–H) Neurospheres plated in poly-D-lysine plates and cultured in differentiation medium for 14 days produce Tuj1+ cells with long extensions (F and G). GFAP+ cells were also observed away from the neurosphere (F and H). The scale bars represent 50 μm.
Figure 2
Figure 2
Immunohistochemical Characterization of Ventricular Ependymoglia Cells (A) All ependymoglia cells are GFAP+; proliferation hot spots such as the dorsal pallium (Dp) and the bed nucleus of the stria terminalis (Bst) are marked as well as the striatum (Str). The drawing of the newt brain indicates the plane of section. Lines with arrows demarcate the borders of the hot spots. Arrows highlight even expression of GFAP in the hot spots. (B) Sox2 and GFAP are expressed in all ependymoglia cells. Arrow highlights even expression of Sox2 in proliferating PCNA+ cells. (C) GS/GFAP/MCM2 staining reveals type-1 and type-2 cells. Arrow points to MCM2+/GFAP+/GS (type-2) ependymoglia cells in hot spots. Arrowhead points to the surrounding nonproliferating GFAP+/GS+ (type-1) ependymoglia cells. (D) Quantification of ependymoglia cells in hot spots coexpressing GFAP, GS, and MCM2. Note that most MCM2+ ependymoglia cells are type-2 cells (GFAP+/GS). n = 5; p < 0.05. (E) GS/GFAP/MCM2 expression in non-hot spot. Arrowhead points to proliferating type-1 cell (GFAP+/GS+). (F) Quantification of ependymoglia cells in non-hot spots coexpressing GFAP, GS, and MCM2. Note that most MCM2+ ependymoglia cells are type-1 cells (GFAP+/GS+). n = 5; p < 0.05. (G) Notch1, type-2 ependymoglia cells (arrow) surrounded by Notch1+, type-1 ependymoglia cells (arrowhead). Note the colocalization of GS and Notch1 immunoreactivity. (H) Quantification of GFAP-, Notch1-, and GS-expressing ependymoglia cells shows that, in hot spots, the vast majority of GFAP+ cells were type-1 (Notch1+/GS+). n = 4; p < 0.05. (I) The majority of PCNA+ cells in hot spots are type-2 ependymoglia cells (GFAP+/Notch1; arrow). (J) Quantification of ependymoglia cells in hot spot regions coexpressing GFAP, Notch1, and PCNA. Note that almost all PCNA+ ependymoglia cells are type-2 cells (GFAP+/Notch1). n = 5; p < 0.05. (K and L) Few PCNA+ type-1 (GFAP+/Notch1+) ependymoglia cells were observed outside of hot spots. Quantified in (L). n = 5; p < 0.05. (M) PSA-NCAM (NCAM) and type-2 (GFAP+/Notch1) ependymoglia cells in hot spots (arrow). The surrounding region contains type-1 (GFAP+/Notch1+) ependymoglia cells and is devoid of PSA-NCAM expression (arrowhead). (N) MCM2-expressing PSA-NCAM+ cells in hot spots (arrow). Data represented as mean ± SEM. The scale bars represent 50 μm.
Figure 3
Figure 3
Type-1 Cells Are Resistant to AraC and Retain BrdU Labeling after Extended Chase (A–C) A pulse of BrdU was chased for 3 days (A). BrdU-labeled type-2 ependymoglia cells in hot spots (arrow). BrdU-labeled type-1 ependymoglia cells after a 90-day chase (arrowhead; B). Type-2 ependymoglia cells were identified by lack of Notch1 expression (arrow). Percentage of GFAP+/BrdU+ cells that were type-1 ependymoglia cells (C). p < 0.05 between 3 days chase and 90 days chase. n = 4. (D–H) AraC treatment (D) reduces the number of type-2 ependymoglia cells (arrow) but had no effect on type-1 ependymoglia cells in hot spots. After 14 days of recovery (E), the number of type-2 ependymoglia cells increased (F). p < 0.05 between control and AraC treatment. n = 5. Recovery for 14 days after AraC treatment also caused an increase in PCNA+ type-2 ependymoglia cells but had no effect on the proliferation of type-1 ependymoglia cells (G). p < 0.05; n = 5. The number of PCNA+ type-1 cells was also unaffected in non-hot spots (H). n = 5. Data represented as mean ± SEM. The scale bars represent 50 μm.
Figure 4
Figure 4
Ablation of ChAT+ Neurons Leads to De Novo Generation of Type-2 and Proliferating PSA-NCAM Cells in Non-Hot Spots. (A and B) ChAT+ neurons are present in the parenchyma of the bed nucleus of the stria terminalis (A). The drawing of the newt brain indicates the plane of section. ChAT+ neurons are lost 7 days after injection of AF64A (A) and subsequently regenerate after 25 days (A). Quantified in (B). p < 0.05; n = 5. (C–E) Compared to control (C), there is an increase of PCNA+ type-2 ependymoglia cells (arrow) in the hot spot adjacent to the ablated ChAT+ neurons (D). Quantified in (E). p < 0.05; n = 5. (F–H) Compared to control (F), ablation of ChAT+ neurons caused an increase of PCNA+ type-1 and the appearance of PCNA+ type-2 ependymoglia cells (arrow) in the ventral non-hot spot. Quantified in (H). p < 0.05; n = 5. (I–K) Compared to control (I), ablation of ChAT+ neurons caused an increase of PSA-NCAM (NCAM) MCM2+ cells in the hot spot (arrow). Quantified in (K). p < 0.05; n = 5. (L–N) Lack of PSA-NCAM+/MCM2+ cells in the ventral non-hot spot (L). Ablation of ChAT+ neurons caused the appearance of PSA-NCAM+/MCM2+ cells in non-hot spots (arrow; M). Quantified in (N). p < 0.05; n = 5. Data represented as mean ± SEM. The scale bars represent 50 μm.
Figure 5
Figure 5
Inhibition of Notch Signaling Causes an Increase in Cell Proliferation during Homeostatic Conditions (A–D) Control (A) versus DAPT-treated (B) brains shows an increase in PCNA+ type-2 ependymoglia cells in hot spots (arrows). Quantified in (C). p < 0.05; n = 5. No significant effect of DAPT treatment on non-hot spot cells (D). n = 5. (E–G) Control (E) versus DAPT-treated (F) brains shows an increase in MCM2+ PSA NCAM+ (NCAM) cells (arrows) in hot spots. Quantified in (G). p < 0.05; n = 4. Data represented as mean ± SEM. The scale bars represent 50 μm.
Figure 6
Figure 6
Injury Leads to Changes in the Cellular Response to Inhibition of Notch Signaling (A and B) After ablation of cholinergic neurons, DAPT treatment does not significantly affect the injury-induced proliferation neither of type-1 and type-2 ependymoglia cells (A) nor the PSA NCAM+ (NCAM) cells (B) in hot spots. n = 5. (C and D) After ablation of cholinergic neurons, DAPT treatment leads to a decrease in injury-induced proliferation of type-1 ependymoglia (C) and an increase in PSA-NCAM+ cells in non-hot spots. p < 0.05; n = 5. (E–G) DAPT treatment caused a decrease in the incorporation of EdU by GFAP+ neurosphere cells (E and F). Quantified in (G). p < 0.05; n = 4. Data represented as mean ± SEM. The scale bars represent 50 μm.
Figure 7
Figure 7
Summary of Proliferation Dynamics during Homeostasis and Regeneration in the Presence or Absence of Notch-Signaling Inhibitor (A) Expression patterns of various glial and proliferation markers expressed by type-1 and type-2 ependymoglia cells. (B) In the graphic representation of the cells lining the ventricle, squares represent type-1 cells (GFAP+, Notch1+, and GS+), diamonds depict type-2 cells (GFAP+, Notch1, and GS), and circles denote PSA-NCAM+ neuroblasts. The thickness of the arrows indicates the relative number of cycling cells, with dashed line being the lowest and thick bold being the highest.

Similar articles

Cited by

References

    1. Abdullayev I., Kirkham M., Björklund Å.K., Simon A., Sandberg R. A reference transcriptome and inferred proteome for the salamander Notophthalmus viridescens. Exp. Cell Res. 2013;319:1187–1197. - PubMed
    1. Ables J.L., Decarolis N.A., Johnson M.A., Rivera P.D., Gao Z., Cooper D.C., Radtke F., Hsieh J., Eisch A.J. Notch1 is required for maintenance of the reservoir of adult hippocampal stem cells. J. Neurosci. 2010;30:10484–10492. - PMC - PubMed
    1. Adolf B., Chapouton P., Lam C.S., Topp S., Tannhäuser B., Strähle U., Götz M., Bally-Cuif L. Conserved and acquired features of adult neurogenesis in the zebrafish telencephalon. Dev. Biol. 2006;295:278–293. - PubMed
    1. Arias-Carrión O., Freundlieb N., Oertel W.H., Höglinger G.U. Adult neurogenesis and Parkinson’s disease. CNS Neurol. Disord. Drug Targets. 2007;6:326–335. - PubMed
    1. Arias-Carrión O., Yamada E., Freundlieb N., Djufri M., Maurer L., Hermanns G., Ipach B., Chiu W.-H., Steiner C., Oertel W.H., Höglinger G.U. Neurogenesis in substantia nigra of parkinsonian brains? J. Neural Transm. Suppl. 2009:279–285. - PubMed

Publication types

MeSH terms

Substances