

Differential conformational dynamics in the closely homologous FK506-binding domains of FKBP51 and FKBP52
- PMID: 24749623
- PMCID: PMC4060953
- DOI: 10.1042/BJ20140232
Differential conformational dynamics in the closely homologous FK506-binding domains of FKBP51 and FKBP52
Abstract
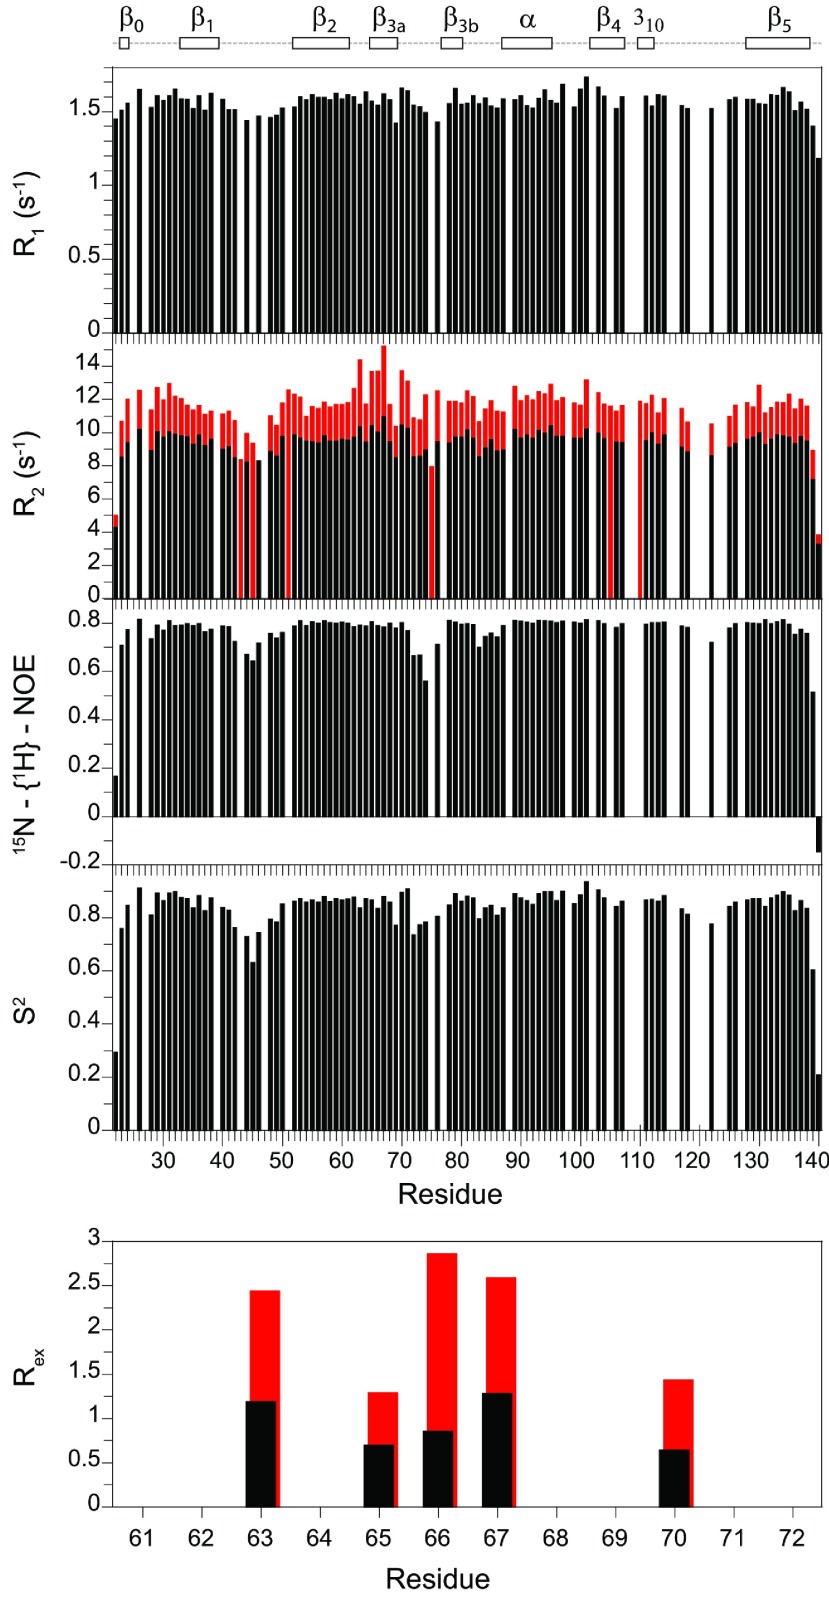
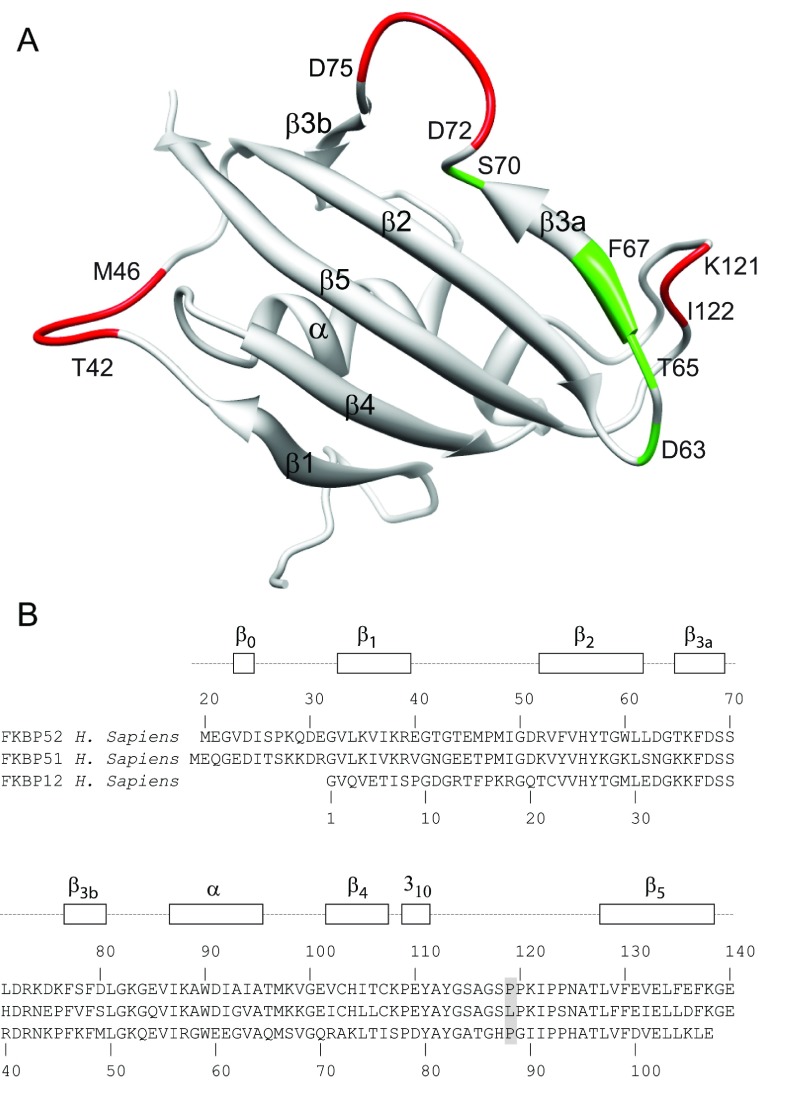
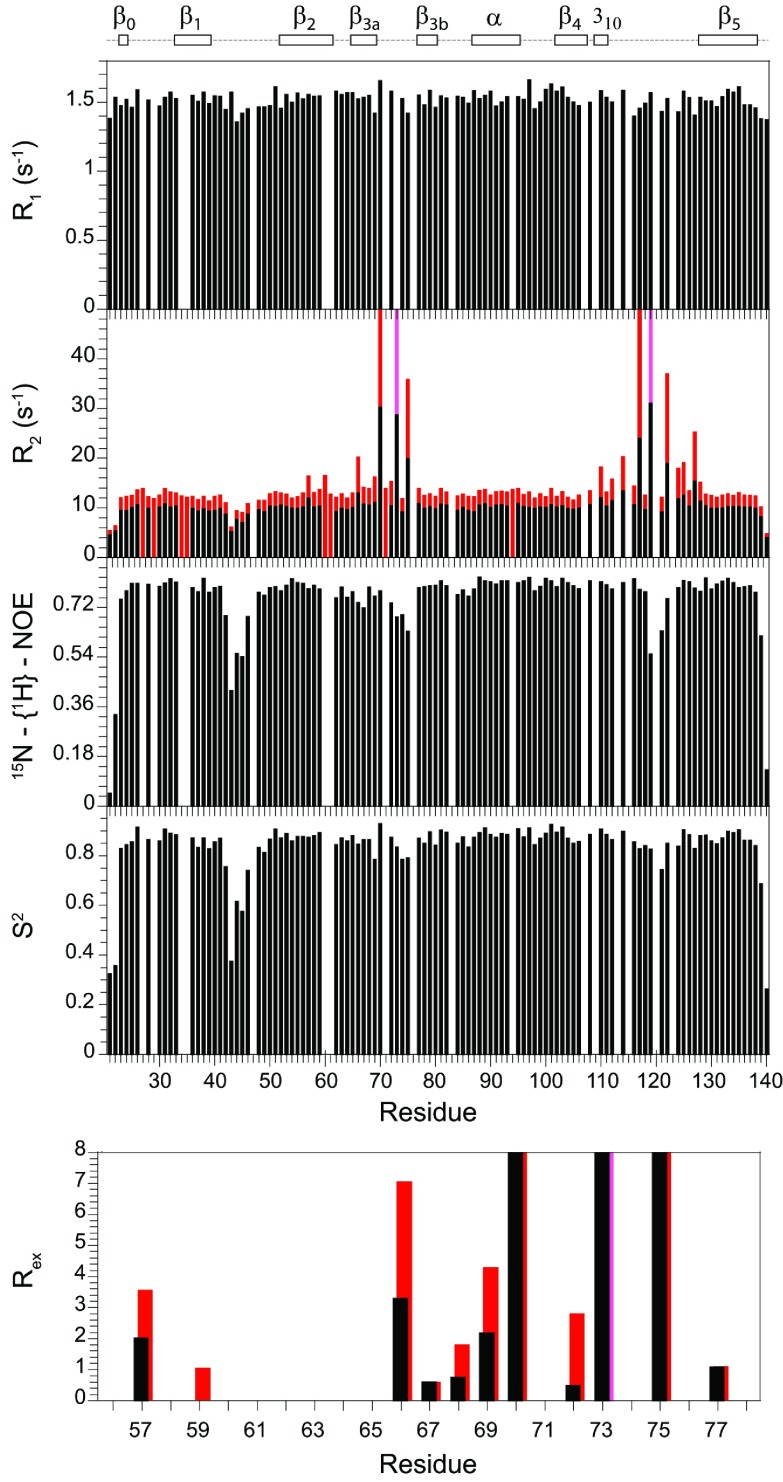
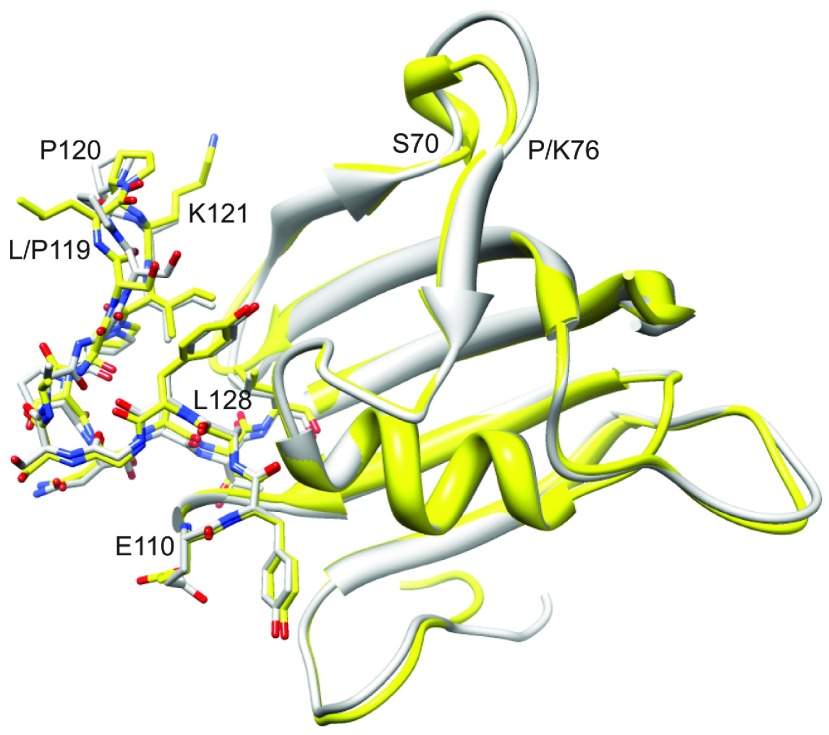
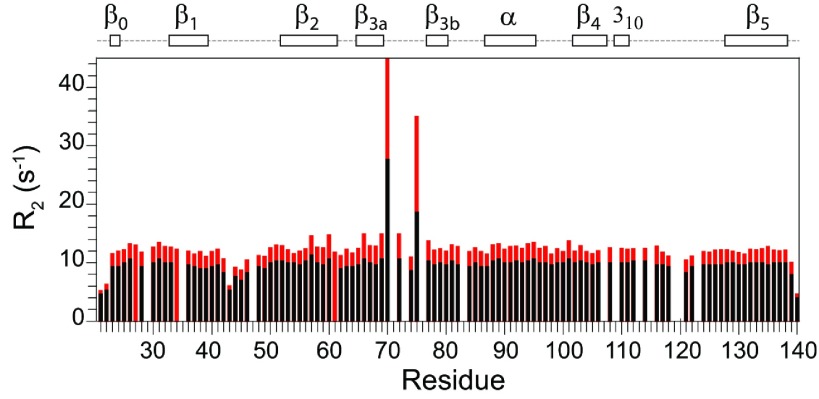
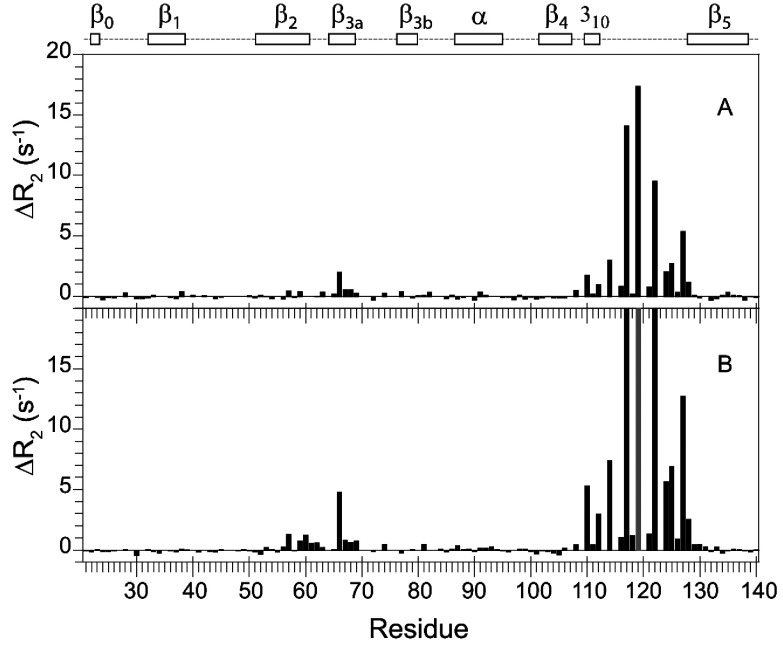
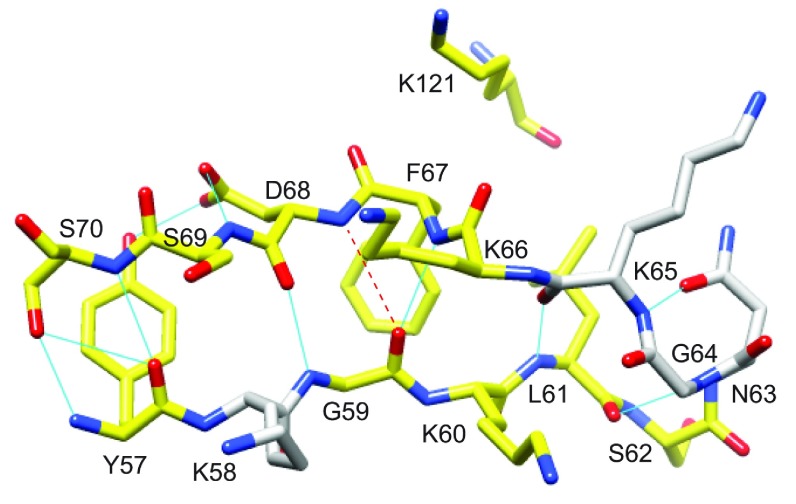
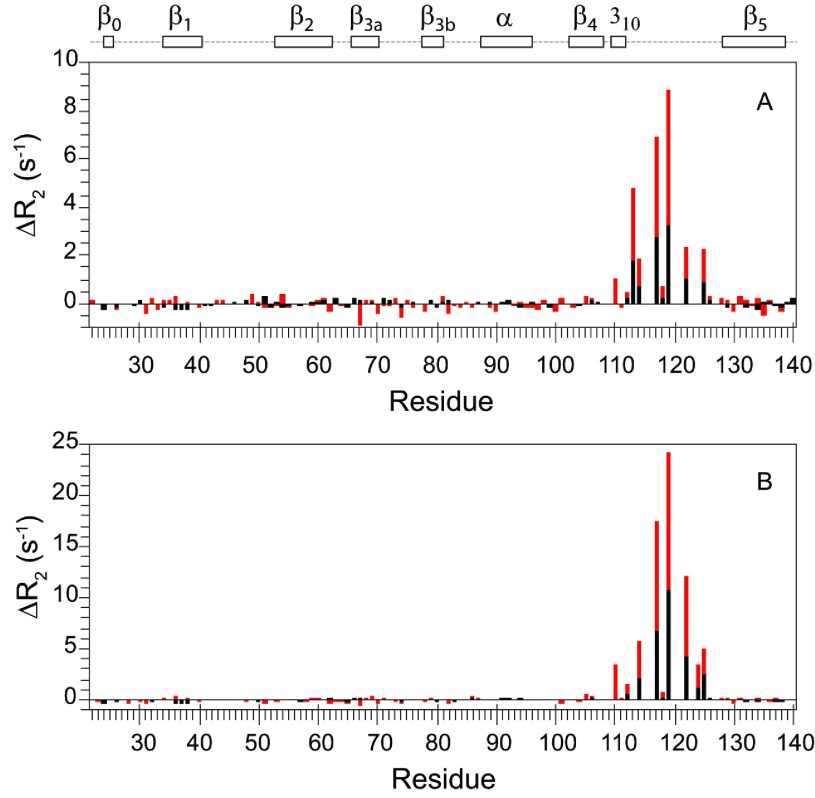
As co-chaperones of Hsp90 (heat-shock protein 90), FKBP51 (FK506-binding protein of 51 kDa) and FKBP52 (FK506-binding protein of 52 kDa) act as antagonists in regulating the hormone affinity and nuclear transport of steroid receptor complexes. Exchange of Leu119 in FKBP51 for Pro119 in FKBP52 has been shown to largely reverse the steroid receptor activities of FKBP51 and FKBP52. To examine whether differences in conformational dynamics/plasticity might correlate with changes in the reported receptor activities, 15N-NMR relaxation measurements were carried out on the N-terminal FKBP domains of FKBP51 and FKBP52 as well as their residue-swapped variants. Both proteins exhibit a similar pattern of motion in the picosecond-nanosecond timeframe as well as a small degree of 15N line-broadening, indicative of motion in the microsecond-millisecond timeframe, in the β3a strand of the central sheet. Only the FKBP51 domain exhibits much larger line-broadening in the adjacent β3 bulge (40's loop of FKBP12) and throughout the long β4-β5 loop (80's loop of FKBP12). The L119P mutation at the tip of the β4-β5 loop completely suppressed the line-broadening in this loop while partially suppressing the line-broadening in the neighbouring β2 and β3a strands. The complementary P119L and P119L/P124S variants of FKBP52 yielded similar patterns of line-broadening for the β4-β5 loop as that for FKBP51, although only 20% and 60% as intense respectively. However, despite the close structural similarity in the packing interactions between the β4-β5 loop and the β3a strand for FKBP51 and FKBP52, the line-broadening in the β3a strand is unaffected by the P119L or P119L/P124S mutations in FKBP52.
Figures
Similar articles
-
Conformational Dynamics in FKBP Domains: Relevance to Molecular Signaling and Drug Design.Curr Mol Pharmacol. 2015;9(1):5-26. doi: 10.2174/1874467208666150519113146. Curr Mol Pharmacol. 2015. PMID: 25986571 Free PMC article. Review.
-
Coupling of Conformational Transitions in the N-terminal Domain of the 51-kDa FK506-binding Protein (FKBP51) Near Its Site of Interaction with the Steroid Receptor Proteins.J Biol Chem. 2015 Jun 19;290(25):15746-15757. doi: 10.1074/jbc.M115.650655. Epub 2015 May 7. J Biol Chem. 2015. PMID: 25953903 Free PMC article.
-
Molecular dynamics simulation, binding free energy calculation and unbinding pathway analysis on selectivity difference between FKBP51 and FKBP52: Insight into the molecular mechanism of isoform selectivity.Proteins. 2018 Jan;86(1):43-56. doi: 10.1002/prot.25401. Epub 2017 Oct 26. Proteins. 2018. PMID: 29023988
-
The helix 1-3 loop in the glucocorticoid receptor LBD is a regulatory element for FKBP cochaperones.Mol Endocrinol. 2013 Jul;27(7):1020-35. doi: 10.1210/me.2012-1023. Epub 2013 May 17. Mol Endocrinol. 2013. PMID: 23686112 Free PMC article.
-
FKBP51 and FKBP52 in signaling and disease.Trends Endocrinol Metab. 2011 Dec;22(12):481-90. doi: 10.1016/j.tem.2011.08.001. Epub 2011 Aug 31. Trends Endocrinol Metab. 2011. PMID: 21889356 Free PMC article. Review.
Cited by
-
Cryo-EM reveals how Hsp90 and FKBP immunophilins co-regulate the glucocorticoid receptor.Nat Struct Mol Biol. 2023 Dec;30(12):1867-1877. doi: 10.1038/s41594-023-01128-y. Epub 2023 Nov 9. Nat Struct Mol Biol. 2023. PMID: 37945740 Free PMC article.
-
Conformational Dynamics in FKBP Domains: Relevance to Molecular Signaling and Drug Design.Curr Mol Pharmacol. 2015;9(1):5-26. doi: 10.2174/1874467208666150519113146. Curr Mol Pharmacol. 2015. PMID: 25986571 Free PMC article. Review.
-
Statistical allosteric coupling to the active site indole ring flip equilibria in the FK506-binding domain.Biophys Chem. 2014 Aug;192:41-8. doi: 10.1016/j.bpc.2014.06.004. Epub 2014 Jun 24. Biophys Chem. 2014. PMID: 25016286 Free PMC article.
-
Coupling of Conformational Transitions in the N-terminal Domain of the 51-kDa FK506-binding Protein (FKBP51) Near Its Site of Interaction with the Steroid Receptor Proteins.J Biol Chem. 2015 Jun 19;290(25):15746-15757. doi: 10.1074/jbc.M115.650655. Epub 2015 May 7. J Biol Chem. 2015. PMID: 25953903 Free PMC article.
-
Interplay of p23 with FKBP51 and their chaperone complex in regulating tau aggregation.Nat Commun. 2025 Jan 14;16(1):669. doi: 10.1038/s41467-025-56028-0. Nat Commun. 2025. PMID: 39809798 Free PMC article.
References
-
- Sanchez E. R. HSP56: a novel heat shock protein associated with untransformed steroid receptor complexes. J. Biol. Chem. 1990;265:22067–22070. - PubMed
Publication types
MeSH terms
Substances
Grants and funding
LinkOut - more resources
Full Text Sources
Other Literature Sources
Research Materials
Miscellaneous