. 2014 May 23:1343:135-42.
doi: 10.1016/j.chroma.2014.03.075. Epub 2014 Apr 4.

High ionic strength narrows the population of sites participating in protein ion-exchange adsorption: a single-molecule study

Affiliations

High ionic strength narrows the population of sites participating in protein ion-exchange adsorption: a single-molecule study

Lydia Kisley et al. J Chromatogr A. .

Abstract

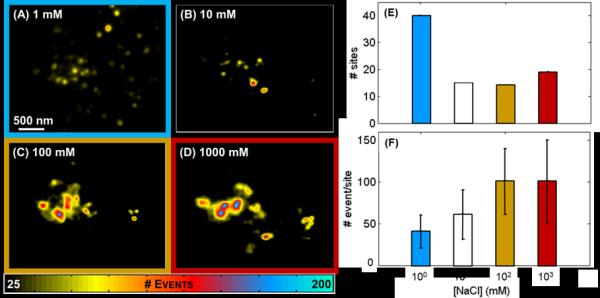
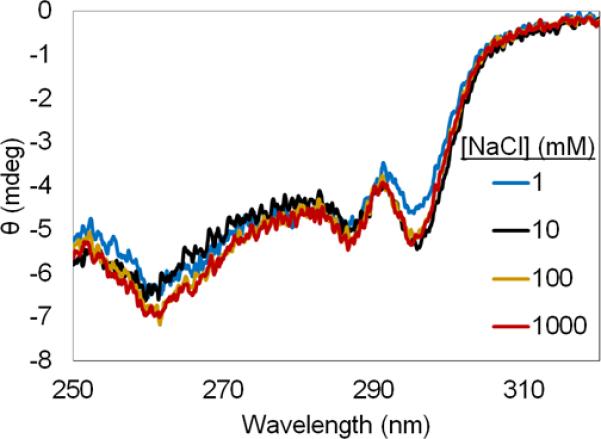
The retention and elution of proteins in ion-exchange chromatography is routinely controlled by adjusting the mobile phase salt concentration. It has repeatedly been observed, as judged from adsorption isotherms, that the apparent heterogeneity of adsorption is lower at more-eluting, higher ionic strength. Here, we present an investigation into the mechanism of this phenomenon using a single-molecule, super-resolution imaging technique called motion-blur Points Accumulation for Imaging in Nanoscale Topography (mbPAINT). We observed that the number of functional adsorption sites was smaller at high ionic strength and that these sites had reduced desorption kinetic heterogeneity, and thus narrower predicted elution profiles, for the anion-exchange adsorption of α-lactalbumin on an agarose-supported, clustered-charge ligand stationary phase. Explanations for the narrowing of the functional population such as inter-protein interactions and protein or support structural changes were investigated through kinetic analysis, circular dichroism spectroscopy, and microscopy of agarose microbeads, respectively. The results suggest the reduction of heterogeneity is due to both electrostatic screening between the protein and ligand and tuning the steric availability within the agarose support. Overall, we have shown that single molecule spectroscopy can aid in understanding the influence of ionic strength on the population of functional adsorbent sites participating in the ion-exchange chromatographic separation of proteins.

Keywords: Bioseparations; Heterogeneity; Ion-exchange; Optical nanoscopy; mbPAINT.


Figures

Figure 1
Figure 1
Instrument, experiment, and mbPAINT analysis. (A) Total internal reflectance fluorescence microscope used to collect data. An acousto-optic modulator (AOM) and frequency generator are used to synchronize excitation and detection rates to prevent photophysical effects from interfering with measurements [41]. (B) Cartoon representation of α-lactalbumin protein at the penta-argininamide functionalized agarose stationary phase. The emission from the fluorescent label on the protein is only observable when it is adsorbed to the interface, not when it is freely diffusing in the bulk, allowing for (C-E) mbPAINT analysis [42]. (C) The data from the point spread function emission (white dots) is fit to a 2D Gaussian (surface) to obtain the centroid location (blue x). (D) Centroids from ~100 adsorption events (overlaid the diffraction limited image) localized the ligand to ~30 nm, shown in (E), the renormalized pseudo super-resolution image. Scale bar = 200 nm.
Figure 2
Figure 2
Adsorption of α-lactalbumin at the penta-argininamide/agarose interface under different ionic strength conditions. (A, B, C, D) Super-resolution pseudo images of the same region of the sample obtained from 5,000 frames of data in 10 mM Tris, pH 8.0 with added 1, 10, 100, 1000 mM NaCl, respectively. Larger area images are presented in the SI. Quantified number of (E) specific binding sites and (F) events per site from the super-resolution images.
Figure 3
Figure 3
Circular dichroism spectra of α-lactalbumin in 10 mM Tris, pH 8.0 with added 1, 10, 100, or 1000 mM NaCl, showing the weak influence of salt concentration on the protein's structure.
Figure 4
Figure 4
Radii of agarose microbeads as a function of ionic strength. Cumulative distribution of the radius of agarose microbeads extracted from light microscopy images. Average radius extracted from error function fits to the data (solid lines) are listed in legend. (n=61, 88, 67 for 1, 100, 1000 mM, respectively)
Figure 5
Figure 5
Cumulative distributions of desorption times obtained from ensemble of >100 individual penta-argininamide ligands in 10 mM Tris, pH 8.0 with 1 mM - 1000 mM NaCl (nonlinear least squared fits shown by solid lines). Details of fit parameters and dual-linear plots of these data are presented in Table 1 and the SI.
Figure 6
Figure 6
Simulated elution curves obtained from statistical simulations of the ensemble analysis of desorption times of α-lactalbumin at penta-argininamide ligands under different ionic strengths. (inset) Relative efficiencies as measured by plate height (HETP) at different ionic strengths compared to best-performing 1000 mM conditions.

References

    1. Bowen WR, Hughes DT. J. Colloid Interf. Sci. 1993;158:395.
    1. Dismer F, Hubbuch J. J. Chromatogr. A. 2007;1149:312. - PubMed
    1. Hart DS, Harinarayan C, Malmquist G, Axén A, Sharma M, van Reis R. J. Chromatogr. A. 2009;1216:4372. - PubMed
    1. Roth CM, Unger KK, Lenhoff AM. J. Chromatogr. A. 1996;726:45.
    1. Lan Q, Bassi AS, Zhu J-XJ. A. Margaritis, Chem. Eng. J. 2001;81:179.

Publication types

LinkOut - more resources