Profiling hepatic microRNAs in zebrafish: fluoxetine exposure mimics a fasting response that targets AMP-activated protein kinase (AMPK)
- PMID: 24751937
- PMCID: PMC3994061
- DOI: 10.1371/journal.pone.0095351
Profiling hepatic microRNAs in zebrafish: fluoxetine exposure mimics a fasting response that targets AMP-activated protein kinase (AMPK)
Abstract
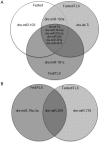
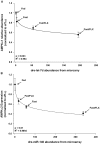
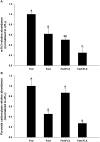
This study examined the similarities in microRNA profiles between fasted and fluoxetine (FLX) exposed zebrafish and downstream target transcripts and biological pathways. Using a custom designed microarray targeting 270 zebrafish miRNAs, we identified 9 differentially expressed miRNAs targeting transcripts in biological pathways associated with anabolic metabolism, such as adipogenesis, cholesterol biosynthesis, triacylglycerol synthesis, and insulin signaling. Exposure of female zebrafish to 540 ng/L FLX, an environmentally relevant concentration and a known metabolic repressor, increased specific miRNAs indicating greater inhibition of these pathways in spite of continued feeding. Further examination revealed two specific miRNAs, dre-let-7d and dre-miR-140-5p, were predicted in silico to bind to a primary regulator of metabolism, adenosine monophosphate-activated protein kinase (AMPK), and more specifically the two isoforms of the catalytic subunit, AMPKα1 and α2, respectively. Real-time analysis of the relative transcript abundance of the α1 and α2 mRNAs indicated a significant inverse relationship between specific miRNA and target transcript. This suggests that AMPK-related pathways may be compromised during FLX exposure as a result of increased miRNA abundance. The mechanism by which FLX regulates miRNA abundance is unknown but may be direct at the liver. The serotonin transporter, slc6a4, is the target of FLX and other selective serotonin reuptake inhibitors (SSRI) and it was found to be expressed in the liver, although treatment did not alter expression of this transporter. Exposure to FLX disrupts key hepatic metabolic pathways, which may be indicative of reduced overall fitness and these effects may be linked to specific miRNA abundance. This has important implications for the heath of fish because concentrations of SSRIs in aquatic ecosystems are continually increasing.
Conflict of interest statement
Figures


Similar articles
-
Developmental fluoxetine exposure in zebrafish reduces offspring basal cortisol concentration via life stage-dependent maternal transmission.PLoS One. 2019 Feb 21;14(2):e0212577. doi: 10.1371/journal.pone.0212577. eCollection 2019. PLoS One. 2019. PMID: 30789953 Free PMC article.
-
Oral squamous cell carcinoma: microRNA expression profiling and integrative analyses for elucidation of tumourigenesis mechanism.Mol Cancer. 2016 Apr 7;15:28. doi: 10.1186/s12943-016-0512-8. Mol Cancer. 2016. PMID: 27056547 Free PMC article.
-
Transcriptomic analysis of microRNAs-mRNAs regulating innate immune response of zebrafish larvae against Vibrio parahaemolyticus infection.Fish Shellfish Immunol. 2019 Aug;91:333-342. doi: 10.1016/j.fsi.2019.05.050. Epub 2019 May 23. Fish Shellfish Immunol. 2019. PMID: 31129189
-
Modulation of miRNA expression by dietary polyphenols in apoE deficient mice: a new mechanism of the action of polyphenols.PLoS One. 2012;7(1):e29837. doi: 10.1371/journal.pone.0029837. Epub 2012 Jan 10. PLoS One. 2012. PMID: 22253797 Free PMC article.
-
Chronic exposure to venlafaxine and increased water temperature reversibly alters microRNA in zebrafish gonads (Danio rerio).Comp Biochem Physiol Part D Genomics Proteomics. 2020 Mar;33:100634. doi: 10.1016/j.cbd.2019.100634. Epub 2019 Nov 4. Comp Biochem Physiol Part D Genomics Proteomics. 2020. PMID: 31715506
Cited by
-
Developmental fluoxetine exposure in zebrafish reduces offspring basal cortisol concentration via life stage-dependent maternal transmission.PLoS One. 2019 Feb 21;14(2):e0212577. doi: 10.1371/journal.pone.0212577. eCollection 2019. PLoS One. 2019. PMID: 30789953 Free PMC article.
-
Zebrafish as an integrative vertebrate model to identify miRNA mechanisms regulating toxicity.Toxicol Rep. 2020 Apr 2;7:559-570. doi: 10.1016/j.toxrep.2020.03.010. eCollection 2020. Toxicol Rep. 2020. PMID: 32373477 Free PMC article. Review.
-
The Interplay between Endocrine-Disrupting Chemicals and the Epigenome towards Metabolic Dysfunction-Associated Steatotic Liver Disease: A Comprehensive Review.Nutrients. 2024 Apr 11;16(8):1124. doi: 10.3390/nu16081124. Nutrients. 2024. PMID: 38674815 Free PMC article. Review.
-
Integrative Transcriptomic and microRNAomic Profiling Reveals Immune Mechanism for the Resilience to Soybean Meal Stress in Fish Gut and Liver.Front Physiol. 2018 Sep 10;9:1154. doi: 10.3389/fphys.2018.01154. eCollection 2018. Front Physiol. 2018. PMID: 30246797 Free PMC article.
-
Fish MicroRNA Responses to Thermal Stress: Insights and Implications for Aquaculture and Conservation Amid Global Warming.Animals (Basel). 2025 Feb 20;15(5):624. doi: 10.3390/ani15050624. Animals (Basel). 2025. PMID: 40075907 Free PMC article. Review.
References
-
- Choudhuri S (2010) Small noncoding RNAs: biogenesis, function, and emerging significance in toxicology. J Biochem Mol Toxicol 24: 195–216. - PubMed
-
- Mennigen JA, Skiba-Cassy S, Panserat S (2013) Ontogenetic expression of metabolic genes and microRNAs in rainbow trout alevins during the transition from the endogenous to the exogenous feeding period. J Exp Biol 216: 1597–1608. - PubMed
-
- Bartel DP (2004) MicroRNAs: genomics, biogenesis, mechanism, and function. Cell 116: 281–297. - PubMed
Publication types
MeSH terms
Substances
LinkOut - more resources
Full Text Sources
Other Literature Sources
Molecular Biology Databases
Research Materials
Miscellaneous

