. 2014 Apr 21;9(4):e94662.
doi: 10.1371/journal.pone.0094662. eCollection 2014.

High-affinity glucose transport in Aspergillus nidulans is mediated by the products of two related but differentially expressed genes

Affiliations

High-affinity glucose transport in Aspergillus nidulans is mediated by the products of two related but differentially expressed genes

Josep V Forment et al. PLoS One. .

Abstract

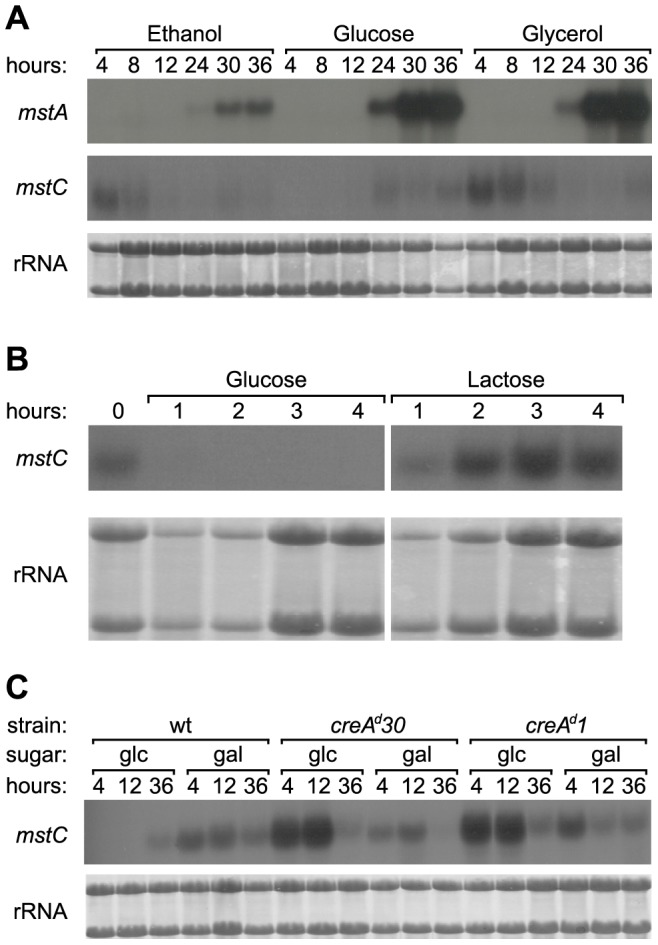
Independent systems of high and low affinity effect glucose uptake in the filamentous fungus Aspergillus nidulans. Low-affinity uptake is known to be mediated by the product of the mstE gene. In the current work two genes, mstA and mstC, have been identified that encode high-affinity glucose transporter proteins. These proteins' primary structures share over 90% similarity, indicating that the corresponding genes share a common origin. Whilst the function of the paralogous proteins is little changed, they differ notably in their patterns of expression. The mstC gene is expressed during the early phases of germination and is subject to CreA-mediated carbon catabolite repression whereas mstA is expressed as a culture tends toward carbon starvation. In addition, various pieces of genetic evidence strongly support allelism of mstC and the previously described locus sorA. Overall, our data define MstC/SorA as a high-affinity glucose transporter expressed in germinating conidia, and MstA as a high-affinity glucose transporter that operates in vegetative hyphae under conditions of carbon limitation.


Conflict of interest statement

Competing Interests: Dr. Daniel Ramón is CEO of the commercial company ‘Biopolis S.L.’ This does not alter the authors' adherence to all the PLOS ONE policies on sharing data and materials.

Figures

Figure 1
Figure 1. Structural organisation of the mstA and mstC genes and their translation products.
The upper bars are schematic representations of gene structure with introns (A to E) in white and exons in black. cDNAs generated by RT/PCR from transcripts (dark grey bars) of each gene were sequenced and compared with the genomic sequences, thus confirming the intron/exon structures deduced for each gene. Proteins are shown as white bars within which the numbered grey-shaded boxes correspond to the TM domains predicted by TMHMM . The locations of the mutations and the corresponding changes in the 1° structure of MstC found in the sorA2 (#) and sorA3 (*) mutants are also shown (see text for details). The sorA2 mutation causes a change in reading frame resulting in a shorter and novel COOH-terminal sequence (shown in bold) within which resides a putative TM domain (marked with a circle). The annotation of the A. nidulans genome assigned the locus identities AN8737 and AN6669 to mstA and mstC, respectively.
Figure 2
Figure 2. Unrooted phylogenetic tree of primary structures of Eurotiomycete proteins related to MstA (AN8737) and MstC (AN6669).
The evolutionary history was inferred using the Maximum Likelihood method, and the percentages of replicate trees in which the associated sequences clustered together in the bootstrap test (50 replicates) are shown next to the branches (values below 80% are not included). Branch lengths correspond to the mean number of substitutions per site. Where known, genome locus identities are given; ‘Corr’ indicates that the gene model was corrected; unannotated sequences are given as ‘mstA-like’. The homologues in A. flavus and A. oryzae were found to be encoded by identical genomic DNA sequences (only A. flavus is shown), as expected for organisms that are believed to be variants of the same species . A. nidulans is the only organism represented that possesses two very closely related proteins. MstA (AN8737) and MstC (AN6669) are shown in bold.
Figure 3
Figure 3. Characterisation of MstC.
A Marker rescue of a sorA mutant by mstC. Top panel: sorA mutant strains (V045 and G186) are able to grow in the presence of 50 µg/ml 2-DOG and 1% EtOH compared to wild type. Middle panel: A typical minimal medium plate lacking riboflavin but supplemented with 2-DOG used for identifying 2-DOG sensitive transformants (those that do not grow); V082 fails to grow as it is auxotrophic for riboflavin. Lower panel: typical PCR products specific to the wild type mstC allele amplified off gDNA templates. R = resistant to 2-DOG, S = sensitive to 2-DOG. T = transformant. T22 and T29 are asterisked to help their identification on the plate in the middle panel. T33 is a control transformed with pPL5 alone. B Typical Michaelis-Menten plots of glucose uptake rate versus glucose concentration for conidia of the two ΔmstC strains V109 (□) and V110 (▴), and the mstC+ strain V111 (•) germinating for 4 h in appropriately supplemented minimal medium containing 1% glycerol as carbon source; non-linear regressions are shown as dashed, dotted and solid lines, respectively. Insert: Eadie-Hofstee plots. The plots for V109 and V110 are monophasic. Their displacement towards the y axis relative to the plot of V111 is indicative of the loss of high-affinity uptake. C Typical Michaelis-Menten plots of glucose uptake rate versus glucose concentration for conidia of strains V140 (sorA2) (□) and V045 (sorA3); non-linear regressions are shown as solid and dashed lines, respectively. (•) germinating for 4 h in appropriately supplemented minimal medium containing 1% glycerol as carbon source. The insert shows Eadie-Hofstee plots of the uptake data for both strains. D Relative 14C-glucose uptake rates in the presence of a 200-fold molar excess of competing compounds are expressed as a percentage of the non-competed (control) rate.
Figure 4
Figure 4. Characterisation of MstA.
A Typical Michaelis-Menten plots of glucose uptake rate versus glucose concentration for ΔmstA conidia germinating for 4 h in appropriately supplemented minimal medium containing either 1% glycerol (□, dashed line) or 1% glucose (•, solid line) as carbon source. B Typical Michaelis-Menten plots of glucose uptake rate versus glucose concentration for conidia of strains V136 (•) and V152 (□) germinating in appropriately supplemented medium containing 1% glycerol as carbon source. The respective solid and dashed lines correspond to the non-linear regressions from which the Km values were obtained. The insert shows Eadie-Hofstee plots of the uptake data for both strains. The dashed line corresponds to the higher affinity uptake component present in strain V152, the slope of which yields an approximation to the Km of this component (∼30 µM). C Relative 14C-glucose uptake rates in the presence of a 200-fold molar excess of competing compounds is expressed as a percentage of the non-competed (control) rate.
Figure 5
Figure 5. Energetics of glucose uptake.
Relative glucose uptake rates for glycerol-germinated conidia expressing MstC (dark grey - V004) and MstA (light grey - V152) transporters assayed in the absence (−) and presence (+) of CCCP.
Figure 6
Figure 6. Northern analyses of gene expression.
A Total RNA was isolated from shake flask biomass grown in the presence of the following carbon sources (initial concentration): ethanol (0.5% v/v) a poor, derepressing source; glucose (0.5% w/v) a good, repressing source; and glycerol (0.5% w/v) a good, derepressing source. All sources were exhausted by 20 h. Biomass was harvested at the times indicated after inoculation of conidia. B mstC mRNA accumulation during conidial germination in media containing glucose or lactose (each present at an initial concentration of 0.5% w/v). Total RNA was isolated from biomass harvested from shake-flask cultures at the times indicated after inoculation of conidia. C mstC mRNA accumulation in two CCR mutants (creAd) compared to wild type (wt). The two CCR mutants and the wild type strain were grown in the presence of glucose (glc) or galactose (gal), each initially present at 0.5% (w/v). Total RNA was isolated from biomass harvested from shake-flask cultures at the times indicated after inoculation of conidia. In all cases cultures were grown from conidia for the times indicated, and rRNA was visualised by methylene blue staining .

References

    1. Keller NP, Turner G, Bennett JW (2005) Fungal secondary metabolism - from biochemistry to genomics. Nat Rev Microbiol 3: 937–947. - PubMed
    1. Pao SS, Paulsen IT, Saier MH Jr (1998) Major facilitator superfamily. Microbiol Mol Biol Rev 62: 1–34. - PMC - PubMed
    1. Özcan S, Johnston M (1999) Function and regulation of yeast hexose transporters. Microbiol Mol Biol Rev 63: 554–569. - PMC - PubMed
    1. Leandro MJ, Fonseca C, Goncalves P (2009) Hexose and pentose transport in ascomycetous yeasts: an overview. FEMS Yeast Res 9: 511–525. - PubMed
    1. Palma M, Goffeau A, Spencer-Martins I, Baret PV (2007) A phylogenetic analysis of the sugar porters in hemiascomycetous yeasts. J Mol Microbiol Biotechnol 12: 241–248. - PubMed

Publication types

MeSH terms

Associated data