. 2014 Jul;32(7):670-6.
doi: 10.1038/nbt.2889. Epub 2014 Apr 20.

Genome-wide binding of the CRISPR endonuclease Cas9 in mammalian cells

Affiliations

Genome-wide binding of the CRISPR endonuclease Cas9 in mammalian cells

Xuebing Wu et al. Nat Biotechnol. 2014 Jul.

Abstract

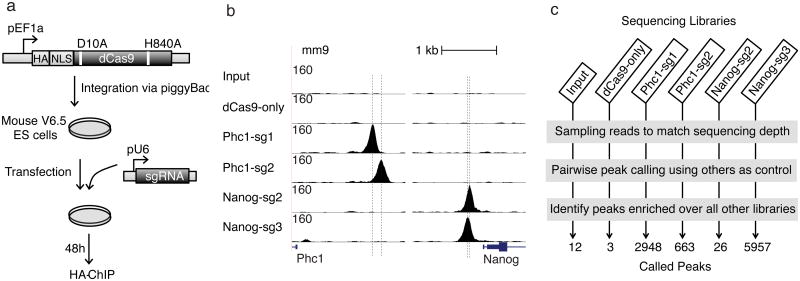
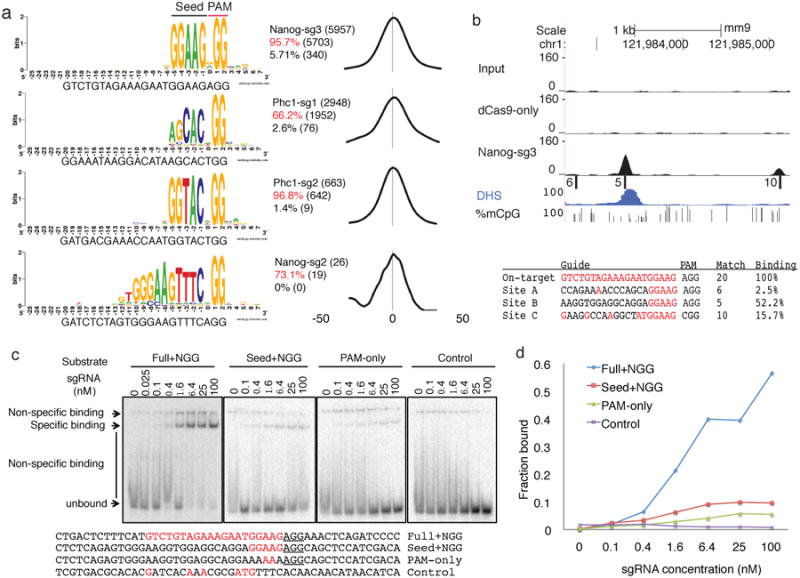
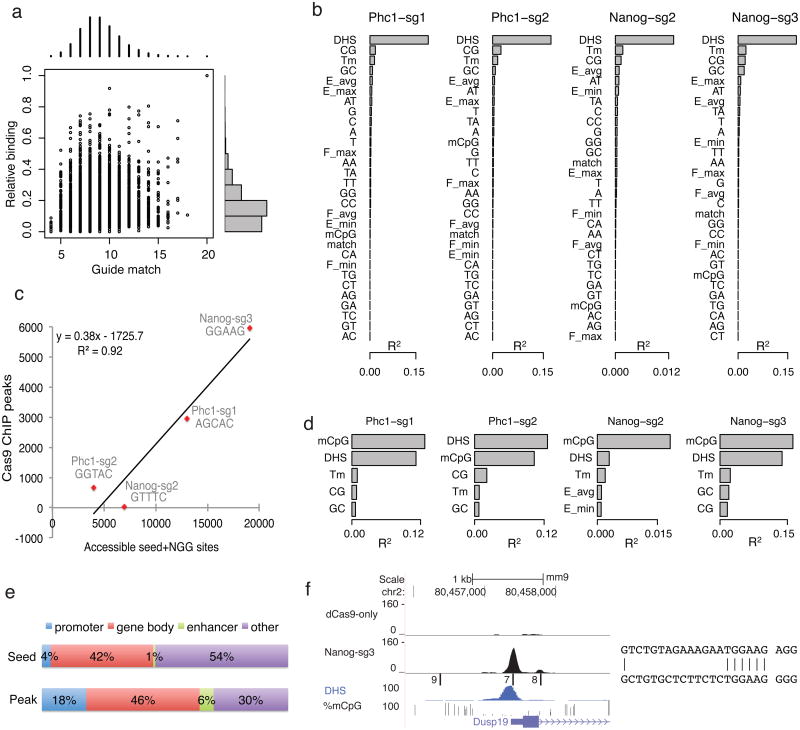
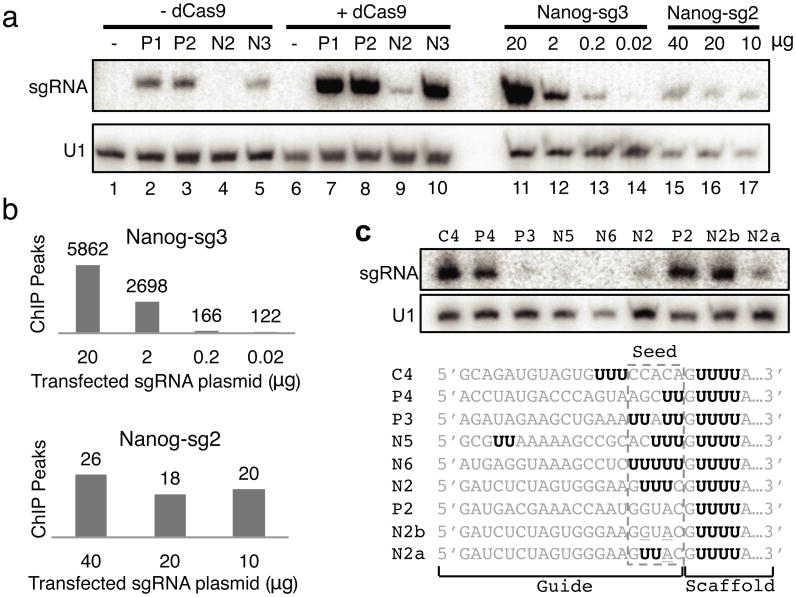
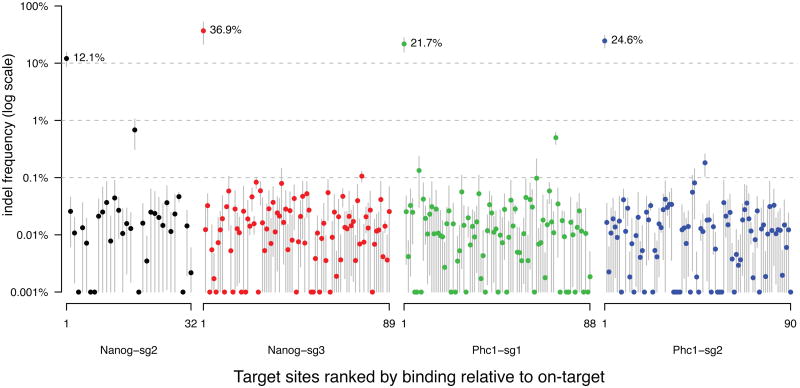
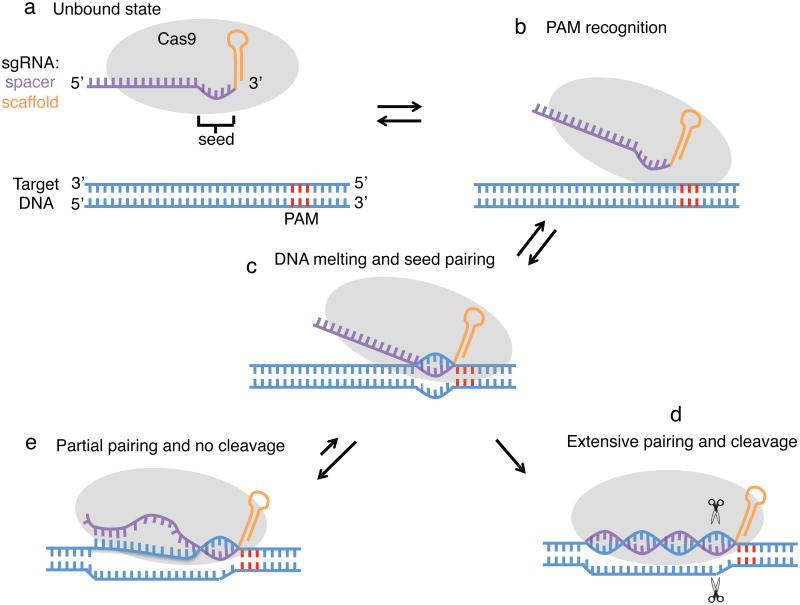
Bacterial type II CRISPR-Cas9 systems have been widely adapted for RNA-guided genome editing and transcription regulation in eukaryotic cells, yet their in vivo target specificity is poorly understood. Here we mapped genome-wide binding sites of a catalytically inactive Cas9 (dCas9) from Streptococcus pyogenes loaded with single guide RNAs (sgRNAs) in mouse embryonic stem cells (mESCs). Each of the four sgRNAs we tested targets dCas9 to between tens and thousands of genomic sites, frequently characterized by a 5-nucleotide seed region in the sgRNA and an NGG protospacer adjacent motif (PAM). Chromatin inaccessibility decreases dCas9 binding to other sites with matching seed sequences; thus 70% of off-target sites are associated with genes. Targeted sequencing of 295 dCas9 binding sites in mESCs transfected with catalytically active Cas9 identified only one site mutated above background levels. We propose a two-state model for Cas9 binding and cleavage, in which a seed match triggers binding but extensive pairing with target DNA is required for cleavage.


Figures

Figure 1
Figure 1
Genome-wide in vivo binding of dCas9-sgRNA. (a) Schematic of dCas9 ChIP. EF1a promoter-driven HA-tagged dCas9 with nuclear localization signal (NLS) is integrated into the genome of mESCs via the piggyBac system. Plasmids containing U6 promoter-driven sgRNAs were transfected and ChIP was carried out two days later with HA antibody. (b) ChIP signals (normalized read counts) around on-target sites. Vertical dashed lines indicate designed target sites (the region complementary to the sgRNA). (c) Peak calling. Reads were sampled from each library, and peaks were called using each other library as a control (Online Methods). Only peaks called over all other five controls were retained. The numbers at the bottom indicate the numbers of peaks called for each library using these criteria.
Figure 2
Figure 2
A 5-nucleotide seed for dCas9 binding. (a) Most peaks are associated with seed+NGG matches. The best match to the sgRNA followed by NGG within 50bp flanking peak summits were aligned to generate the sequence logo using WebLogo. The text to the right of the logos indicates the total number of peaks (top line), percentage and number of peaks with exact 5-nucleotide seed+NGG match within 50 bps of peak summits (middle line, in red) or when the 100 nucleotides sequence were shuffled while maintaining dinucleotide frequency (bottom line). The distribution of the exact seed+NGG match relative to the peak summit was shown on the right (the numbers indicate nucleotide positions) (b) Example of binding at seed+NGG only sites. On the top are six tracks: Input, dCas9- only IP, and Nanog-sg3 IP read density, seed+NGG sites (position indicated by bars, named as A/B/C, and the numbers to the left indicates the number of matches to the guide), DHS read density and fraction of methylated alleles at CpG sites. Below are the target sequences, PAM, number of matches to the sgRNA and relative binding at each site. Guide-matched bases are in red. (c) Gel shift assay for 50 bp double-stranded DNA substrates with sequences matching the Nanog-sg3 on-target site (“Full+NGG”) and a seed+NGG only off-target site (“Seed+NGG”, site B in Fig 2b). “PAM only” is the “Seed+NGG” substrate with a mutated seed. The negative control substrate (“Control”) was designed to contain no NGG or NAG. Complete substrate sequences are shown at the bottom, with PAM underlined and guide-matched bases in red. (d) The quantification of the gels in (c). Shown is the percentage of the specific binding band relative to the entire lane at each sgRNA concentration.
Figure 3
Figure 3
Chromatin accessibility is the major determinant of binding in vivo. (a) Scatter (center) and histogram (top and right) plots of the number of matches to the sgRNA guide region (x-axis) and binding relative to the on-target site (y-axis) for all Nanog- sg3 peaks. Relative binding levels (0 to 1) are divided into 10 equal bins and the number of peaks in each bin is shown on the right of the scatter plot. (b) Ranking of features based on R2, the percent of variation in binding explained by each feature in a linear regression model (using R, one feature a time). DHS: DNase I hypersensitivity read density; Tm: melting temperature; Match: number of bases that match the sgRNA; E(F) min/max/avg: minimum, maximum, and average tetranucleotide energy (flexibility) score within the guide+NGG region; A/C/G/T or their combination indicates mono- and di-nucleotide frequency in the guide+NGG region; %mCpG: average fraction of methylated CpG in the guide+NGG region. (c) Scatter plot and linear regression between the number of dCas9 ChIP peaks and the number of accessible seed+NGG sites (i.e. sites overlapping with DHS peaks). (d) As for (b) but only plotting the top five features after regression was done using sites containing CpG dinucleotides. (e) Off-target peaks are preferentially associated with genes. Shown is the percentage of Nanog-sg3 seed+NGG sites (top) or ChIP peaks (bottom) that fall in each region category. (f) Example of off-target binding at the Dusp19 promoter. Tracks are the same as Fig. 2b. On the right is the alignment of the off-target site with 7 matches (bottom) to the guide sequence (top).
Figure 4
Figure 4
Seed sequences influence sgRNA abundance and specificity. (a) Northern blot showing the abundance of sgRNAs. Lanes 1-10: from cells transfected with dCas9 (lanes 6-10) or without dCas9 (lanes 1-5), and with either no sgRNA (lanes 1 and 6) or one of the four sgRNAs (P1: Phc1-sg1; P2: Phc1-sg2; N2: Nanog-sg2; N3: Nanog-sg3). Lanes 11-14: Nanog-sg3 abundance from dCas9-mESCs transfected with 20, 2, 0.2 or 0.02 μg Nanog-sg3 plasmid. Lanes 15-17: Nanog-sg2 abundance from dCas9-mESCs transfected with 40, 20 or 10 μg Nanog-sg2 plasmid. (b) The number of ChIP peaks detected from cells transfected with decreasing amount of sgRNA plasmids. (c) U-rich seed limits sgRNA abundance. Northern blot from dCas9 cells transfected with the sgRNAs listed below. Consecutive Us are highlighted in bold black.
Figure 5
Figure 5
Indel frequencies at on-target sites and 295 off-target sites. For each sgRNA, selected target sites (Supplementary Table 3) were ranked by decreasing ChIP binding relative to on-target. Dots and gray bars indicate the mean and standard deviation of indel frequency from three biological replicates, respectively. The Y-axis was truncated at 0.001% for visualization at log scale. The indel frequencies for the four on-target sites are labeled with percentages.
Figure 6
Figure 6
A model for Cas9 target binding and cleavage. (a) In the unbound state, Cas9 is loaded with sgRNA but not bound to DNA. The PAM region in the DNA is colored in red. (b) Recognition of the PAM by Cas9. (c) Cas9 melts the DNA target near the PAM to allow seed pairing. (d) If base pairing can be propagated to PAM-distal regions, the two Cas9 nuclease domains may be able to ‘clamp’ the target DNA and cleave it. (e) If only partial pairing occurs, there is no cleavage and Cas9 remains bound to the target.

References

    1. Van der Oost J, Jore MM, Westra ER, Lundgren M, Brouns SJJ. CRISPR-based adaptive and heritable immunity in prokaryotes. Trends Biochem Sci. 2009;34:401–7. - PubMed
    1. Deveau H, Garneau JE, Moineau S. CRISPR/Cas system and its role in phage-bacteria interactions. Annu Rev Microbiol. 2010;64:475–93. - PubMed
    1. Horvath P, Barrangou R. CRISPR/Cas, the immune system of bacteria and archaea. Science. 2010;327:167–70. - PubMed
    1. Terns MP, Terns RM. CRISPR-based adaptive immune systems. Curr Opin Microbiol. 2011;14:321–7. - PMC - PubMed
    1. Marraffini LA, Sontheimer EJ. CRISPR interference: RNA-directed adaptive immunity in bacteria and archaea. Nat Rev Genet. 2010;11:181–90. - PMC - PubMed

Publication types

Associated data