. 2014 May;32(5):490-5.
doi: 10.1038/nbt.2886. Epub 2014 Apr 20.

Label-free detection and molecular profiling of exosomes with a nano-plasmonic sensor

Affiliations

Label-free detection and molecular profiling of exosomes with a nano-plasmonic sensor

Hyungsoon Im et al. Nat Biotechnol. 2014 May.

Abstract

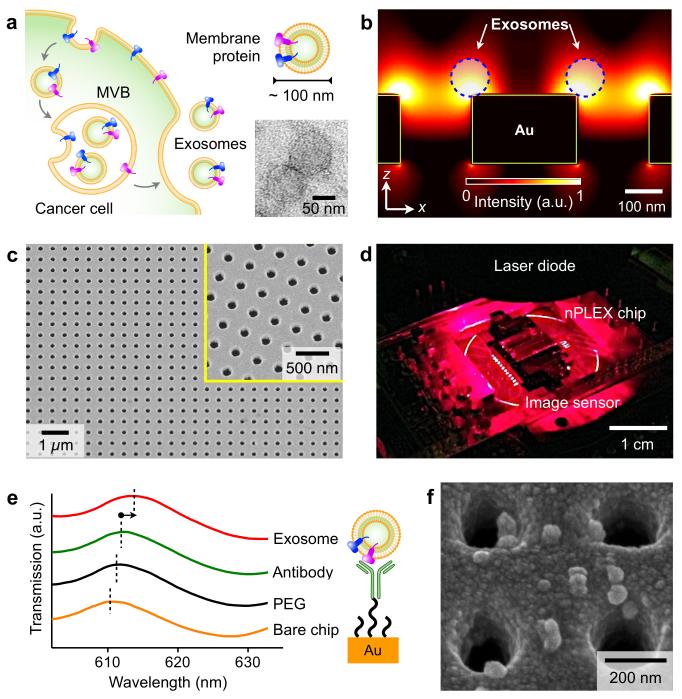
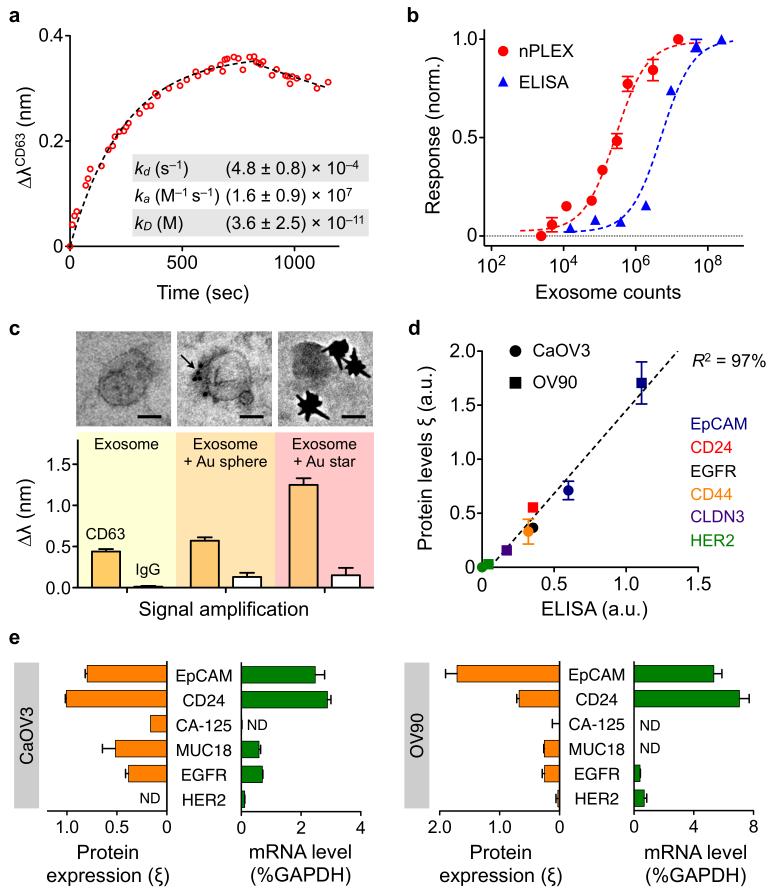
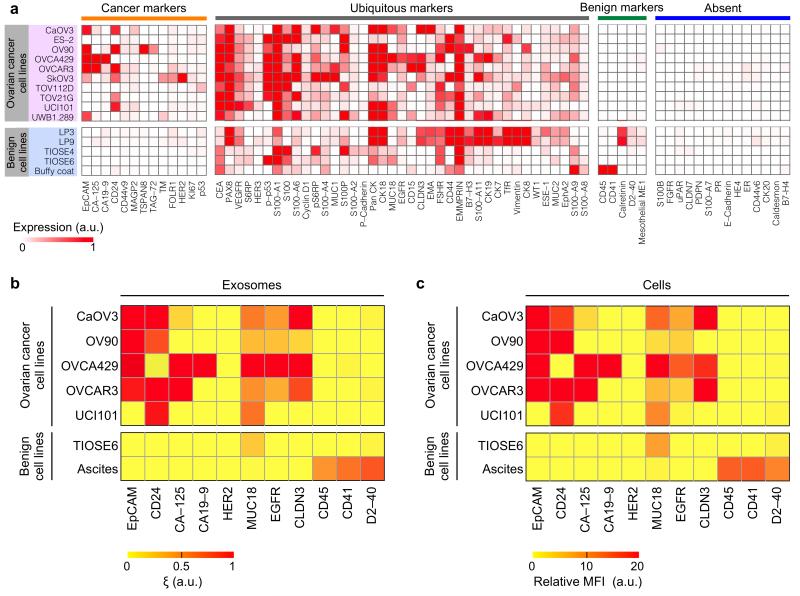
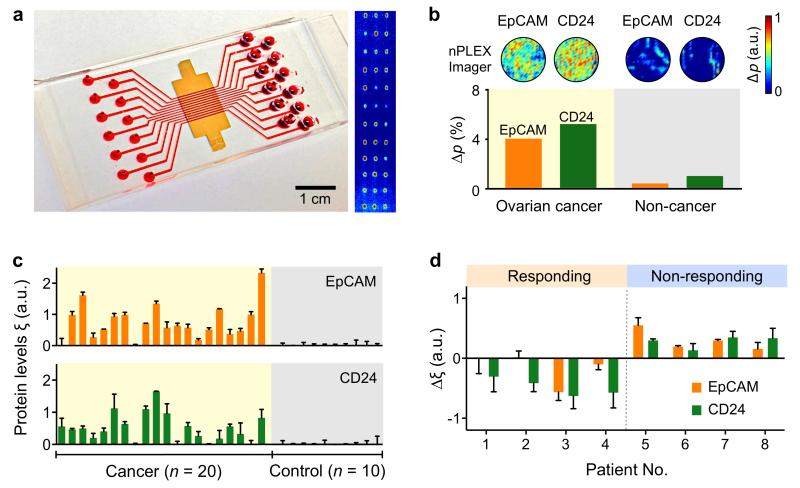
Exosomes show potential for cancer diagnostics because they transport molecular contents of the cells from which they originate. Detection and molecular profiling of exosomes is technically challenging and often requires extensive sample purification and labeling. Here we describe a label-free, high-throughput approach for quantitative analysis of exosomes. Our nano-plasmonic exosome (nPLEX) assay is based on transmission surface plasmon resonance through periodic nanohole arrays. Each array is functionalized with antibodies to enable profiling of exosome surface proteins and proteins present in exosome lysates. We show that this approach offers improved sensitivity over previous methods, enables portable operation when integrated with miniaturized optics and allows retrieval of exosomes for further study. Using nPLEX to analyze ascites samples from ovarian cancer patients, we find that exosomes derived from ovarian cancer cells can be identified by their expression of CD24 and EpCAM, suggesting the potential of exosomes for diagnostics.


Figures

Figure 1
Figure 1. Label-free detection of exosomes with nPLEX sensor
(a) Cancer cells secrete a large abundance of exosomes through fusion of multivesicular body (MVB) with cellular plasma membrane. These nanovesicles carry parental proteins in the same topological orientation. High magnification transmission electron micrograph (inset) indicates exosomes from human ovarian cancer cell (CaOV3) culture have a diameter ~100 nm. (b) Finite-difference time-domain (FDTD) simulation shows the enhanced electromagnetic fields tightly confined near a periodic nanohole surface. The field distribution overlaps with the size of exosomes captured onto the sensing surface, maximizing exosome detection sensitivity. (c) A scanning electron micrograph (SEM) of the periodic nanoholes in the nPLEX sensor. The hole diameter is 200 nm with the periodicity of 450 nm. The structure was patterned in a gold film (200 nm thick) deposited on a glass substrate. The inset shows a zoomed-in image. (d) A prototype miniaturized nPLEX imaging system developed for multiplexed and high-throughput analyses of exosomes. The system uses a complementary-metal-oxide-semiconductor (CMOS) imager to record the transmitted light intensity from a nPLEX chip. (e) A representative schematic of changes in transmission spectra showing exosome detection with nPLEX. The gold surface is pre-functionalized by a layer of polyethylene glycol (PEG), and antibody conjugation and specific exosome binding were monitored by transmission spectral shifts as measured by nPLEX (not drawn to scale). (f) SEM indicates specific exosome capture by functionalized nPLEX.
Figure 2
Figure 2. Exosome quantification and protein profiling with nPLEX
(a) Real-time kinetic sensorgram of exosome capture. Exosomes isolated from a human ovarian cancer cell line (CaOV3) were introduced onto a nPLEX sensor functionalized with anti-CD63 for exosomal capture (kD ~ 36 pM). (b) Comparison of the detection sensitivity of nPLEX and ELISA. The nPLEX detection limit was determined by titrating a known quantity of exosomes and measuring their associated CD63 signal. The detection threshold for ELISA was independently assessed with chemiluminescence (c) nPLEX signal amplification through secondary labeling. Exosomes captured on the nPLEX sensor were further targeted with anti-CD63 Au nanospheres (arrow) or star-shaped particles to enhance spectral shifts. Scale bar, 50 nm. (d) Correlation between nPLEX and ELISA measurements. Exosomes isolated from human ovarian cancer cell lines (CaOV3 and OV90) were used. The marker protein level (ξ) was determined by normalizing the marker signal with that of anti-CD63, which accounted for variation in exosomal counts across samples. a.u., arbitrary unit. (e) mRNA analysis of exosomes eluted from CaOV3 cells (left) or OV90 cells (right). Following nPLEX protein measurements, captured exosomes were released from the chip and subsequently analyzed for mRNA contents. The mRNA levels were normalized against glyceraldehyde 3-phosphate dehydrogenase (GAPDH) levels. ND, non-detected. All measurements in b-e were in performed in triplicate and the data is displayed as mean ± s.d. a.u., arbitrary unit.
Figure 3
Figure 3. Molecular profiling of ovarian cancer protein markers
(a) Levels of 71 protein markers were determined in ovarian cancer cell lines and benign cells(including mesothelial origin: LP3 and LP9, benign ovarian origin: TIOSE 4 and TIOSE 6 and blood origin: buffy coat). Clustering analyses based on Pearson correlation categorized all markers into four subgroups, from left to right: 1) cancer markers expressed by ovarian cancer cell lines only, 2) ubiquitous markers present in both cancer and benign cells, 3) benign markers expressed by benign cells only and 4) markers absent in both cell types. a.u., arbitrary unit. (b, c) Putative ovarian cancer markers (EpCAM, CD24, CA19-9, CLDN3, CA-125, MUC18, EGFR, HER2), immune host cell markers (CD41, CD45) and a mesothelial marker (D2-40) were profiled on exosomes (b, using nPLEX sensor) and their parental ovarian cell lines (c, using flow cytometry). MFI, mean fluorescence intensity. a.u., arbitrary unit. All measurements were performed in triplicate and the data is displayed as mean values.
Figure 4
Figure 4. Profiling of ovarian cancer patient exosomes with nPLEX
(a) A photograph of nPLEX chip integrated with a multi-channel microfluidic cell for independent and parallel analyses. (Right) Transmission intensities of 12 × 3 nanohole arrays were measured simultaneously using the imaging setup. (b) Ascites-derived exosomes from ovarian cancer and non-cancer patients were evaluated by the nPLEX sensor. Cancer exosomes were captured on EpCAM and CD24-specific sensor sites, which led to intensity changes in the transmitted light. (c) Exosomal protein levels of EpCAM and CD24 in ascites samples from patients were measured by nPLEX. Ovarian cancer patient samples (n = 20) were associated with elevated EpCAM and CD24 levels, while non-cancer patients (n = 10) showed negligible signals. (d) Longitudinal monitoring of treatment responses. Ascites samples were collected from ovarian cancer patients before and after chemotherapy (n = 8) and profiled with nPLEX. The bars represent the changes in CD24 and EpCAM levels per exosome before and after treatment. All measurements in c-d were performed in triplicate and the data is displayed as mean ± s.d. a.u., arbitrary unit.

Comment in

  • Tumor signatures in the blood.
    Speicher MR, Pantel K. Speicher MR, et al. Nat Biotechnol. 2014 May;32(5):441-3. doi: 10.1038/nbt.2897. Nat Biotechnol. 2014. PMID: 24811515 No abstract available.

References

    1. Théry C, Ostrowski M, Segura E. Membrane vesicles as conveyors of immune responses. Nat. Rev. Immunol. 2009;9:581–593. - PubMed
    1. Vlassov AV, Magdaleno S, Setterquist R, Conrad R. Exosomes: current knowledge of their composition, biological functions, and diagnostic and therapeutic potentials. Biochim. Biophys. 2012;1820:940–948. - PubMed
    1. Thery C, Amigorena S, Raposo G, Clayton A. Isolation and characterization of exosomes from cell culture supernatants and biological fluids. Curr. Protoc. Cell. Biol. 2006 Chapter 3, Unit 3.22. - PubMed
    1. Brolo AG. Plasmonics for future biosensors. Nat. Photonics. 2012;6:709–713.
    1. Gordon R, Sinton D, Kavanagh KL, Brolo AG. A new generation of sensors based on extraordinary optical transmission. Acc. Chem. Res. 2008;41:1049–1057. - PubMed

Publication types

Substances