. 2014 Apr 21;3(4):e100.
doi: 10.1038/oncsis.2014.14.

Meta-analysis of the global gene expression profile of triple-negative breast cancer identifies genes for the prognostication and treatment of aggressive breast cancer

Affiliations

Meta-analysis of the global gene expression profile of triple-negative breast cancer identifies genes for the prognostication and treatment of aggressive breast cancer

F Al-Ejeh et al. Oncogenesis. .

Erratum in

Abstract

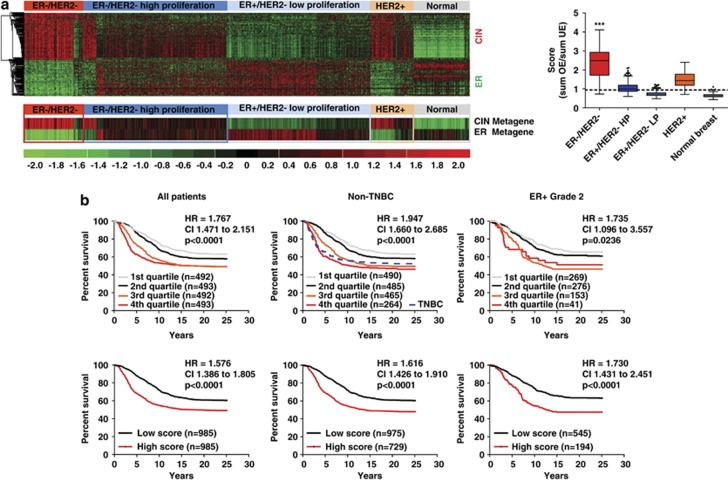
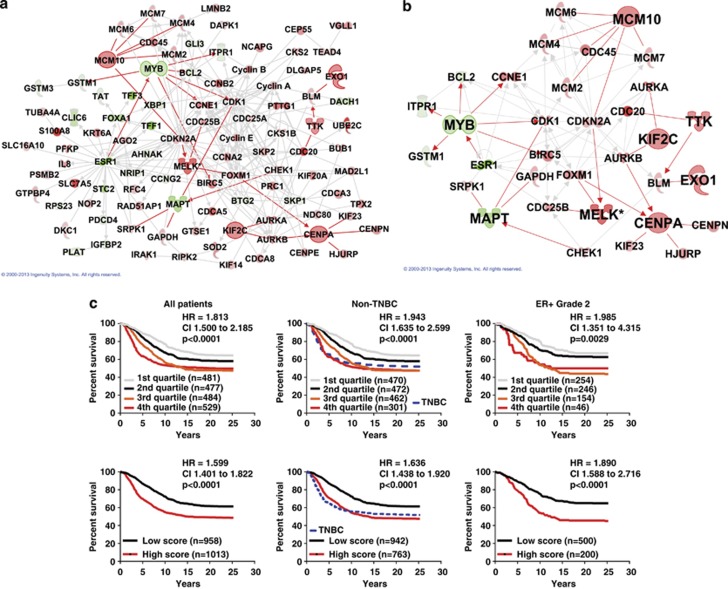
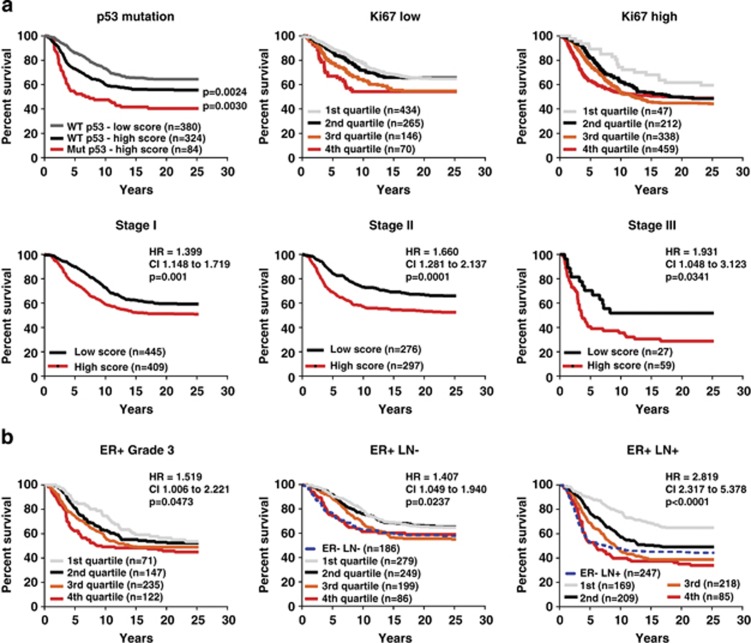
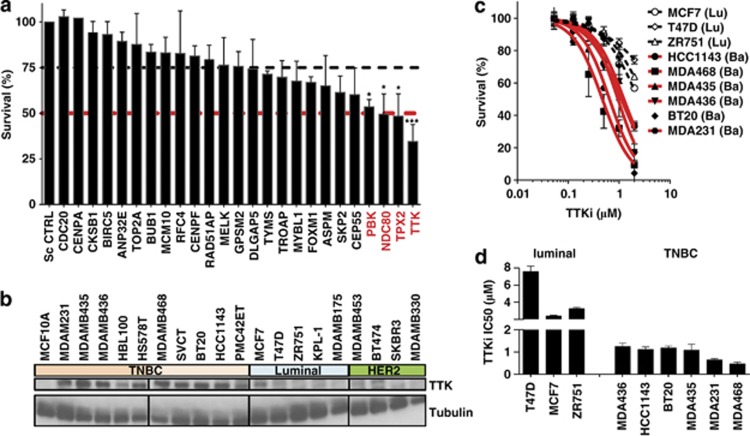
Triple-negative breast cancer (TNBC) is an aggressive breast cancer subtype lacking expression of estrogen and progesterone receptors (ER/PR) and HER2, thus limiting therapy options. We hypothesized that meta-analysis of TNBC gene expression profiles would illuminate mechanisms underlying the aggressive nature of this disease and identify therapeutic targets. Meta-analysis in the Oncomine database identified 206 genes that were recurrently deregulated in TNBC compared with non-TNBC and in tumors that metastasized or led to death within 5 years. This 'aggressiveness gene list' was enriched for two core functions/metagenes: chromosomal instability (CIN) and ER signaling metagenes. We calculated an 'aggressiveness score' as the ratio of the CIN metagene to the ER metagene, which identified aggressive tumors in breast cancer data sets regardless of subtype or other clinico-pathological indicators. A score calculated from six genes from the CIN metagene and two genes from the ER metagene recapitulated the aggressiveness score. By multivariate survival analysis, we show that our aggressiveness scores (from 206 genes or the 8 representative genes) outperformed several published prognostic signatures. Small interfering RNA screen revealed that the CIN metagene holds therapeutic targets against TNBC. Particularly, the inhibition of TTK significantly reduced the survival of TNBC cells and synergized with docetaxel in vitro. Importantly, mitosis-independent expression of TTK protein was associated with aggressive subgroups, poor survival and further stratified outcome within grade 3, lymph node-positive, HER2-positive and TNBC patients. In conclusion, we identified the core components of CIN and ER metagenes that identify aggressive breast tumors and have therapeutic potential in TNBC and aggressive breast tumors. Prognostication from these metagenes at the mRNA level was limited to ER-positive tumors. However, we provide evidence that mitosis-independent expression of TTK protein was prognostic in TNBC and other aggressive breast cancer subgroups, suggesting that protection of CIN/aneuploidy drives aggressiveness and treatment resistance.


Figures

Figure 1
Figure 1
Correlation of breast cancer subtypes and the aggressiveness gene list. The METABRIC data set was visualized according to the expression of the 206 genes (Supplementary Table 1) in the aggressiveness gene list. The aggressiveness score for each tumor was calculated as the ratio of the CIN metagene (average value for CIN genes expression) to the ER metagene (average value for ER genes expression). (a) The expression of the aggressiveness gene list according to the GENIUS histological classification. The box plot shows the aggressiveness score of the histological subtypes. (b) The overall survival of patients in the METABRIC data set was analyzed according to the aggressiveness score (upper row: by quartiles; lower row: by median) in all patients, non-TNBC patients and in patients with ER+ Grade 2 tumors. The hazard ratio (HR), CI and P-value for comparisons of upper quartile vs lower quartiles (upper row) and at the dichotomy across the median (high vs low) are shown (log-rank test, GraphPad Prism). The number of patients (n) in each group is shown in brackets. The expression of the aggressiveness score according to PAM50 and intClust subtypes and survival curves for ER+ grade 3 and PAM50 subtypes according to the aggressiveness score are in Supplementary Figures 4 and 5.
Figure 2
Figure 2
Network analysis of the aggressiveness gene list. (a) Ingenuity Pathway Analysis was performed using direct interactions on the 206 genes in the aggressiveness gene list (red is overexpressed and green is underexpressed). One network of high direct interactions was identified. (b) The genes in the network in A were investigated for their correlation with the aggressiveness score and overall survival (Supplementary Table 2), and eight genes (MAPT, MYB, MELK, MCM10, CENPA, EXO1, TTK and KIF2C) with the highest correlation were still connected in a direct interaction network. (c) The overall survival of patients in the METABRIC data set was analyzed according to the score from the 8 genes in C (upper row: by quartiles; lower row: by median) in all patients, non-TNBC patients and in patients with ER+ Grade 2 tumors.
Figure 3
Figure 3
Survival of patients stratified by the 8-gene score in the METABRIC data set. The overall survival of patients in the METABRIC data set was analyzed according to the 8-gene score in selected settings in all patients (a) or in ER-positive patients only (b). (a) TP53 mutation was compared in high vs low 8-gene score (split by the median). The expression of the proliferation marker Ki67 was divided by dichotomy across the median, and patients in each of these groups were then stratified according to their 8-gene score (split by quartiles). Disease stages (Stage I—Stage III) were stratified by the median 8-gene score. (b) ER+ Grade 3, ER+ lymph node-negative (LN−) and ER+ LN+ tumors were stratified by the quartiles.
Figure 4
Figure 4
The 8-gene score associates with the survival of breast cancer patients. Four published data sets were used to validate the 8-gene score as a predictor of survival. The 8-gene score was calculated for tumors in each of the data sets, and the survival of patients was stratified according to the median 8-gene score; (a) GSE2990, (b) GSE3494, (c) GSE2034 and (d) GSE25066. The hazard ratio (HR), CI and P-value for comparisons of high vs low 8-gene score are shown in the Kaplan–Meier survival curves (log-rank test, GraphPad Prism). The number of patients (n) is shown in brackets. The table in each panel shows multivariate survival analysis using the Cox proportional hazard model including all available conventional indicators.
Figure 5
Figure 5
Therapeutic targets in the aggressiveness gene list. (a) The TNBC cell lines, MDA-MB-231, SUM159PT and Hs578T were treated with control siRNA (Scrambled, Sc CTRL) or siRNA targeting the specified genes, and the survival of these cells was compared on day 6. Data show the average from the three cell lines where each cell line was treated in triplicate. *P<0.05 and ***P<0.001 from one-way ANOVA analysis performed using GraphPad Prism. Data for individual cell lines are shown in Supplementary Table 2. (b) A panel of breast cancer cell lines was used to prepare lysates for immunoblotting of TTK. Tubulin was used as the loading control. (c) Dose response curves for the treatment of breast cancer cell lines in the absence or presence of escalating doses of the TTK inhibitor (TTKi) AZ3146. The survival of cells was measured using the CellTitre MTS/MTA assay carried out 6 days after treatment. Percentage survival (n=3 per dose) was calculated as the percentage of the signal from treated cells to that from control cells. (d) The concentration of TTK required to affect the survival of 50% of the cells (IC50) was measured by GraphPad Prism from the dose response curves in C for each cell line.
Figure 6
Figure 6
TTK protein expression associates with breast cancer survival. The overall survival of patients in a large cohort of breast cancer patients (n=409) was stratified according to TTK staining by immunohistochemistry(scores 0–3). Kaplan–Meier survival curves are shown for all patients (a) with four TTK staining (categories 0–3) and (b) two categories (0–2 vs 3). Log-rank test and P-value were used for survival curves. (c) The distribution of high TTK staining (category 3) across histological subgroups and mitotic indices. Data show the mitotic index (median+range) measured as the number of mitotic cells in 10 high-power fields (hpf). The number of tumors with high TTK staining to the total number of tumors in the cohort is shown on the right. High TTK expression distributed across subtypes and did not associate with mitotic index.
Figure 7
Figure 7
TTK associates with aggressive subtypes and is a therapeutic target. (a) Kaplan–Meier survival curves are shown for Grade 3 tumors, lymph node-positive patients (LN+) and LN+ patients with grade 3 tumors. Log-rank Test and P-value were used for these survival curves. For patients with TNBC and HER2, survival was statistically significant using the Gehan–Breslow–Wilcoxon test (P-values marked by two asterisks), which gives more weight to deaths at early time points. The poorer survival of patients with high Ki67 tumors and high TTK staining was a trend, but it did not reach significance. Survival curves and statistical analyses were performed using GraphPad Prism. (b) TNBC and non-TNBC cell lines were treated for 6 days with the specified concentrations of docetaxel (doc) alone, TTK inhibitor (TTKi) alone or the combinations. The survival of cells was measured using the MTS/MTA assay, as described in Methods. ***P<0.001 comparing the combination with single agents and with non-TNBC cell lines from two-way ANOVA in GraphPad Prism. (c) MDA-MB-231 cells were treated with docetaxel or TTKi alone or in combination and collected at 96 h to perform apoptosis assays by flow cytometry. Early apoptotic cells were defined as annexin V+/7-AAD−. **P<0.01 and ***P<0.001 comparing treatments using one-way ANOVA in GraphPad Prism.

References

    1. Liedtke C, Mazouni C, Hess KR, Andre F, Tordai A, Mejia JA, et al. Response to neoadjuvant therapy and long-term survival in patients with triple-negative breast cancer. J Clin Oncol. 2008;26:1275–1281. - PubMed
    1. Carey LA, Dees EC, Sawyer L, Gatti L, Moore DT, Collichio F, et al. The triple negative paradox: primary tumor chemosensitivity of breast cancer subtypes. Clin Cancer Res. 2007;13:2329–2334. - PubMed
    1. von Minckwitz G, Untch M, Blohmer JU, Costa SD, Eidtmann H, Fasching PA, et al. Definition and impact of pathologic complete response on prognosis after neoadjuvant chemotherapy in various intrinsic breast cancer subtypes. J Clin Oncol. 2012;30:1796–1804. - PubMed
    1. Sorlie T, Perou CM, Tibshirani R, Aas T, Geisler S, Johnsen H, et al. Gene expression patterns of breast carcinomas distinguish tumor subclasses with clinical implications. Proc Natl Acad Sci USA. 2001;98:10869–10874. - PMC - PubMed
    1. Perou CM, Sorlie T, Eisen MB, van de Rijn M, Jeffrey SS, Rees CA, et al. Molecular portraits of human breast tumours. Nature. 2000;406:747–752. - PubMed