. 2014 May 5;211(5):929-42.
doi: 10.1084/jem.20131379. Epub 2014 Apr 21.

Leucine-rich repeat containing 8A (LRRC8A) is essential for T lymphocyte development and function

Affiliations

Leucine-rich repeat containing 8A (LRRC8A) is essential for T lymphocyte development and function

Lalit Kumar et al. J Exp Med. .

Abstract

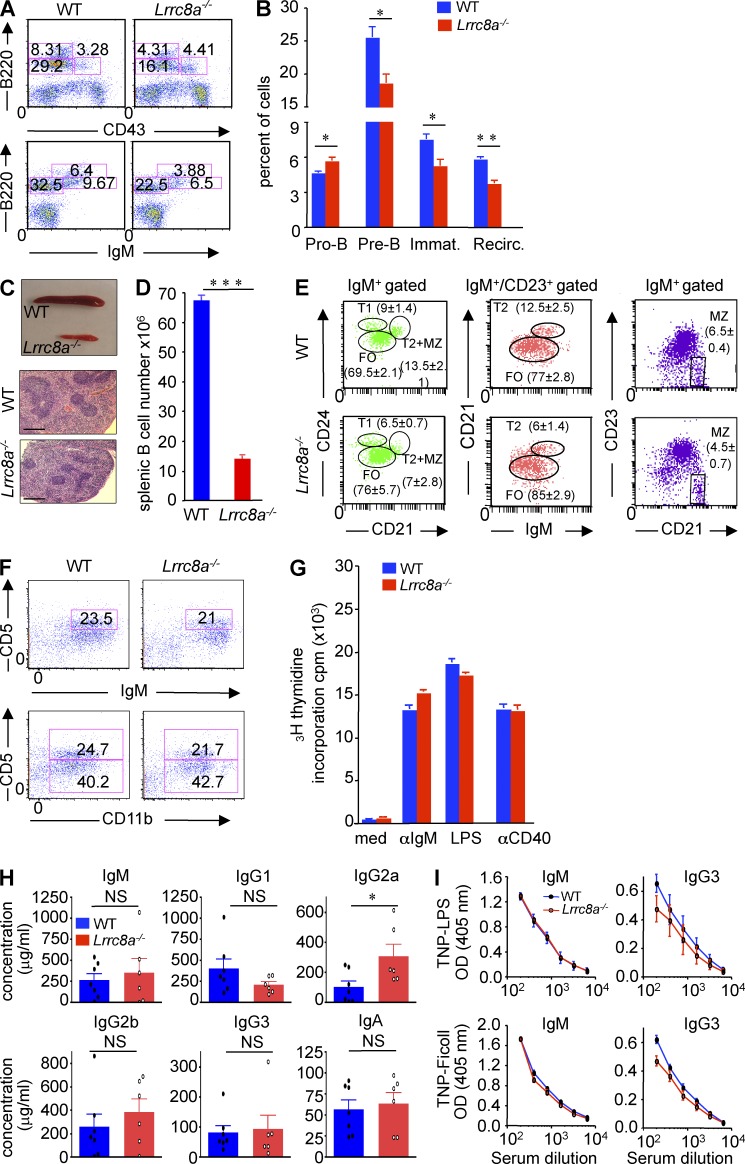
Lrrc8a is a ubiquitously expressed gene that encodes a leucine-rich repeat (LRR)-containing protein detected at higher levels on the surface of thymocytes than on other immune cells. We generated Lrrc8a(-/-) mice to investigate the role of LRRC8A in lymphocyte development and function. Lrrc8a(-/-) mice had increased prenatal and postnatal mortality, growth retardation, and multiple tissue abnormalities. Lrrc8a(-/-) mice displayed a modest block in B cell development but intact intrinsic B cell function. In contrast, both Lrrc8a(-/-) mice and Lrrc8a(-/-)→Rag2(-/-) bone marrow chimeras exhibited a severe cell-intrinsic block in early thymic development, with decreased proliferation and increased apoptosis of thymocytes, and impaired peripheral T cell function. Thymic epithelial cells expressed an LRRC8A ligand that was critical for double-negative to double-positive thymocyte differentiation and survival in vitro. LRRC8A constitutively associated with the GRB2-GAB2 complex and lymphocyte-specific protein tyrosine kinase (LCK) in thymocytes. LRRC8A ligation activated AKT via the LCK-ZAP-70-GAB2-PI3K pathway, and AKT phosphorylation was markedly reduced in the thymus of Lrrc8a(-/-) mice. These findings reveal an essential role for LRRC8A in T cell development, survival, and function.


Figures

Figure 1.
Figure 1.
Expression of LRRC8A in C57BL/6 mice and survival, morphology, and tissue histology of Lrrc8a−/− mice. (A) Q-PCR analysis of Lrrc8a mRNA expression in tissues. Lrrc8a mRNA levels are expressed relative to Gapdh mRNA levels. (B) FACS analysis of LRRC8A surface and intracellular expression on electronically gated splenic CD3+ cells B220+ cells using polyclonal antibody C18. Perm: permeabilized. (C and D) FACS analysis of LRRC8A surface expression by subpopulations of thymocytes (C) and BM B cells (D) using polyclonal antibody C18. (E) FACS analysis of LRRC8A expression on gated splenic CD3+ cells B220+ cells from Lrrc8a−/− mice and WT littermates. (F) Frequency of WT, Lrrc8a+/−, and Lrrc8a−/− pups obtained from the matings of Lrrc8a+/− mice (n = 622 pups). (G) Kaplan-Meier analysis of survival of 120 F2 offspring born from matings of Lrrc8a+/− mice, which included 8 Lrrc8a−/−, 72 Lrrc8a+/−, and 40 Lrrc8a+/+ littermates. (H) Body weight of Lrrc8a−/− mice and of Lrrc8a−/+ and WT littermates (6 mice per group). (I) Gross appearance of WT, Lrrc8a+/−, and Lrrc8a−/− mice at 5 wk of age. (J) Representative H&E-stained tissue sections from skin, skeletal muscle, and ovary (bars, 200 µm), and kidney (bars, 100 µm) of Lrrc8a−/− mice and WT littermates. FC: follicle, CL: corpus luteum. Data are representative of three independent experiments with one mouse per group (A, C, and D), six independent experiments with one mouse per group (B and E), two independent experiments with 3 mice per group (H and I), and two independent experiments with two mice per group (J). Mean and SEM are shown in A and H. ***, P < 0.001 (Student’s t test).
Figure 2.
Figure 2.
B cell development and function in Lrrc8a−/− mice. (A and B) FACS analysis (A) and percentage (B) of B cell subpopulation in the BM (Immat.: immature, Recirc.: recirculating). (C–E) Gross appearance and H&E staining (bars, 200 µm; C), numbers of B220+ cells in spleens (D), and FACS analysis of CD21 and CD24 expression by sIgM+ cells (E, left), of sIgM and CD21 expression by sIgM+CD23+ cells (E, middle), and of CD21 and CD23 expression by sIgM+ cells (E, right). (F) FACS analysis of peritoneal lavage fluid for IgM+CD5+ B1 cells (top) and for CD5 and CD11b (bottom), within the gated B220+ cell population. (G) 3H-thymidine incorporation in purified splenic B cells after anti-IgM, LPS, and anti-CD40 stimulation for 72 h. med.: medium. (H) Serum levels of immunoglobulin isotypes in 4–6-wk-old Lrrc8a−/− mice and WT littermates determined by ELISA. (I) IgM and IgG3 serum antibody levels after immunization with TNP-LPS and TNP-Ficoll. Mice were immunized intraperitoneally with 10 µg TNP-LPS or 10 µg TNP-Ficoll on day 0 and bled on day 14. The level of antigen-specific antibody response in mice sera were analyzed by TNP-specific ELISA using 96-well plates coated with TNP-conjugated BSA at 10 µg/ml in PBS. Data are representative of three independent experiments with one mouse per group (A–C, E, and F), two independent experiments with three mice per group (D and G), six independent experiments with one mouse per group in five experiments and one Lrrc8a−/− mouse and two WT littermates in one experiment (H), and four independent experiments with one mouse per group in two experiments and two mice per group in two experiments (I). ELISAs were run on all samples simultaneously and were repeated twice. Each symbol represent mean OD value of an individual mouse in H. Mean and SEM are shown in B, D, and G–I. *, P < 0.05; **, P < 0.01; and ***, P < 0.001 (Student’s t test). NS = not significant.
Figure 3.
Figure 3.
Decreased thymic cellularity and impaired thymocyte viability in Lrrc8a−/− mice. (A–E) Gross appearance (A), cellularity (B), H&E staining (C; bars: (left) 500 µm; (right) 30 µm; C = cortex, M = medulla; red asterisks in the inset indicate pyknotic nuclei), TUNEL staining (D, bars = 100 µm) with quantitative analysis of TUNEL+ nuclei and immunostaining of thymic sections using a rabbit antibody that recognizes the p17 subunit, but not the precursor form, of caspase 3 (E, left; bars = 100 µm) or the rabbit anti-caspase 3 antibody combined with anti-CD3 (E, right; bars = 20 µm; caspase 3, blue and CD3, brown) with quantification of the results of thymi from Lrrc8a−/− mice and WT littermates (E). (F–I) Gross appearance (F), cellularity (G), H&E staining (H; bars: (left) 500 µm; (right) 30 µm; C = cortex, M = medulla; red asterisks in the inset indicate pyknotic nuclei), and TUNEL staining (I; bars = 100 µm) with quantitative analysis of TUNEL+ nuclei of thymi from Lrrc8a−/−Rag2−/− (Rag2−/− mice reconstituted with Lrrc8a−/− BM) and WT→Rag2−/− (Rag2−/− mice reconstituted with WT BM) BM chimeras. Data are representative of eight experiments with one mouse per group (A and B), and three independent experiments with one mouse per group (C–I). Mean and SEM are shown in D–E, G, and I. **, P < 0.01; ***, P < 0.001.
Figure 4.
Figure 4.
Cell-autonomous defect in thymocyte maturation in Lrrc8a−/− mice. (A–C) Representative FACS analysis of thymocytes with the percentage of cells found in each quadrant indicated (A), number of thymocyte subsets (B), and number of DN cell subsets (C) in the chimeras. (D and E) Percentage of annexin V+ cells (D) and of BrdU+ cells 3 h after i.p. injection of BrdU (E) in total thymocytes from the chimeras. (F) 3H-thymidine incorporation in thymocytes from the chimeras in response to medium (med), anti-CD3+IL-2, and PMA+ionomycin (P+I) stimulation after 72 h in culture. Data are representative of three independent experiments with one mouse per group (A–F). Mean and SEM are shown in B–F. *, P < 0.05; **, P < 0.01; ***, P < 0.001 (Student’s t test). NS = not significant.
Figure 5.
Figure 5.
Defective thymocyte development in Lrrc8a−/− mice. (A) FACS analysis of CD4 and CD8 expression by thymocytes from a 3-wk-old Lrrc8a−/− mouse and WT littermate. The percentage of cells found in each quadrant is indicated. (B and C) Number of DN, DP, and SP thymocytes (B) and of Lineage-negative DN1, DN2, DN3, and DN4 thymocytes (C) in 3–6-wk-old Lrrc8a−/− mice and WT littermates. (D) FACS analysis of ETPs (DN1a-e) in the thymus. Lineage-negative DN1 thymocytes were resolved into ETP subpopulations by staining with c-kit and CD24. The percentage of cells found in each gate is indicated. (E) FACS analysis of LinSca1+c-Kit+ cells in the BM. (F and G) Percentage of annexin V+ cells (F) and BrdU+ cells 3 h after i.p. injection of BrdU (G) in thymocytes from 3–6-wk-old Lrrc8a−/− mice and WT littermates. (H) Percentage of TCR-γ/δ cells in the thymus of Lrrc8a−/− mice and WT controls. Each symbol represents an individual mouse and the small horizontal line indicates the mean. (I) Mean fluorescence intensity (MFI) of surface TCR-β chain expressed on phenotypically mature thymocytes. (J and K) Immunostain of FOXP3+ cells (bars = 200 µm) and its quantitation (J) and percentage of FOXP3+ cells in the CD4+ cell population (K) in thymi from of Lrrc8a−/− mice and WT littermates. Data are representative of six independent experiments with one mouse per group (A, B, C, and H), and three independent experiments with one mouse per group (D–G and I–K). Mean and SEM are shown in B, C, F, G, and I–K. *, P < 0.05; **, P < 0.01; ***, P < 0.001 (Student’s t test). NS = not significant.
Figure 6.
Figure 6.
Cell-autonomous defect in peripheral T cell expansion and function in Lrrc8a−/− mice. (A–E) Gross appearance (scale = centimeter; A), T cell numbers (B), FACS analysis of CD4+ and CD8+ cells in gated CD3+ T cells (C), FACS analysis of CD44 and CD62L expression by gated CD4+ cells and percentages of CD4+CD62hiCD44lo naive T cells and CD4+CD62loCD44hi T effector memory cells (D), and proliferation of T cells (E) from spleens of Lrrc8a−/−Rag2−/− and control WT→Rag2−/− chimeras. (F–H) Splenic T cell numbers (F), FACS analysis of CD4+ and CD8+ cells in gated splenic CD3+ T cells (G), and proliferation of splenic T cells (H) from Lrrc8a−/− mice and WT control littermates. (I) Spectratyping analysis of CD3 diversity of selected TCR-Vβ families in splenic T cells from a 6-wk-old Lrrc8a−/− mouse and its WT littermate. med = medium. P + I = PMA+ionomycin. Data are representative of three independent experiments with one mouse per group (A–H), and two independent experiments with one mouse per group (I). Mean and SEM are shown in B, D–F, and H. *, P < 0.05; ***, P < 0.001 (Student’s t test). NS = not significant.
Figure 7.
Figure 7.
LRRC8A is dispensable for the development and function of thymic epithelium. (A) FACS analysis of MHC class II and BP-1 expression by CD45 cells. Numbers represent the percentage of cells. (B) Immunofluorescence staining of thymic sections (scale bars = 100 µm) for the cTEC antigen CK8, the mTEC antigen CK5, and the nuclear marker DAPI. (C) Expression of AIRE, claudin-4, and UEA-1 in thymi from Lrrc8a−/− and WT littermates (scale bars = 50 µm). (D) Immunofluorescence staining of WT and Lrrc8a−/− fetal thymi 8 wk after engraftment into the renal subcapsular space of WT recipient mice (bars = 100 µm). Data are representative of three independent experiments with one mouse per group (A–D). Mean and SEM are shown in A. NS = not significant.
Figure 8.
Figure 8.
DN thymocyte maturation requires interaction of LRRC8A with a ligand expressed on TECs. (A–D) FACS analysis of the binding of GST-LRRC8A fusion protein to 293T cells (A), splenocytes (B), electronically gated CD45+ and CD45 thymus cells, CD45MHCII+BP-1+ cTECs and CD45MHCII+BP-1 mTECs from WT mice (C), DN, DP, and SP thymocytes from WT mice (D), and the OP9-DL1 stromal cell line (E). (F–H) FACS analysis of CD4 and CD8 expression by purified CD4CD8 DN thymocytes from WT mice after 4 d after co-culture with OP9-DL1 cells in the presence of medium, GST-LRRC8A, or GST as control (F), quantitation of the percentages and numbers of CD4+CD8+ DP cells recovered (G), and percentage of apoptotic cells in the DN and DP populations at the end of the 4 d co-culture as measured by Annexin V staining followed by flow cytometry (H). (I) Dose response curve of the effect of GST-LRRC8A on the in vitro differentiation of DN thymocytes co-cultured with OP9-DL1 cells. DN thymocytes were cultured on OP9-DL1 cells with GST or GST-LRRC8A at the indicated doses. The graph depicts frequency of DN cells after 4 d of culture. Data are representative of six independent experiments with one sample (A) and one mouse (B) per group, three independent experiments with one mouse per group (C and D), and one sample per group (E), and three independent experiments with three samples per group (F–I). Mean and SEM are shown in G–I. ***, P < 0.001 (Student’s t test).
Figure 9.
Figure 9.
LRRC8A associates with GRB2, GAB2, and LCK, and activates AKT via the LCK–ZAP-70–GAB2–PI3K pathway in thymocytes. (A) AKT phosphorylation in WT thymocytes after LRRC8A ligation and the effect of the PI3 kinase inhibitor LY294002 on LRRC8A-mediated AKT phosphorylation. AKT phosphorylation in thymocytes pretreated with LY294002 or DMSO was determined by immunoblotting after LRRC8A ligation for the indicated times. (B) Immunoblot analysis of the phosphorylation of AKT in total DN thymocytes from WT mice after anti-LRRC8A stimulation. (C) AKT phosphorylation in thymocytes from Lrrc8a−/− mice in response to anti-LRRC8A and anti-CD3 cross-linking. CD3-stimulated WT thymocytes were used as controls. (D–F) Co-immunoprecipitation of LRRC8A with GRB2 (D), GAB2 (E), and LCK (F). Ctrl. = control. The asterisk in D indicates a nonspecific band in the control IgG lane. The total cell lysates were prepared from WT thymocytes. LRRC8A immunoprecipitates were immunoblotted for GRB2, and GAB2 and LCK immunoprecipitates were immunoblotted for LRRC8A. Isotype-matched irrelevant antibodies were used in immunoprecipitation as controls. (G–I) Phosphorylation of GAB2 (G), LCK (H), and ZAP-70 (I) after LRRC8A ligation on thymocytes. (J) AKT phosphorylation after LRRC8A ligation of thymocytes pretreated with the SRC kinase inhibitor PP2, the MEK1/2 inhibitor GSK1120212, and the SYK/ZAP-70 inhibitor Piceatannol. (K) LRRC8A- and TCR/CD3-driven AKT phosphorylation in thymocytes from WT or Zap70−/− mice after LRRC8A or TCR/CD3 ligation. Data are representative of three independent experiments with cells derived from one mouse per experiment (A, B, and D–J), and two independent experiments with cells derived from one mouse per group (C and K). The numbers below the blots in A, C, and J represent the mean ratio of pAKT/AKT in two (C) and three (A and J) experiments.
Figure 10.
Figure 10.
Lack of LRRC8A impairs AKT phosphorylation in thymocytes. (A–G) Immunostain for pAKT and AKT (A; bars = 30 µm), pAKT staining of WT thymus with anti-pAKT antibody in the absence or presence of the immunizing phosphopeptide (B; bars = 50 µm), percentage of pAKT-positive and AKT-positive cells (C), and pAKT/AKT staining intensity ratio (D) in thymic sections from 3-wk-old Lrrc8a−/− mice and WT littermates. (E and F) Staining for pSTAT3 and STAT3 (E; bars = 30 µm), and percentage of pSTAT3-positive and STAT3-positive cells (F) in thymic sections from 3-wk-old Lrrc8a−/− mice and WT littermates. (G) Immunostain for pAKT and AKT (bars = 50 µm). Thymic tissue sections derived from Lrrc8a−/−Rag2−/− and WT→Rag2−/− chimeras generated as in Fig. 3 were immunostained with pAKT and AKT specific antibodies. Data are representative of three independent experiments with one mouse per group (A, C, and D), and two independent experiments with one mouse per group (B and E–G). 200–300 cells in each group were counted in E. Mean and SEM are shown in C, D, and F. ***, P < 0.001 (Student’s t test). NS = not significant.

Comment in

References

    1. Abascal F., Zardoya R. 2012. LRRC8 proteins share a common ancestor with pannexins, and may form hexameric channels involved in cell-cell communication. Bioessays. 34:551–560 10.1002/bies.201100173 - DOI - PubMed
    1. Akashi K., Kondo M., von Freeden-Jeffry U., Murray R., Weissman I.L. 1997. Bcl-2 rescues T lymphopoiesis in interleukin-7 receptor-deficient mice. Cell. 89:1033–1041 10.1016/S0092-8674(00)80291-3 - DOI - PubMed
    1. Caron C., Spring K., Laramée M., Chabot C., Cloutier M., Gu H., Royal I. 2009. Non-redundant roles of the Gab1 and Gab2 scaffolding adapters in VEGF-mediated signalling, migration, and survival of endothelial cells. Cell. Signal. 21:943–953 10.1016/j.cellsig.2009.02.004 - DOI - PubMed
    1. Carsetti R., Rosado M.M., Wardmann H. 2004. Peripheral development of B cells in mouse and man. Immunol. Rev. 197:179–191 10.1111/j.0105-2896.2004.0109.x - DOI - PubMed
    1. Chen W.S., Xu P.Z., Gottlob K., Chen M.L., Sokol K., Shiyanova T., Roninson I., Weng W., Suzuki R., Tobe K., et al. 2001. Growth retardation and increased apoptosis in mice with homozygous disruption of the Akt1 gene. Genes Dev. 15:2203–2208 10.1101/gad.913901 - DOI - PMC - PubMed

Publication types