. 2014 May 5;211(5):769-79.
doi: 10.1084/jem.20131072. Epub 2014 Apr 21.

Improved HSC reconstitution and protection from inflammatory stress and chemotherapy in mice lacking granzyme B

Affiliations

Improved HSC reconstitution and protection from inflammatory stress and chemotherapy in mice lacking granzyme B

Larissa S Carnevalli et al. J Exp Med. .

Abstract

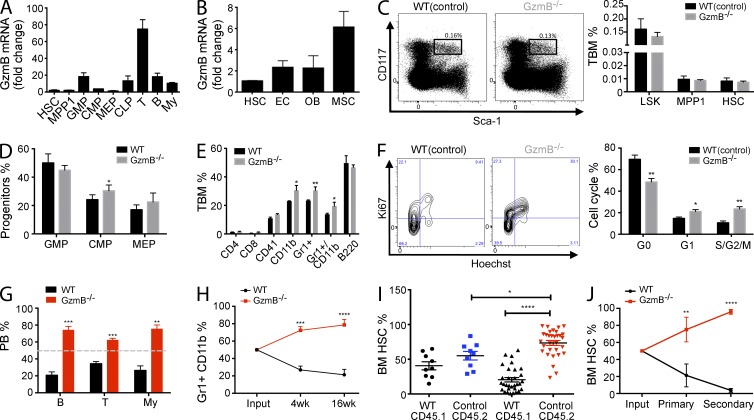
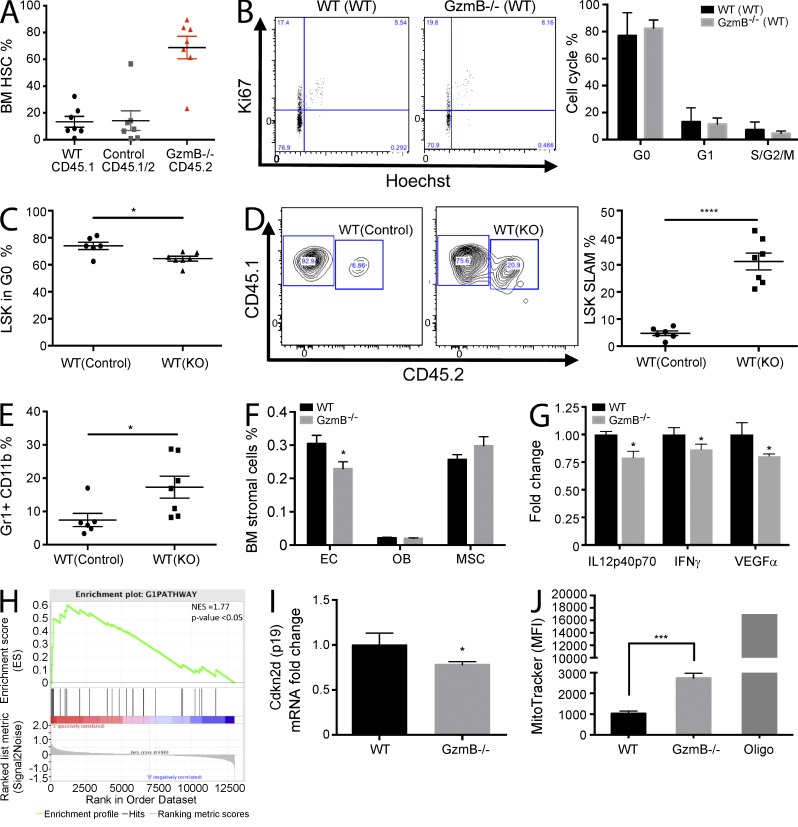
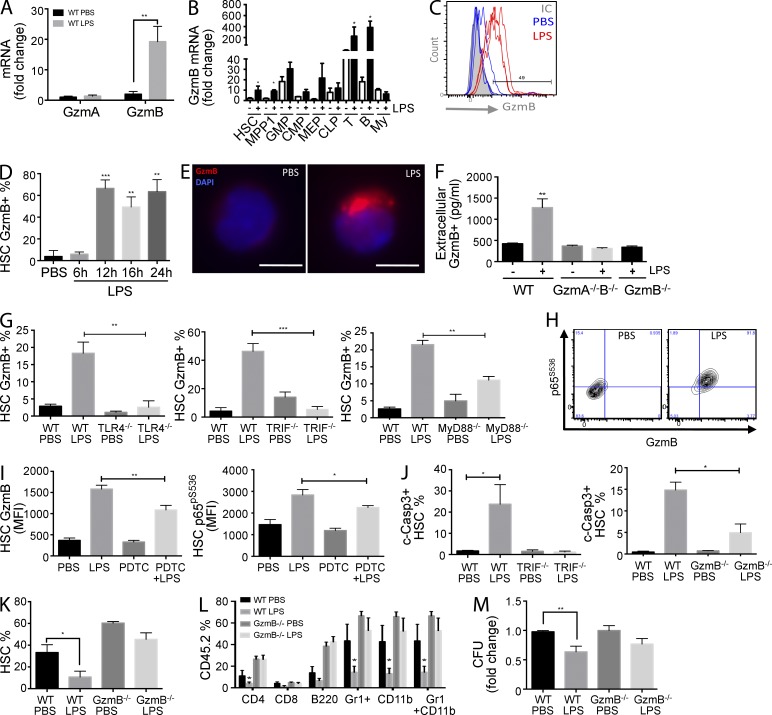
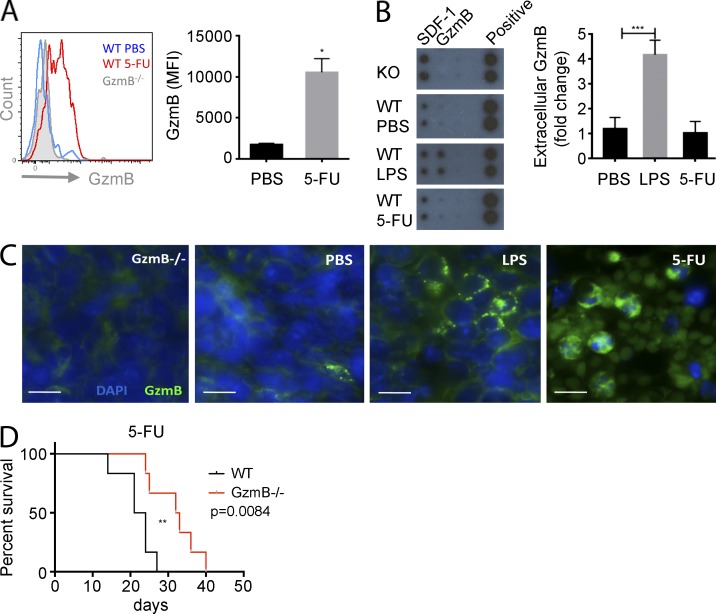
The serine protease granzyme B (GzmB) is stored in the granules of cytotoxic T and NK cells and facilitates immune-mediated destruction of virus-infected cells. In this study, we use genetic tools to report novel roles for GzmB as an important regulator of hematopoietic stem cell (HSC) function in response to stress. HSCs lacking the GzmB gene show improved bone marrow (BM) reconstitution associated with increased HSC proliferation and mitochondrial activity. In addition, recipients deficient in GzmB support superior engraftment of wild-type HSCs compared with hosts with normal BM niches. Stimulation of mice with lipopolysaccharide strongly induced GzmB protein expression in HSCs, which was mediated by the TLR4-TRIF-p65 NF-κB pathway. This is associated with increased cell death and GzmB secretion into the BM environment, suggesting an extracellular role of GzmB in modulating HSC niches. Moreover, treatment with the chemotherapeutic agent 5-fluorouracil (5-FU) also induces GzmB production in HSCs. In this situation GzmB is not secreted, but instead causes cell-autonomous apoptosis. Accordingly, GzmB-deficient mice are more resistant to serial 5-FU treatments. Collectively, these results identify GzmB as a negative regulator of HSC function that is induced by stress and chemotherapy in both HSCs and their niches. Blockade of GzmB production may help to improve hematopoiesis in various situations of BM stress.


Figures

Figure 1.
Figure 1.
GzmB−/− HSCs are more proliferative and show a superior reconstitution capacity because of an increase in functional HSCs. Cell surface marker definition of all cell populations is indicated in Table S1. (A and B) GzmB mRNA expression levels were assessed by RT-PCR in hematopoietic cells (A; n = 6) and in HSCs, endothelial cells (EC), mesenchymal stromal cells (MSC), and osteoblasts (OB) during homeostatic conditions in WT cells (B; n = 3). Fold change was calculated in relation to HSC GzmB mRNA levels. (C) BM cells from WT or GzmB−/− mice were analyzed for the indicated cell populations by flow cytometry. (left) Representative FACS plot showing Sca-1 and CD117 (c-Kit) staining of lin cells; box shows gating on LSK (LinCD117+Sca1+) cells; (right) calculated frequencies of LSK, MPP1, and HSC cells (n = 6). (D and E) Relative frequencies of the indicated progenitor and mature populations in the BM WT and GzmB−/− mice, as assessed by flow cytometry (n = 6 each). (F) Cell cycle status of WT(control) and GzmB−/− HSCs was assessed by Ki67/Hoechst staining. The left panel shows a representative flow cytometry plot, and the right panel shows the quantification of data (n = 6). (G) CD45.1+ WT BM cells were mixed in a 1:1 ratio either with CD45.2+ WT or GzmB−/− BM cells. The relative contribution of donor-derived GzmB−/− CD45.2 and WT CD45.1 BM cells to T, B, and myeloid (My) cells in the circulation was assessed 16 wk after transplantation (n = 6). Gray dashed line indicates 50% reconstitution. (H) Frequency of WT and GzmB−/− myeloid cells in the circulation was assessed at 4 and 16 wk after transplantation (n = 6). (I) CD45.2+ GzmB−/− (red) or WT (blue) BM cells were mixed with CD45.1+ WT HSCs and injected into WT recipient mice, and the frequency of CD45.2 donor cells in the BM was assessed by flow cytometry (n > 9). Graphs in A–I are representative of three independent experiments. (J) CD45.2+ GzmB−/− and CD45.1+ WT HSCs from primary recipients were injected into secondary hosts, and their frequency after primary and secondary BM transplantation was assessed by flow cytometry compared with the input (n = 6). Results in all panels represent means ± SEM of at least two experiments. *, P < 0.05; **, P < 0.01; ***, P < 0.001; and ****, P < 0.0001.
Figure 2.
Figure 2.
GzmB-deficient BM microenvironment promotes stem and progenitor cell proliferation and improves HSC function. (A and B) CD45.2 GzmB−/− and WT CD45.1/2 (control) BM was transplanted into WT CD45.1 recipient mice. (A) Engraftment of HSCs was assessed by flow cytometry (black; n = 7). (B) The cell cycle status of transplanted WT CD45.1/2 and GzmB−/− CD45.2 HSCs was assessed by Ki67/Hoechst staining. The left panel shows representative flow cytometry plots, and the right panel shows quantification from n = 7 mice. (C) Reverse chimeras were generated by transplanting 106 CD45.1/2 WT BM cells into WT (WT(control)) or GzmB-deficient mice WT(KO) (n = 7). Percentage of LSK cells in G0 phase of the cell cycle was assessed by Ki67/Hoechst staining 16 wk after transplantation (n = 7). (D) Total BM was harvested from the primary recipients described in C, mixed at a 1:1 ratio with fresh CD45.1 WT total BM, and injected into lethally irradiated secondary CD45.1 WT recipients. LSK SLAM cells (CD45.1/2) were quantified in secondary recipients (CD45.1) by flow cytometry 16 wk after transplantation (n = 7). Representative flow cytometry contour plots (left) and quantification from n = 7 mice/group (right) are shown. (E) The frequency of Gr1+CD11b+ myeloid progeny was assessed by flow cytometry in the reverse chimeras generated in D (n = 7). (F) Frequency of the indicated BM stromal cell types in control and GzmB−/− mice was assessed by flow cytometry (n = 3). (G) Protein levels of IL12, IFN-γ, and VEGF were measured in the BM of WT and GzmB−/− mice by cytokine array (n = 3). (H) HSCs were isolated from GzmB-deficient mice, and RNA was subject to microarray analysis. A GSEA plot of cell cycle G1-phase genes is shown. P < 0.05 and normalized enrichment score (NES) = 1.77. Positively (red) and negatively (blue) correlated genes are shown. (I) HSCs were purified from WT and GzmB−/− mice, and Cdkn2d (p19) mRNA levels were measured by RT-PCR (n = 6). (J) Mitochondrial mass analysis of homeostatic WT and GzmB−/− HSCs as assessed by MitoTracker staining (n = 6). MFI, mean fluorescence intensity. Data in A–G, I, and J represent means ± SEM of two independent experiments. *, P < 0.05; ***, P < 0.001; and ****, P < 0.0001.
Figure 3.
Figure 3.
LPS-induced GzmB expression in HSCs is dependent on TLR4–TRIF–NF-κB signaling, is secreted, and impairs HSC function in vivo. WT mice were injected with 5 µg LPS i.p. or PBS, and BM was isolated 16 h later. (A and B) GzmA and GzmB mRNA levels in HSCs (A; n = 6) and GzmB mRNA in BM hematopoietic cells (B; n = 6) were measured by RT-PCR. (C) Representative flow cytometry histogram showing GzmB protein expression in HSCs from mice injected with LPS or PBS (n = 3). (D) GzmB expression in HSCs was measured by flow cytometry at the indicated times after LPS treatment (n = 6). (E) LSK SLAM cells were purified from in vivo LPS-stimulated WT mice for 16 h, and GzmB cellular localization was assessed by immunofluorescence using anti-GzmB antibodies and DAPI nuclear staining (n = 4). Bars, 5 µm. (F–H) Mice of the indicated genotype were injected with LPS or PBS as in A (n = 6). (F) Extracellular GzmB (pg/ml) in the BM niche was measured by ELISA. (G) Percentage of GzmB-expressing HSCs (GzmB+) in TLR4−/−, TRIF−/−, and MyD88−/− mice was assessed by flow cytometry. (H) Representative flow cytometry contour plot showing p65pS536 and GzmB expression in HSCs from WT mice 16 h after LPS stimulation. (I) WT mice were pretreated or not with 10 mg/kg PDTC i.p., followed by LPS 10 h later. GzmB and p65pS536 expression in HSCs was measured by flow cytometry 16 h after LPS injection (n = 6). (J) WT, TRIF−/−, or GzmB−/− mice were injected with LPS or PBS as in A, and levels of active caspase-3 (c-Casp3) were measured in HSCs by flow cytometry (n = 6). (K) CD45.2 GzmB−/− or WT mice were injected with LPS or PBS, and HSCs were purified 16 h later, mixed with 106 WT CD45.1/2 BM cells, and injected i.v. into lethally irradiated WT recipients. HSC engraftment was measured by flow cytometry 16 wk after transplant (n = 6). (L) Frequency of the indicated hematopoietic cell types in the mice described in K. (M) GzmB−/− and WT mice were treated with LPS or PBS as in A, and CFUs of total BM cells were assessed. Three plates per point were scored per experiment, and cells were pooled from three different mice. Data represent means ± SEM of at least three (A–F) or two (G–M) independent experiments. *, P < 0.05; **, P < 0.01; and ***, P < 0.001.
Figure 4.
Figure 4.
GzmB deficiency increases 5-FU chemoresistance in vivo. (A) WT and GzmB−/− mice were treated with a single dose of 5-FU, and LSK SLAM cells were quantified after 4 d. (left) Representative flow cytometry histogram; (right) bar graph showing quantitative data from n = 3 mice/group. (B and C) WT mice (n = 3) were injected with a single dose of 5-FU or LPS, and BM was analyzed at 4 d and 16 h, respectively. (B) GzmB secreted in the BM was assessed by dot blot (left) and quantified in n = 3 mice/group (right). (C) GzmB expression in the BM was assessed by immunofluorescence staining with anti-GzmB antibodies and DAPI nuclear stain (n = 3). Bars, 10 µm. (D) GzmB−/− and WT mice (n = 7/group) were injected weekly with 5-FU, and survival was monitored. Data in graphs represent means ± SEM of three independent experiments. *, P < 0.05; **, P < 0.01; and ***, P < 0.001.

Similar articles

Cited by

References

    1. Adachi O., Kawai T., Takeda K., Matsumoto M., Tsutsui H., Sakagami M., Nakanishi K., Akira S. 1998. Targeted disruption of the MyD88 gene results in loss of IL-1- and IL-18-mediated function. Immunity. 9:143–150 10.1016/S1074-7613(00)80596-8 - DOI - PubMed
    1. Akira S., Takeda K. 2004. Toll-like receptor signalling. Nat. Rev. Immunol. 4:499–511 10.1038/nri1391 - DOI - PubMed
    1. Baldridge M.T., King K.Y., Boles N.C., Weksberg D.C., Goodell M.A. 2010. Quiescent haematopoietic stem cells are activated by IFN-γ in response to chronic infection. Nature. 465:793–797 10.1038/nature09135 - DOI - PMC - PubMed
    1. Baldridge M.T., King K.Y., Goodell M.A. 2011. Inflammatory signals regulate hematopoietic stem cells. Trends Immunol. 32:57–65 10.1016/j.it.2010.12.003 - DOI - PMC - PubMed
    1. Birdsall H.H., Porter W.J., Green D.M., Rubio J., Trial J., Rossen R.D. 2004. Impact of fibronectin fragments on the transendothelial migration of HIV-infected leukocytes and the development of subendothelial foci of infectious leukocytes. J. Immunol. 173:2746–2754 - PubMed

Publication types

MeSH terms