. 2014 Jul 1;522(10):2231-48.
doi: 10.1002/cne.23588.

Central projections of intrinsically photosensitive retinal ganglion cells in the macaque monkey

Affiliations

Central projections of intrinsically photosensitive retinal ganglion cells in the macaque monkey

J Hannibal et al. J Comp Neurol. .

Abstract

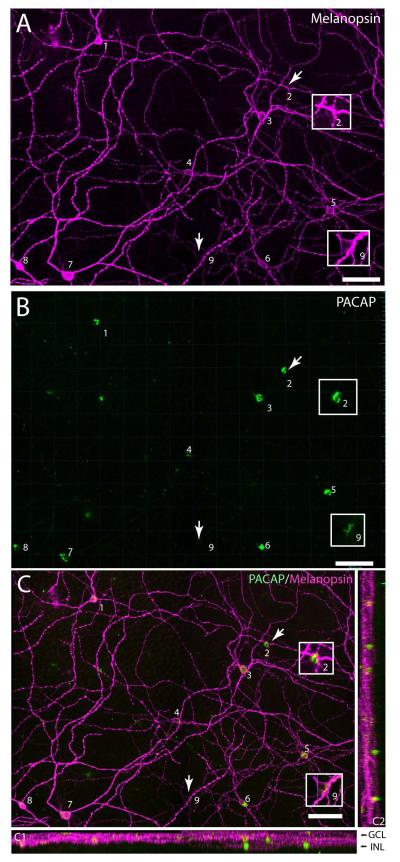
Circadian rhythms generated by the suprachiasmatic nucleus (SCN) are entrained to the environmental light/dark cycle via intrinsically photosensitive retinal ganglion cells (ipRGCs) expressing the photopigment melanopsin and the neuropeptide pituitary adenylate cyclase-activating polypeptide (PACAP). The ipRGCs regulate other nonimage-forming visual functions such as the pupillary light reflex, masking behavior, and light-induced melatonin suppression. To evaluate whether PACAP-immunoreactive retinal projections are useful as a marker for central projection of ipRGCs in the monkey brain, we characterized the occurrence of PACAP in melanopsin-expressing ipRGCs and in the retinal target areas in the brain visualized by the anterograde tracer cholera toxin subunit B (CtB) in combination with PACAP staining. In the retina, PACAP and melanopsin were found to be costored in 99% of melanopsin-expressing cells characterized as inner and outer stratifying melanopsin RGCs. Two macaque monkeys were anesthetized and received a unilateral intravitreal injection of CtB. Bilateral retinal projections containing colocalized CtB and PACAP immunostaining were identified in the SCN, the lateral geniculate complex including the pregeniculate nucleus, the pretectal olivary nucleus, the nucleus of the optic tract, the brachium of the superior colliculus, and the superior colliculus. In conclusion, PACAP-immunoreactive projections with colocalized CtB represent retinal projections of ipRGCs in the macaque monkey, supporting previous retrograde tracer studies demonstrating that melanopsin-containing retinal projections reach areas in the primate brain involved in both image- and nonimage-forming visual processing.

Keywords: LGN; PACAP; PON; RHT; VIP; circadian rhythms; melanopsin; neurotransmitter; suprachiasmatic nucleus.


Figures

Figure 1
Figure 1
Melanopsin and PACAP immunoreactivity is found in inner and outer stratifying RGC’s. A-D. Outer (cell 1) and inner (cell 2) stratifying RGC’s expressing PACAP in magenta (A) and melanopsin identified using both a C-terminal antibody (B, green) and an N-terminal antibody (C, blue) and with the two antibodies shown merged (D). E. Extended view representing the same Z-stack of a total of 55 images of the cells shown in A-D presented in an XY (E), XZ (E1) and ZY (E2) plane to illustrate dendritic stratification. F. The same cells shown in A-E analysed for the localization of the dendritic processes using the Imaris filament tracer module (see Material and Methods). The majority of dendritic processes of cell 2 stratify in the most inner part of the inner plexiform layer (IPL)(magenta,F1-2F2). The dendrites of cell 1 stratify exclusively at the border of the INL/IPL (yellow, F1-2 F2) and its cell body is displaced to the INL (F1-2). Scale bars; 50 μm.
Figure 2
Figure 2
PACAP is found in melanopsin immunoreactive RGC’s of the macaque monkey. A. Melanopsin immunoreactivity(magenta) (visualized using the C-terminal directed anti-melanopsin antibody) shown in a flat-mount preparation of the Macaca mulatta (MM1) retina. The image represents a montage of 4 images each representing a Z-stack of 35 sections covering the depth required to ensure that both inner and outer stratifying melanopsin processes are visible. The melanopsin cells are numbered 1-9. Note the weak staining of two inner stratifying cells (2 and 9). B. PACAP(green) staining of the same piece of retina as shown in A with cells numbered as in A (1-9). Note the low level of PACAP found in cell 9.C.Extended view representing the same Z-stack of a total of 35 images of the cells shown in A-B presented in an XY (C), XZ (C1) and ZY (C2) plane to illustrate dendritic stratification. Melanopsin (magenta) and PACAP (green) co-stored in the same RGCs numbered 1-9. Scale bars: 80 μm. GCL; ganglion cell layer, INL; inner nuclear cell layer.
Figure 3
Figure 3
Melanopsin and PACAP immunoreactivity is found in inner and outer stratifying RGC’s. A. Three RGCs numbered 1-3 expressing both melanopsin (visualized using the N-terminal directed anti-melanopsin antibody) and PACAP, and one RGC stained only for PACAP (arrows), shown in an extended view representing a Z-stack of a total of 50 images presented in an XY (A), XZ (A1) and ZY (A2) plane. Co-localization of melanopsin and PACAP appears yellow. Note the weak expression of both melanopsin and PACAP in cell no. 2. Inner and outer stratifying dendritic processes are shown in the XZ (A1) and YZ (A2) planes. B. Focus is in the inner IPL near the GCL border, showing PACAP (green) and melanopsin (magenta) labelling of cells1 and.2 (same cells as shown in A). Arrow indicates the same PACAP labelled cell indicated by the arrow in A. Nuclei from other ganglion cells are stained with DAPI (blue). C. Focus is in the outer IPL near the INL border showing PACAP (green) and melanopsin (magenta) labelling of cell3 (same cell as shown in A). The cell body is displaced to the inner nuclear layer (INL). Co-localization of melanopsin and PACAP appears yellow. Nuclei from other cells in the INL stained with DAPI (blue). D-E. Extended view of the Z-stack of 50 images from A showing the melanopsin cells before (D) and after (E) being analysed for the localization of dendritic processes using the Imaris filament tracer module (see Materials and Methods). F. Focus as in B after Imaris filament tracer analysis showing cell 1 (yellow) and cell2 (green). The majority of dendrites of cell 1 are located in the most inner part of the IPL. Cell2 expressed low levels of melanopsin and the weakly stained proximal dendrites are also in the inner IPL. The axon of cell3 (magenta) can be seen descending through the IPL towards the GCL. G. Focus as in C after Imaris filament tracer analysis showing the cell body and outer stratifying dendrites of cell3 (magenta). Several dendrites from cell 1 (yellow) can be seen ascending to the outer IPL. H. Summary of the traced cells shown in E-G. Panel H1shows an extended view in the XZ plane and panel H2 shows an extended view in the YZ plane. The dendrites of cell3 are located exclusively in the outer IPL. GCL; ganglion cell layer, INL; inner nuclear layer. Scale bars; 50 μm.
Figure 4
Figure 4
Retinal innervation of the macaque rostral (A-C), rostral-mid (D-F), mid (G-I) and caudal (J-L) SCN. The SCN was identified by immunostaining for VIP (C, F, I, L, blue). Retinal projections were visualized by cholera toxin subunit B immunoreactivity (B, E, H, K, magenta) and the melanopsin projections were demonstrated by staining for PACAP (A, D, G, J, green) Boxed area in G and H are shown at higher magnification in Figure 5. Oc; optic chiasm. Scale bar; 100 μm.
Figure 5
Figure 5
Retinal innervation of the macaque mid and caudal SCN. A-D. Higher magnification view of retinal projections representing the melanopsin ipRGCs in the mid SCN shown in boxed area in Figure 4G H, demonstrating co-localization between cholera toxin subunit B (B; CtB; magenta) and PACAP (A; green) immunoreactivity as visualized in C (yellow)and by white colour representing 100 % overlap in D (calculated using the co-localization plug-in in Fiji). Note the PACAP fibres not co-storing CtB may originate from the contralateral eye and to a minor extent from the brain. E-H. Same area of the caudal SCN shown in Figure 4J-K. Co-localization between PACAP (E; green) and CtB (F; magenta) was very sparse, as visualized in G (yellow) and by the few white dots representing 100 % overlap in H (calculated as in D). Oc; optic chiasm. Scale bars: A-D; 20 μm.
Figure 6
Figure 6
PACAP containing retinal projections innervate the lateral geniculate nucleus(LGN) of the macaque monkey. A-B. Retinal projections visualized by CtB and PACAP immunostaining of the mid ipsilateral (A) and contralateral (B) LGN innervating layers II, III and V on the ipsilateral side and layers I, IV, and VI on the contralateral side (the images in A and B consist of 6×8 tiled images which were stitched together). C-H. High magnification images of the six sublayers on the ipsilateral side taken within the area indicated by the large box in A. Co-localization between PACAP and CtB was determined using the co-localization plug-in in Fiji software (see Materials and Methods) and is shown in white (exemplified by arrows in 6C-P). I.PACAP and CtB colocalization in the ventral lateral area of layer VI indicated by the small box in A shown at a higher magnification. J-O. Images of the six sublayers on the contralateral side taken within the area indicated by the large box in B.P.A higher magnification image from the ventral lateral area of layer VI indicated by the small box in B. Note that autofluorescent cell bodies (exemplified by arrowheads in 6C-P)found throughout the LGN appear as co-localization since they are seen with both filter settings. Scale bars: A-B,200 μm; C-H and J-O,50 μm; I and P, 25μm.
Figure 7
Figure 7
PACAP containing retinal projections innervate the pregeniculate (PrGC) complex of the macaque monkey. A. Retinal projections visualized by CtB immunostaining of rostral contralateral PrGC. The image consists of 3×3 tiled wide field images that were stitched together. B. Same section as in A co-stained for PACAP showing strong immunoreactivity in the PrGC. C-E. Higher magnification images from the area indicated by the asterisks in A and B. F-H. Ultrahigh magnification of the area indicated by the squares in C-E.PACAP is found in retinal and non-retinal projections to the PrGC. Co-localization between CtB and PACAP containing retinal projections is shown in white in E and H (determined using the co-localization module in ImageJ, see Material and Methods). Scale bars: A-B; 100 μm, C-E; 50 μm, F-H; 20 μm.
Figure 8
Figure 8
PACAP containing retinal projections representing the melanopsin ipRGCs innervating the olivary pretectal nucleus (PON).A. Retinal projections visualized by CtB immunostaining in the PON. The image consists of 3×3 tiled confocal images stitched together for better overview. B. Same section as in A co-stained for PACAP showing that PACAP was found in both retinal projections and in cell bodies located within the PON as seen at higher magnification (C-E) and ultrahigh (F-H) magnification representing the area indicated by the square in E. Co-localization between CtB and PACAP containing retinal projections is shown in white (determined using the colocalization module in ImageJ, see Material and Methods). Scale bars: A-B; 100 μm, C-E; 50 μm, F-H; 10 μm.
Figure 9
Figure 9
PACAP containing retinal projections representing the melanopsin ipRGCs innervating the nucleus of the optic tract (NOT).A. Retinal projections visualized by CtB immunostaining in the NOT. The image consists of 4×4 tiled confocal images stitched together for better overview. B. Same section as in A co-stained for PACAP showing that PACAP was found in both retinal and non-retinal projections located within the NOT. C-E. High magnification images of the area indicated by the asterisks in A and B. Co-localization between CtB and PACAP containing retinal projections is shown in white in E (determined using the colocalization module in ImageJ, see Material and Methods). Scale bars: A-B; 200 μm, C-E; 20 μm.
Figure 10
Figure 10
PACAP containing retinal projections representing the melanopsin ipRGCs innervating the brachium of the superior colliculus (BSC).A. Retinal projections visualized by CtB immunostaining in the BSC. The image consists of 3×3 tiled confocal images stitched together for better overview. B-C. Same section as in A co-stained for PACAP (B) and showing that PACAP was found in both retinal and non-retinal projections located within the BSC (C). D-F. Higher magnification images of the area indicated by the boxes in A-C.G-I. Ultrahigh magnification of the area indicated by the asterisks in D-F. Co-localization between CtB and PACAP containing retinal projections is shown in white in C, F, and I (determined using the colocalization module in ImageJ, see Material and Methods). Scale bars: A-C; 100 μm, D-F; 50 μm, G-I; 20 μm.
Figure 11
Figure 11
PACAP containing retinal projections representing the melanopsin ipRGCs innervating the superior colliculus (SC). A-B. Retinal projections visualized by CtB immunostaining in the ipsi and contralateral SC. The image consists of 2×8 tiled confocal images stitched together for better overview. C-D. Same section as in A-B co-stained for PACAP showing that PACAP was found in cell bodies of deeper layers of the SC (indicated by arrows). High magnification demonstrates PACAP in retinal projections of both the ipsi-(E,F,G) and contralateral side (H-M). Co-localization between CtB and PACAP containing retinal projections is shown in white in G, J and M (determined using the colocalization module in ImageJ, see Material and Methods). Scale bars: A D; 500 μm, E-G; 50 μm, H-M; 20 μm.

References

    1. Baver SB, Pickard GE, Sollars PJ, Pickard GE. Two types of melanopsin retinal ganglion cell differentially innervate the hypothalamic suprachiasmatic nucleus and the olivary pretectal nucleus. Eur J Neurosci. 2008;27:1763–1770. - PubMed
    1. Berghorn KA, Bonnett JH, Hoffman GE. cFos immunoreactivity is enhanced with biotin amplification. J Histochem Cytochem. 1994;42:1635–1642. - PubMed
    1. Bergström AL, Hannibal J, Hindersson P, Fahrenkrug J. Light-induced phase shift in the Syrian hamster (Mesocricetus auratus)is attenuated by the PACAP receptor antagonist PACAP6-38 or PACAP immunoneutralization. Eur J Neurosci. 2003;9:2552–2562. - PubMed
    1. Berson DM. Strange vision: ganglion cells as circadian photoreceptors. Trends Neurosci. 2003;26:314–320. - PubMed
    1. Brown TM, Gias C, Hatori M, Keding SR, Semo M, Coffey PJ, Gigg J, Piggins HD, Panda S, Lucas RJ. Melanopsin contributions to irradiance coding in the thalamo-cortical visual system. PLoS Biol. 2010;8:e1000558. - PMC - PubMed

Publication types

MeSH terms