Comparative Study
. 2014 Jul;233(3):281-93.
doi: 10.1002/path.4358. Epub 2014 May 21.

Virus transcript levels and cell growth rates after naturally occurring HPV16 integration events in basal cervical keratinocytes

Affiliations
Comparative Study

Virus transcript levels and cell growth rates after naturally occurring HPV16 integration events in basal cervical keratinocytes

Cinzia G Scarpini et al. J Pathol. 2014 Jul.

Abstract

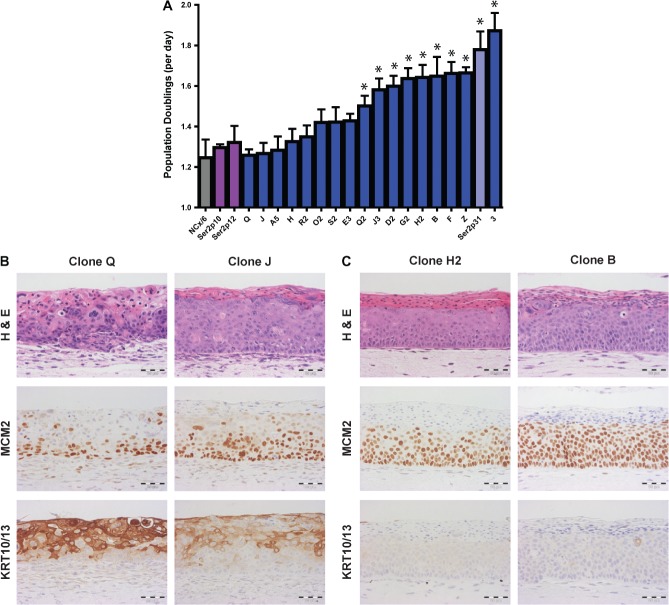
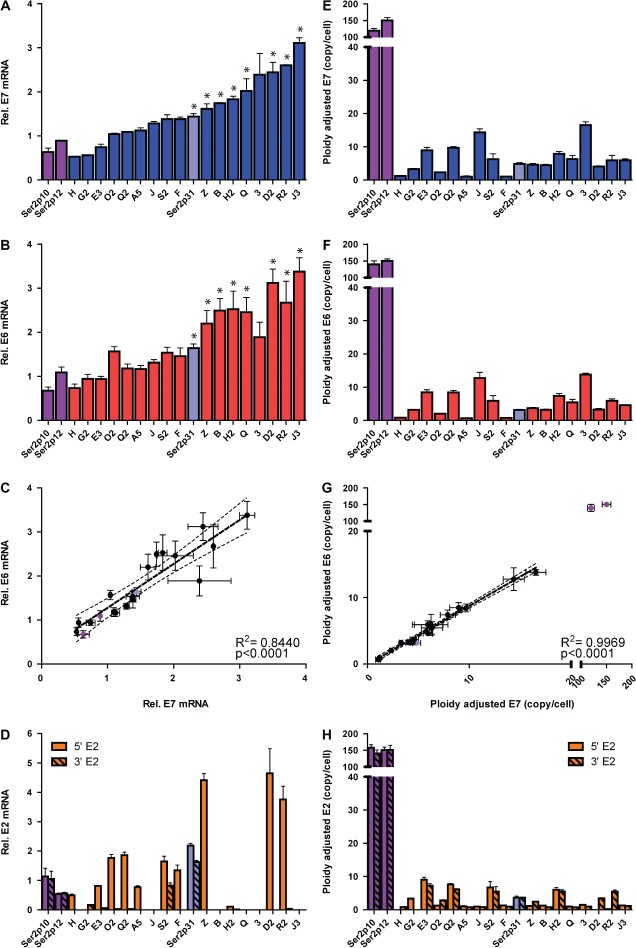
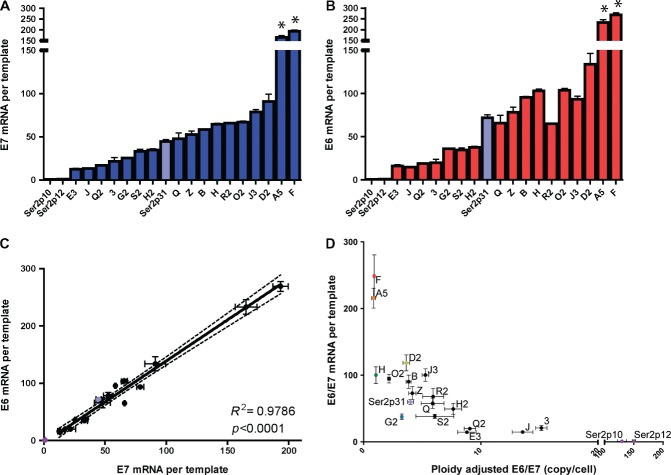
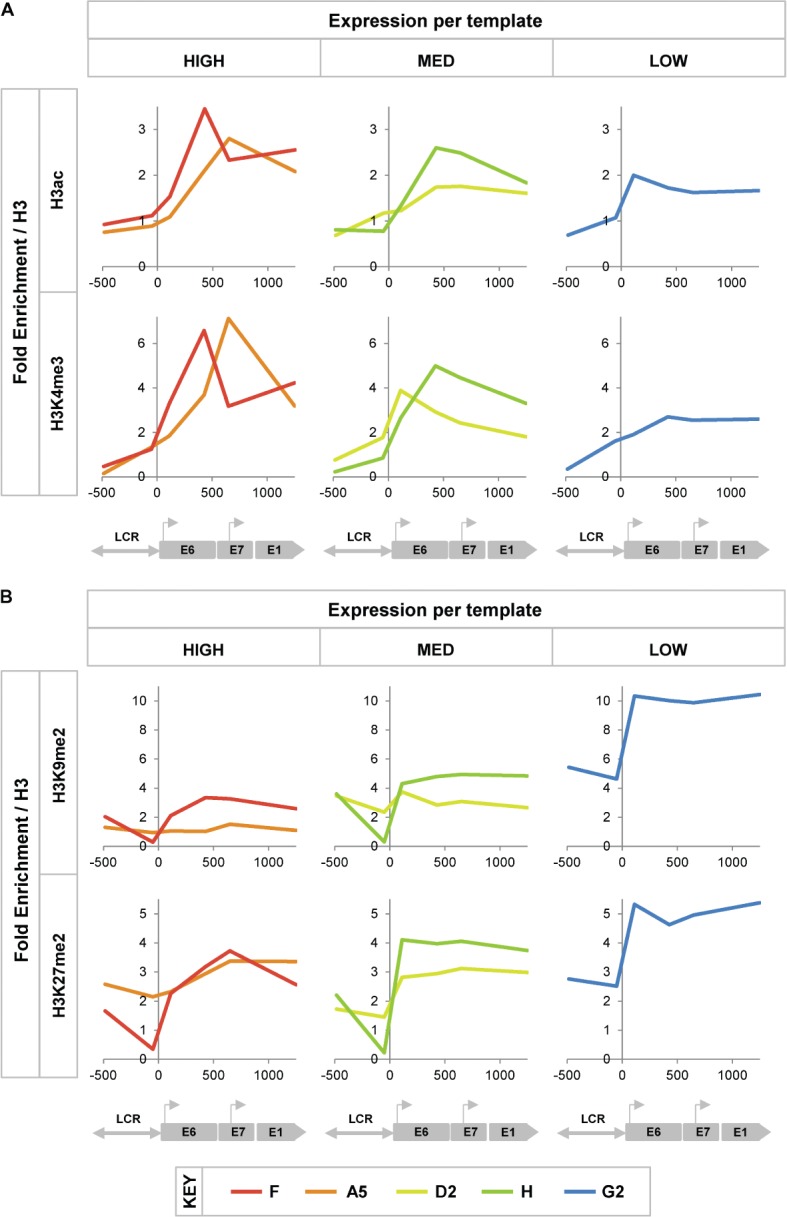
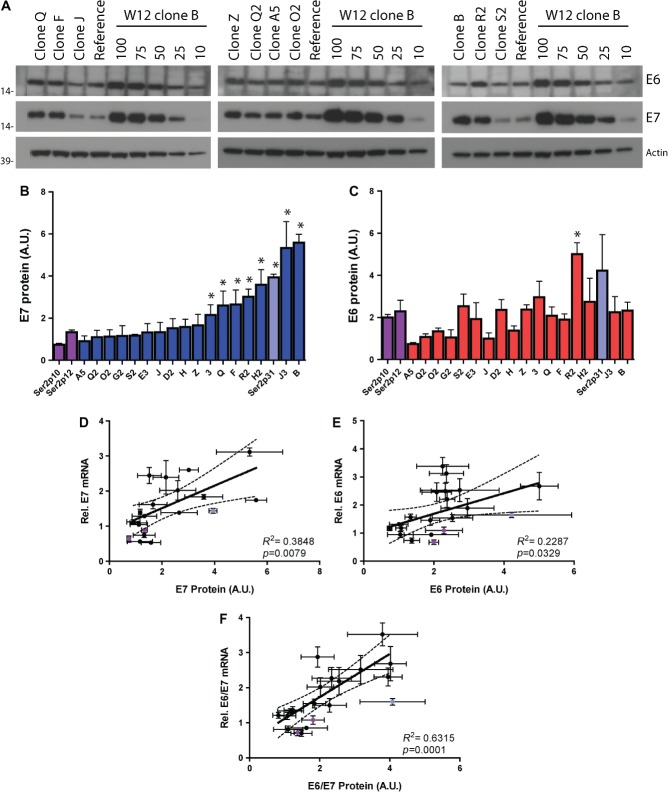
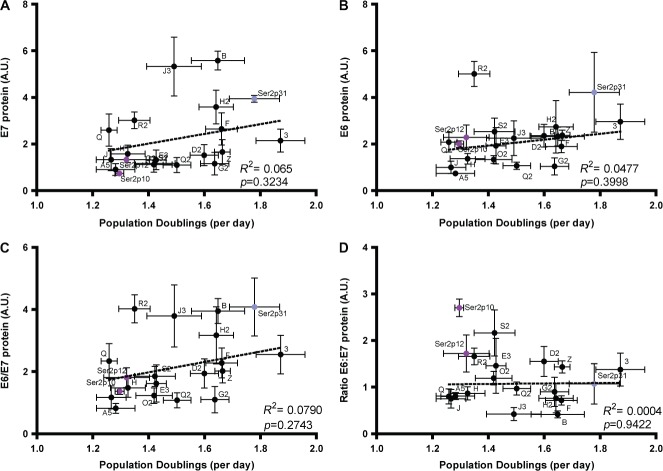
Cervical carcinogenesis is characterized by a clonal selection process in which the high-risk human papillomavirus (HRHPV) genome usually changes from the extra-chromosomal (episomal) state seen in productive infections to DNA that is integrated into host chromosomes. However, it is not clear whether all HRHPV integration events provide cells with a selective growth advantage compared with the episome-containing cells from which they originate. It is also unclear whether selection of cells containing a particular integrant from a mixed population simply reflects the highest levels of virus oncogene expression or has additional determinants. These early events in cervical carcinogenesis cannot readily be addressed by cross-sectional studies of clinical samples. We used the W12 model system to generate a panel of cervical squamous cell clones that were derived from an identical background under non-competitive conditions and differed only by the genomic site of HPV16 integration. Compared with the 'baseline' episome-containing cells from which they were isolated, only 9/17 clones (53%) showed significantly greater growth rates and only 7/17 (41%) showed significantly greater expression of the major virus oncogenes E7/E6. There were significant variations in levels of HPV16 transcription per DNA template, changes that were associated with histone modifications in the integrated virus chromatin. Cell growth rates showed only weak and non-significant associations with protein and mRNA levels for E7, E6, and the mean E7/E6 values. We conclude that HPV16 integration in basal cervical cells does not necessarily lead to increased levels of virus oncogenes, or to a competitive growth advantage, when compared with the initiating episome-containing cells.

Keywords: E6/E7; human papillomavirus; integration; selection.


Figures

Figure 1
Figure 1
Cell growth in monolayer culture and phenotype in organotypic tissue culture. (A) Population doublings per day in W12 clones (blue bars), the spontaneously selected W12Ser2p31 cells (pale blue bar), the initiating episome-containing W12Ser2p10 and W12Ser2p12 cells (purple bars), and NCx/6 (grey bar). Error bars = SEM. An asterisk denotes cells with significantly faster growth than the mean of the W12Ser2p10 and W12Ser2p12 cells (p < 0.01). (B, C) Appearances of the epithelia reformed in organotypic culture by representative W12 clones, for which growth rate in monolayer culture was low (Q and J) or high (H2 and B). Tissue sections were stained by H&E and immunohistochemistry for the cell-cycle marker MCM2 and the squamous cell differentiation markers KRT10/13. Scale bars = 50 µm.
Figure 2
Figure 2
Quantification of virus gene expression and copy number. The charts show levels of expression (left column) and copy number (right column) for HPV16 E7 (panels A, E), total E6 (panels B, F), and E2-5'/E2-3' (panels D, H). Expression levels were referenced to those in W12Ser6p11. Relationships between the E7 and E6 levels are shown in panels C and G, including correlation data for the 17 clones. The pale blue bars/circles show data for the spontaneously selected W12Ser2p31 cells, while the purple bars/circles show data for the initiating episome-containing W12Ser2p10 and W12Ser2p12 cells. Data for the 17 clones are colour-coded by gene (E7: blue bars; E6: red bars; E2: orange bars). In each bar chart, the clones are ordered by increasing levels of E7 transcript per cell (ie the order determined in the analysis shown in panel A). Rel = relative. Error bars = SEM. An asterisk denotes cells where E7 or E6 values were significantly higher than the mean of the W12Ser2p10 and W12Ser2p12 cells (p < 0.01).
Figure 3
Figure 3
Levels of HPV16 gene expression per template. Values are shown for E7 (A) and E6 (B), with correlations between the values for the 17 clones shown in C. The pale blue bars/circles show data for the spontaneously selected W12Ser2p31 cells, while the purple bars/circles show data for the initiating episome-containing W12Ser2p10 and W12Ser2p12 cells. The bars for the 17 clones are colour-coded by gene (E7: blue bars; E6: red bars). In each bar chart, the clones are ordered by increasing levels of E7 expression per template (ie the order determined in the analysis shown in panel A). Error bars = SEM. An asterisk denotes cells where values were significantly higher than the W12Ser2p31 cells (p < 0.01). Panel D shows a plot of mean E6/E7 expression per template versus template copy number per cell. While individual W12 clones are generally represented by black circles, specific colours are used to highlight the clones used for ChIP–qPCR.
Figure 4
Figure 4
Histone modifications in integrated HPV16 chromatin. In each graph, the y-axis shows fold enrichment of histone H3 modifications, referenced to background H3 levels. The x-axis and underlying schematic show the region of the HPV16 genome analysed by qPCR (LCR = long control region). Histone modifications of active chromatin are shown in panel A and modifications of repressed chromatin in panel B. The columns show data for clones in which transcription levels per template were high (left), medium (MED; middle) or low (right).
Figure 5
Figure 5
Expression levels of HPV16 early proteins per cell. Panel A shows western blots for HPV16 E6 and E7 protein expression in representative W12 clones. The reference samples were from independent episome-containing W12Ser6p11 cells. The right-hand five lanes in each blot show the serial dilution of W12 clone B used to generate the standard curve for protein quantification, with the numbers denoting the µg amounts of total protein per lane. The bar charts show protein levels for E7 (B) and E6 (C). The pale blue bars show data for the spontaneously selected W12Ser2p31 cells, while the purple bars show data for the initiating episome-containing W12Ser2p10 and W12Ser2p12 cells. An asterisk denotes cells where values were significantly higher than the mean of the W12Ser2p10 and W12Ser2p12 cells (p < 0.01). Relationships between protein and transcript levels are shown for E7 (D), total E6 (E), and the mean E7/E6 values (F), including correlation data for the 17 clones (black circles). In all panels, error bars = SEM. A.U. = arbitrary units.
Figure 6
Figure 6
Relationships between cell proliferation rates and HPV16 oncoprotein levels. The graphs plot cell growth rate versus protein levels for E7 (A), E6 (B), the mean E6/E7 values (C), and the E6:E7 ratios (D). The correlation data are for the 17 clones (black circles). Results for the W12Ser2p31 cells (pale blue circles) and W12Ser2p10 and W12Ser2p12 cells (purple circles) are also shown. In all panels, error bars = SEM. A.U.; arbitary units.

References

    1. Baldwin P, Laskey R, Coleman N. Translational approaches to improving cervical screening. Nature Rev Cancer. 2003;3:217–226. - PubMed
    1. Wentzensen N, Vinokurova S, von Knebel DoeberitzM. Systematic review of genomic integration sites of human papillomavirus genomes in epithelial dysplasia and invasive cancer of the female lower genital tract. Cancer Res. 2004;64:3878–3884. - PubMed
    1. Jeon S, Allen-Hoffmann BL, Lambert PF. Integration of human papillomavirus type 16 into the human genome correlates with a selective growth advantage of cells. J Virol. 1995;69:2989–2997. - PMC - PubMed
    1. Pett M, Coleman N. Integration of high-risk human papillomavirus: a key event in cervical carcinogenesis? J Pathol. 2007;212:356–367. - PubMed
    1. Middleton K, Peh W, Southern S, et al. Organization of human papillomavirus productive cycle during neoplastic progression provides a basis for selection of diagnostic markers. J Virol. 2003;77:10186–10201. - PMC - PubMed

Publication types

MeSH terms