. 2014 Aug 15;30(16):2272-9.
doi: 10.1093/bioinformatics/btu201. Epub 2014 Apr 20.

Efficient Bayesian inference under the structured coalescent

Affiliations

Efficient Bayesian inference under the structured coalescent

Timothy G Vaughan et al. Bioinformatics. .

Abstract

Motivation: Population structure significantly affects evolutionary dynamics. Such structure may be due to spatial segregation, but may also reflect any other gene-flow-limiting aspect of a model. In combination with the structured coalescent, this fact can be used to inform phylogenetic tree reconstruction, as well as to infer parameters such as migration rates and subpopulation sizes from annotated sequence data. However, conducting Bayesian inference under the structured coalescent is impeded by the difficulty of constructing Markov Chain Monte Carlo (MCMC) sampling algorithms (samplers) capable of efficiently exploring the state space.

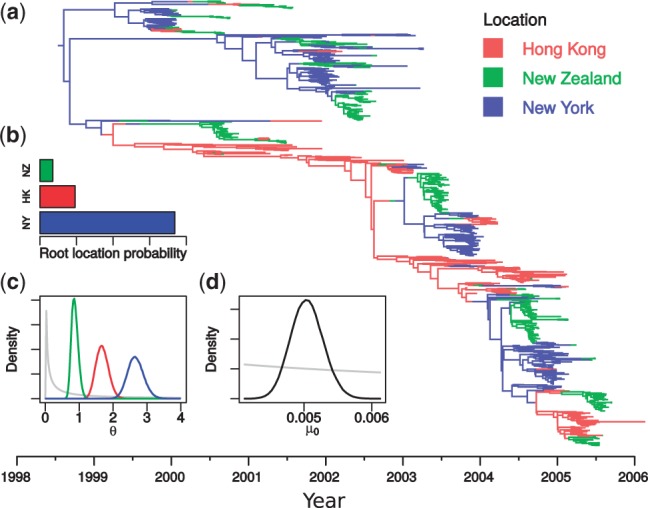
Results: In this article, we present a new MCMC sampler capable of sampling from posterior distributions over structured trees: timed phylogenetic trees in which lineages are associated with the distinct subpopulation in which they lie. The sampler includes a set of MCMC proposal functions that offer significant mixing improvements over a previously published method. Furthermore, its implementation as a BEAST 2 package ensures maximum flexibility with respect to model and prior specification. We demonstrate the usefulness of this new sampler by using it to infer migration rates and effective population sizes of H3N2 influenza between New Zealand, New York and Hong Kong from publicly available hemagglutinin (HA) gene sequences under the structured coalescent.

Availability and implementation: The sampler has been implemented as a publicly available BEAST 2 package that is distributed under version 3 of the GNU General Public License at http://compevol.github.io/MultiTypeTree.


Figures

Fig. 1.
Fig. 1.
A structured tree T=(V,E,t,M) with V=IY where I={x,y,z}, Y={i,j}, E={x,i,y,i,i,j,z,j} and the coalescence times t and type mappings M are as shown. Here we have selected the type set D={blue,red,green,orange}, although this can be composed of the values of any discrete trait
Fig. 2.
Fig. 2.
Schematics illustrating actions of the tree-specific operators used in our structured tree MCMC algorithm, including structured tree implementations of the (a) Wilson–Balding, (b) subtree exchange, (c) node height shift and (d) tree scaling operators. The solid edge shadings represent the deme to which each lineage belongs at each time. Double white lines represent edges for which new type functions will be proposed as part of the move, crosses represent edges to be removed and dashes represent edges that may continue beyond the schematic boundary
Fig. 3.
Fig. 3.
Agreement of (a) tree height and (b) migration count distributions sampled from the structured coalescent distribution using our implementation of the described MCMC algorithm (black lines) with those generated via direct simulation (grey lines). See text for more detail
Fig. 4.
Fig. 4.
ESRs per hour of MCMC calculation recorded from the simulated data analyses using both the new proposal operators and our implementation of those developed by Ewing et al. (2004) (ENR), where θ is the vector of population sizes, m is the immigration rate matrix, μ0 is the clock rate and tr is the age of the root. Values for the vector/matrix parameters θ and m were averaged across all elements
Fig. 5.
Fig. 5.
Summary of results from spatial H3N2 influenza analysis, including (a) the 980 taxon maximum sampled posterior structured tree, the sampled posterior probability distributions for (b) the root location, (c) the subpopulation sizes and (d) the base substitution rate (substitutions/site/year). The grey lines in (c) and (d) show the visible portions of the logN(0,4) prior used for all of these parameters, scaled vertically for clarity

References

    1. Baum LE, et al. A maximization technique occurring in the statistical analysis of probabilistic functions of Markov chains. Ann. Math. Stat. 1970;41:164.
    1. Bedford T, et al. Global migration dynamics underlie evolution and persistence of human influenza A (H3N2) PLoS Pathog. 2010;6:e1000918. - PMC - PubMed
    1. Beerli P. Comparison of Bayesian and maximum-likelihood inference of population genetic parameters. Bioinformatics. 2006;22:341–345. - PubMed
    1. Beerli P, Felsenstein J. Maximum-likelihood estimation of migration rates and effective population numbers in two populations using a coalescent approach. Genetics. 1999;152:763–773. - PMC - PubMed
    1. Beerli P, Felsenstein J. Maximum likelihood estimation of a migration matrix and effective population sizes in n subpopulations by using a coalescent approach. Proc. Natl Acad. Sci. USA. 2001;98:4563–4568. - PMC - PubMed

Publication types