. 2014 May 13;111(19):E2056-65.
doi: 10.1073/pnas.1316824111. Epub 2014 Apr 21.

Visuospatial selective attention in chickens

Affiliations

Visuospatial selective attention in chickens

Devarajan Sridharan et al. Proc Natl Acad Sci U S A. .

Abstract

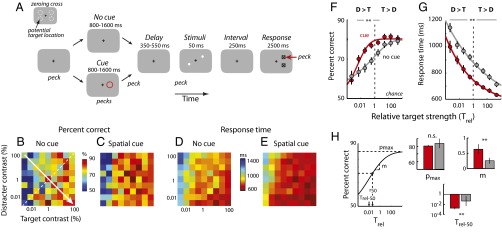
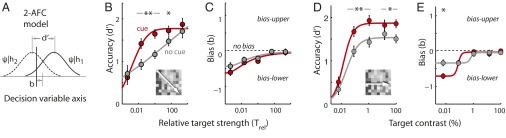
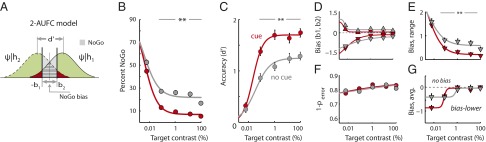
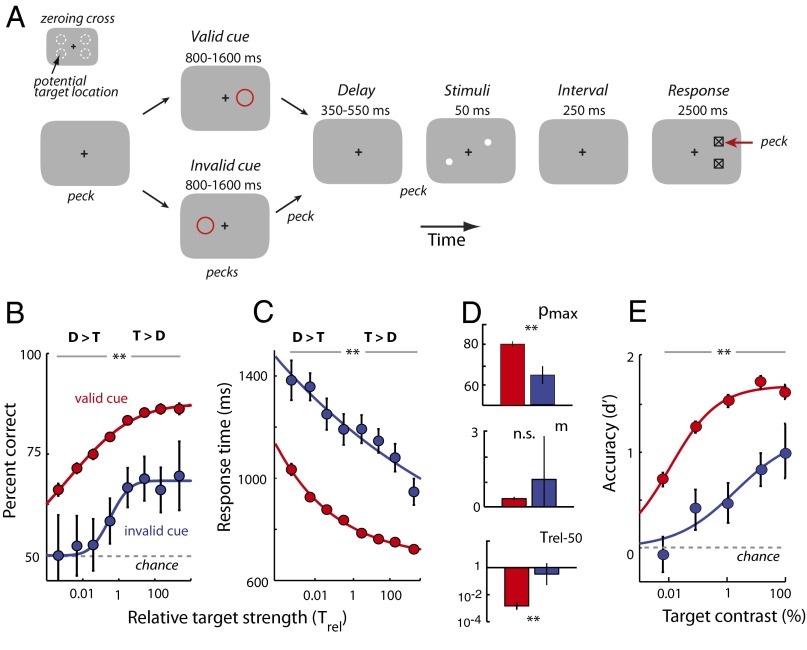
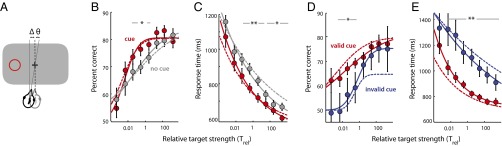
Voluntary control of attention promotes intelligent, adaptive behaviors by enabling the selective processing of information that is most relevant for making decisions. Despite extensive research on attention in primates, the capacity for selective attention in nonprimate species has never been quantified. Here we demonstrate selective attention in chickens by applying protocols that have been used to characterize visual spatial attention in primates. Chickens were trained to localize and report the vertical position of a target in the presence of task-relevant distracters. A spatial cue, the location of which varied across individual trials, indicated the horizontal, but not vertical, position of the upcoming target. Spatial cueing improved localization performance: accuracy (d') increased and reaction times decreased in a space-specific manner. Distracters severely impaired perceptual performance, and this impairment was greatly reduced by spatial cueing. Signal detection analysis with an "indecision" model demonstrated that spatial cueing significantly increased choice certainty in localizing targets. By contrast, error-aversion certainty (certainty of not making an error) remained essentially constant across cueing protocols, target contrasts, and individuals. The results show that chickens shift spatial attention rapidly and dynamically, following principles of stimulus selection that closely parallel those documented in primates. The findings suggest that the mechanisms that control attention have been conserved through evolution, and establish chickens--a highly visual species that is easily trained and amenable to cutting-edge experimental technologies--as an attractive model for linking behavior to neural mechanisms of selective attention.

Keywords: avian vision; competitive selection; executive functions; top-down control; voluntary attention.


Conflict of interest statement

The authors declare no conflict of interest.

Figures

Fig. 1.
Fig. 1.
Top-down spatial cueing improves target localization in a filtering task. (A) The sequence of events in a target localization task with a task-relevant distracter and interleaved spatial cues (see Target Localization in the Presence of a Task-Relevant Distracter for description). The black + is the zeroing cross, the red circle is the cue, white dots are the target and distracter, squares with an inlaid X are the response boxes, and the red arrow is the peck to the response box. (Inset) Dashed circles are the potential target locations (not actually presented on the screen). (B) Percent correct as a function of distracter and target strengths (contrasts) for localization performance without a cue (n = 199 experimental sessions in three birds). Target and distracter contrasts were randomly and independently sampled from one of nine values (0.0033–100%, uniformly spaced on a logarithmic scale). Hotter colors indicate higher percent correct. The dashed white line is the line of equal target and distracter strengths. The arrow indicates the axis of increasing relative target strengths. (C) Same as in B, but with a spatial cue. (D) Response times as a function of distracter and target strengths for correctly localized targets, without a cue. Hotter colors indicate shorter (faster) response times. Other conventions are as in A. (E) Same as in D, but with a spatial cue. (F) Psychometric functions of percent correct, without and with a spatial cue, as a function of relative target strength (Trel, defined as the target-to-distracter contrast ratio). The strength of the target relative to that of the distracter, plotted on a logarithmic scale, increases from left to right (direction of the arrow in B). Gray data represent uncued performance and red data represent cued performance. The dashed vertical line represents equal target and distracter strengths (Trel = 1). Curves represent cumulative Gaussian fits. Error bars represent SEM (jack-knife). (G) Psychometric functions of response times without and with a spatial cue, for correctly localized targets, as a function of relative target strength (population data). Lines represent power law fits (Pieron’s law). Other conventions are the same as in F. (H, Left) Schematic showing parameters estimated from cumulative Gaussian fits to psychometric functions of percent correct (shown in F). pmax is the asymptotic performance, m is the slope, Trel-50 is the value of Trel at which performance reached half of its maximum value (above chance), r50 is the value of Trel at which performance reached half of its range. (H, Right) pmax, m, and Trel-50 estimates from psychometric functions of uncued (gray) and cued (red) performance. Error bars represent SEM (jack-knife). (FH) Significant differences are indicated by a double asterisk (**P < 0.01 level, bootstrap test with Bonferroni correction for multiple comparisons); n.s., not significant.
Fig. 2.
Fig. 2.
Spatial cueing effects on perceptual localization accuracy (d′) and bias (b). (A) A 2-AFC signal detection model incorporating bias. The solid line is the decision variable (ψ) distribution for a stimulus at the upper location (location 1, ψ|h1). The dashed line is the ψ distribution for a stimulus at the lower location (location 2, ψ|h2). As with conventional SDT, the distributions are assumed to be unit normal (Gaussian with unit variance). Localization accuracy, d′, the distance between the means of the two distributions, measures their mutual overlap. Bias, b, represents a criterion (cutoff value for the decision variable) based on which the animal decides to report an upper (ψ > b) vs. lower (ψ < b) target. (B) Psychometric functions of localization accuracy (d′) as a function of relative target strength for performance without (gray) and with (red) the cue (population data). Data averaged across equivalent target-to-distracter contrast ratios (diagonal entries of the performance matrix, Fig. 1 B and C). (Inset) The arrow indicates the axis of increasing Trel. Curves represent cumulative Gaussian fits. Other conventions are the same as in Fig. 1F. (C) Bias, b, as a function of relative target strength without (gray) and with (red) the cue. Positive values indicate a bias toward the upper response boxes and negative values toward the lower. Curves represent sigmoid fits. Other conventions are the same as in B. (D) Psychometric functions of localization accuracy (d′) as a function of absolute target contrast for performance without (gray) and with (red) the cue. Data averaged across distracter contrasts (columns of the performance matrix, Fig. 1 B and C). (Inset) The arrow indicates the axis of increasing target contrast. Curves represent Naka–Rushton fits. Other conventions are the same as in B. (E) Bias, b, as a function of absolute target contrast without (gray) and with (red) the cue. Other conventions are the same as in C and D. (BE) Significant differences are indicated by a single asterisk (*P < 0.05) or double asterisk (**P < 0.01 level, bootstrap test with Bonferroni correction for multiple comparisons).
Fig. 3.
Fig. 3.
Spatial cueing improves choice certainty. (A) A 2-AUFC signal detection model incorporating NoGo (opt-out) responses. A key difference from the 2-AFC model (Fig. 2A) is that the animal employs two criterion values (biases, b1 and b2) to make a decision in one of three ways: reporting an upper target (ψ > b2), lower target (ψ < −b1), or for giving a NoGo response (−b1 ≤ ψ ≤ b2). Other conventions are as in Fig. 2A. Red shading represents the probability of an incorrect Go response (error), green shading (including area overlaid by red) represents the probability of a correct response (hit), gray shading represents the probability of a NoGo response (miss), and the hatched area represents the region of overlap for the two distributions. (B) Proportion of NoGo responses without (gray) and with (red) the cue, as a function of target contrast (averaged across distracter contrasts). (C) Psychometric functions of localization accuracy, d′, for performance without (gray) and with (red) the cue, computed with the 2-AUFC signal detection model. Other conventions are as in Fig. 2D. (D) Biases, b1 and b2, as a function of target contrast for performance without (gray) and with (red) the cue, computed with the 2-AUFC signal detection model. Other conventions are the same as in Fig. 2E. The negative of b2 is plotted so that a larger magnitude of b2 corresponds to more negative values. (E) Bias range (or NoGo bias, |b1| + |b2|) as a function of target contrast for performance without (gray) and with (red) the cue. (F) Error-aversion certainty, the certainty of avoiding an error (1 − Perror; area of red shaded region in A), as a function of target contrast for performance without (gray) and with (red) the cue. (G) Median bias (average of b1 and −b2) as a function of target contrast for performance without (gray) and with (red) the cue. Other conventions are the same as in Fig. 2E.
Fig. 4.
Fig. 4.
Spatial cueing effects are stronger with invalid cueing. (A) Sequence of events in a task with interleaved invalid (10%) and valid (90%) spatial cues (see Effects of Invalid Cueing for description). Other conventions are the same as in Fig. 1A. (B) Psychometric functions of percent correct with valid (red) and invalid (blue) cues, as a function of relative target strength (Trel) (n = 211 experimental sessions in four birds). Other conventions are the same as in Fig. 1F. (C) Psychometric functions of response times for correctly localized targets as a function of relative target strength with valid (red) and invalid (blue) cues (population data). Other conventions are the same as in Fig. 1G. (D) pmax, m, and Trel-50 estimates based on cumulative Gaussian fits to psychometric functions of percent correct, for performance with valid (red) and invalid (blue) cues. Other conventions are the same as in Fig. 1H. (E) Psychometric functions of perceptual localization accuracy (d′) with valid (red) and invalid (blue) cues, as a function of absolute target contrast (averaged over distracter contrasts), computed with the 2-AFC signal detection model (population data). Other conventions are the same as in Fig. 2D.
Fig. 5.
Fig. 5.
Cueing effects persist after controlling for head position biases. (A) Head position and orientation were monitored for each bird on each trial. Lateral displacement (Δ) and yaw (θ) of the head relative to the vertical plane perpendicular to the display and passing through the zeroing cross. The red annulus represents the side of the cue. (B) Psychometric functions of percent correct without (gray) or with (red) the spatial cue, as a function of relative target strength, after excluding trials in which the head was in a biased position (population data). Solid lines are the cumulative Gaussian fits. Dashed lines are the fits based on the entire dataset (repeated from Fig. 1F). Other conventions are the same as in Fig. 1F. (C) Same as in B, but for response times. Other conventions are as in Fig. 1G. (D) Same as in B, but for percent correct with valid (red) and invalid (blue) cueing. Other conventions are as in Fig. 4B. (E) Same as in D, but for response times. Other conventions are as in Fig. 4C.

References

    1. Reynolds J. Three hundred million years of attentional selection. Neuron. 2008;60(4):528–530. - PubMed
    1. Posner MI. Orienting of attention. Q J Exp Psychol. 1980;32(1):3–25. - PubMed
    1. Carrasco M. Visual attention: The past 25 years. Vision Res. 2011;51(13):1484–1525. - PMC - PubMed
    1. Reynolds GS. Attention in the pigeon. J Exp Anal Behav. 1961;4:203–208. - PMC - PubMed
    1. MacKintosh NJ. Selective attention in animal discrimination learning. Psychol Bull. 1965;64:124–150. - PubMed

Publication types

LinkOut - more resources