

Period life tables for the non-Hispanic American Indian and Alaska Native population, 2007-2009
- PMID: 24754553
- PMCID: PMC4035861
- DOI: 10.2105/AJPH.2013.301635
Period life tables for the non-Hispanic American Indian and Alaska Native population, 2007-2009
Abstract
Objectives: We estimated complete period life tables for the non-Hispanic American Indian and Alaska Native (AI/AN) population residing in Contract Health Service Delivery Area (CHSDA) counties for the period 2007-2009.
Methods: We used National Vital Statistics System mortality data files for years 2007-2009 corrected for AI/AN misclassification on death certificates, midyear 2008 revised census bridged race intercensal population estimates, and National Vital Statistics System birth data for years 2006-2009. We used the same methodology as that used to estimate official US annual life tables, with some minor modifications.
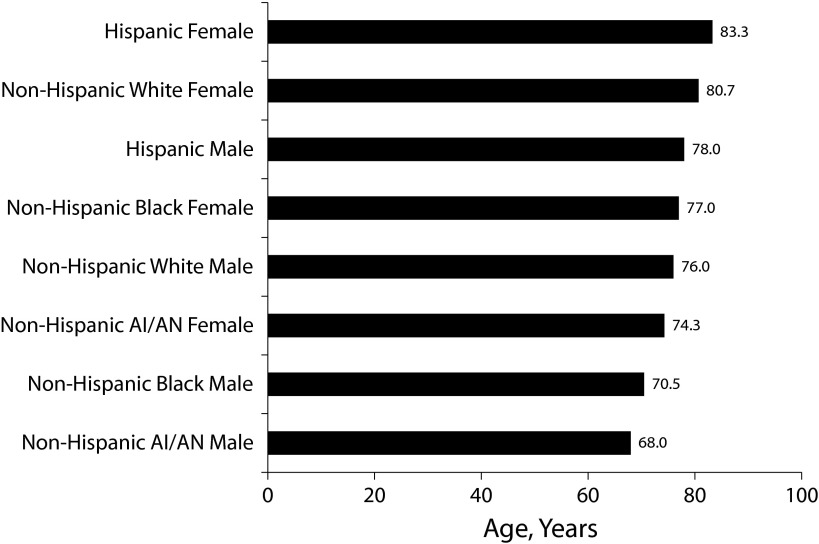
Results: For the period 2007-2009, the non-Hispanic AI/AN population in CHSDA counties had the lowest life expectancy at birth (71.1 years) of any racial/ethnic group for which official US life tables are estimated. By comparison, in 2008, life expectancy at birth was 73.9 years for the non-Hispanic Black population, 78.4 years for the non-Hispanic White population, and 80.8 years for the Hispanic population.
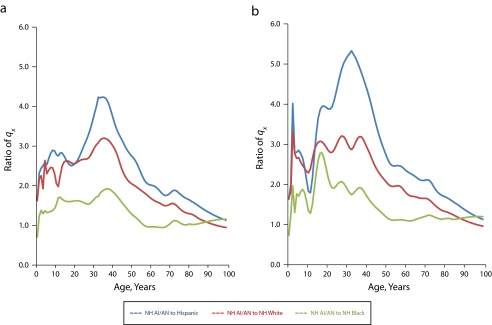
Conclusions: The life tables showed a clear mortality disadvantage for the non-Hispanic AI/AN population in CHSDA counties relative to other national populations. The findings suggested that further research is necessary to explore the causes behind these disadvantages.
Figures
References
-
- Arias E. United States life tables, 2008. Natl Vital Stat Rep. 2012;61(3):1–64. - PubMed
-
- Arias E. United States life tables by Hispanic origin. Vital Health Stat. 2010;2(152):1–33. - PubMed
-
- Arias E, Schauman WS, Eschbach K et al. The validity of race and Hispanic origin reporting on death certificates in the United States. Vital Health Stat. 2008;2(148):1–23. - PubMed
-
- Preston SH, Elo IT, Steward Q. Effects of age misreporting on mortality estimates at older ages. Popul Stud (Camb) 1999;53(2):165–177.
-
- Anderson RN. A method for constructing complete annual US life tables. Vital Health Stat. 2000;2(129):1–28. - PubMed
MeSH terms
LinkOut - more resources
Full Text Sources
Other Literature Sources
