. 2014 Jul;15(7):712-25.
doi: 10.1016/j.jpain.2014.04.001. Epub 2014 Apr 19.

Toll-like receptor 4 signaling contributes to Paclitaxel-induced peripheral neuropathy

Affiliations

Toll-like receptor 4 signaling contributes to Paclitaxel-induced peripheral neuropathy

Yan Li et al. J Pain. 2014 Jul.

Abstract

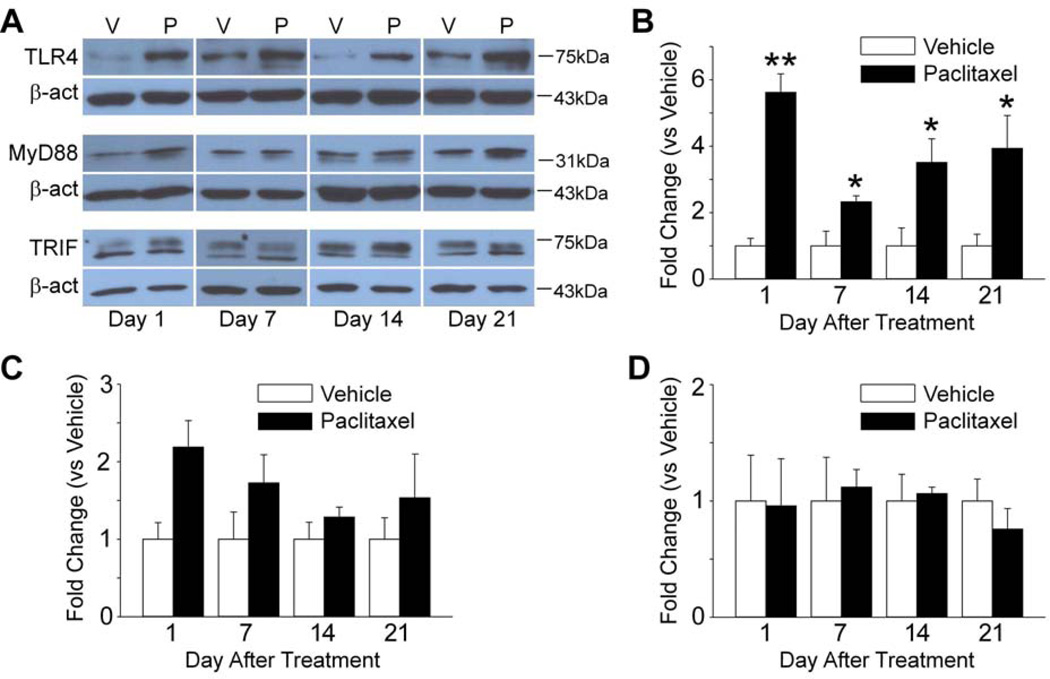
This paper tests the contribution of the toll-like receptors, TLR4 in particular, in the initiation and maintenance of paclitaxel-related chemotherapy-induced peripheral neuropathy. TLR4 and its immediate downstream signaling molecules-myeloid differentiation primary response gene 88 (MyD88) and toll/interleukin 1 receptor domain-containing adapter-inducing interferon-β (TRIF)-were found to be increased in the dorsal root ganglion (DRG) using Western blot by day 7 of paclitaxel treatment. The behavioral phenotype, the increase of both TLR4 and MyD88, was blocked by cotreatment with the TLR4 antagonist lipopolysaccharide-Rhodobacter sphaeroides during chemotherapy. A similar, but less robust, behavioral effect was observed using intrathecal treatment of MyD88 homodimerization inhibitory peptide. DRG levels of TLR4 and MyD88 reduced over the next 2 weeks, whereas these levels remained increased in spinal cord through day 21 following chemotherapy. Immunohistochemical analysis revealed TLR4 expression in both calcitonin gene-related peptide-positive and isolectin B4-positive small DRG neurons. MyD88 was only found in calcitonin gene-related peptide-positive neurons, and TRIF was found in both calcitonin gene-related peptide-positive and isolectin B4-positive small DRG neurons as well as in medium- and large-size DRG neurons. In the spinal cord, TLR4 was only found colocalized to astrocytes but not with either microglia or neurons. Intrathecal treatment with the TLR4 antagonist lipopolysaccharide-R. sphaeroides transiently reversed preestablished chemotherapy-induced peripheral neuropathy mechanical hypersensitivity. These results strongly implicate TLR4 signaling in the DRG and the spinal cord in the induction and maintenance of paclitaxel-related chemotherapy-induced peripheral neuropathy.

Perspective: The toll-like receptor TLR4 and MyD88 signaling pathway could be a new potential therapeutic target in paclitaxel-induced painful neuropathy.

Keywords: DRG; LPS-RS; MyD88; Neuropathy; TLR4; TRIF; spinal cord.


Conflict of interest statement

Disclosures

The authors declare no conflict of interest.

Figures

Figure 1
Figure 1
TLR4, MyD88 and TRIF are increased in the DRG in paclitaxel CIPN. The scatter and line plot in A shows the mean (and standard error) mechanical withdrawal threshold (in grams) for vehicle (n=16) (open circles) and paclitaxel treated rats (n=16) (filled circles). A decrease in withdrawal threshold was observed at day 1 after chemotherapy that became more pronounced and significantly different from that in the vehicle treated group by day 7. Withdrawal threshold remained significant lower than in the vehicle group over the remainder of the time frame observed. The representative western blot images shown in B and C and D illustrate that the expression of TLR4 (B) and MyD88 (C) was increased by day 1 of chemotherapy, while TRIF (D) was increased at day 7 in the DRG, but then fell back to the baseline level by two weeks after treatment and then remained at this level over the time frame observed. The bar graphs summarize the grouped data and indicate that the level of expression of TLR4 (B), MyD88 (C) and TRIF (D) in the DRG was significantly increased in the paclitaxel treated rats (filled bars) compared to the vehicle treated rats (open bars). N = 3 for each group in B through D. β-act = beta-actin, V = vehicle, P = paclitaxel, ** = p < 0.01, *** = P < 0.001. (F=14.38 (4, 127) in A).
Figure 2
Figure 2
TLR4 but not MyD88 or TRIF are increased in the L5 spinal dorsal horn in paclitaxel CIPN. The representative western blot images shown in A illustrate that the expression of TLR4 in the spinal cord was increased by day 1 of chemotherapy, decreased some by day 7 but then showed increasing expression at days 14 and 21. The representative western blots shown in A also illustrate that the expression of MyD88 and TRIF did not change over the time frame observed. The bar graphs summarize the grouped data and indicate that the level of expression of TLR4 (B) in the spinal cord was significantly increased in the paclitaxel treated rats (filled bars) compared to the vehicle treated rats (open bars) but the expression on MyD88 (C) and TRIF (D) were not significantly increased. N = 3 for each group. β-act = beta-actin, V = vehicle, P = paclitaxel, ** = p < 0.01, *** = P < 0.001.
Figure 3
Figure 3
TLR 4 is increased and co-localized to subsets of DRG neurons following paclitaxel chemotherapy. The representative immunohistochemistry images in the top line shows that the expression of TLR4 (red) in the DRG is normally quite low in vehicle-treated rats (A) and in naive rats (data not shown) but becomes quite pronounced by day 7 following paclitaxel treatment (B). The bar graphs inset in A shows that the TLR4+ neurons are predominantly small size with a diameter less that 30 µm. Double immunohistochemistry shown in the second line indicate that TLR4 expression (red) is found in subsets of CGRP positive (blue) neurons (C, co-localization indicated by purple, arrow indicated) as well as in IB4 positive (green) neurons (D, co17 localization indicated by yellow arrow indicated). The merged image in E and the bar graph shown F indicate that TLR4 was expressed in a larger percentage of IB4 positive neurons than CGRP positive neurons as well as in a substantial proportion of DRG neurons that were neither IB4 nor CGRP positive. The bar graphs also illustrate that there was no change in the proportions of IB4+, CGRP+, or the combinations of DRG neurons following paclitaxel treatment. Scale bar= 100 µm. *** = P < 0.001. (F=14.69 (2, 48).
Figure 4
Figure 4
MyD88 is increased and co-localized to subsets of DRG neurons following paclitaxel chemotherapy. The representative immunohistochemistry images in the top line shows that the expression of MyD88 (red) in the DRG is normally quite low in vehicle-treated rats (A) and in naive rats (data not shown) but becomes quite pronounced by day 7 following paclitaxel treatment (B). Double immunohistochemistry shown in the second line indicate that MyD88 expression (red) is found in subsets of CGRP positive (blue) neurons (C, co-localization indicated by purple, arrow indicated) but without in IB4 positive (green) neurons (D, co-localization in yellow). Scale bar= 100 µm. * = p < 0.05, ** = P < 0.01.
Figure 5
Figure 5
TRIF is increased and co-localized to subsets of DRG neurons following paclitaxel chemotherapy. The representative immunohistochemistry images in the top line shows that the expression of TRIF (red) in the DRG is normally quite low in vehicle-treated rats (A) and in naive rats (data not shown) but becomes quite pronounced by day 7 following paclitaxel treatment (B). The bar graphs inset in A shows that TRIF+ neurons are in large, medium and small size neurons. Double immunohistochemistry shown in the second line indicates that TRIF expression (red) is found in subsets of CGRP positive (blue) neurons (C, co-localization indicated by purple, arrow indicated) as well as in IB4 positive (green) neurons (D, co-localization indicated by yellow, arrow indicated). The merged image in E and the bar graph shown F indicates that TRIF was expressed in a substantial proportion of DRG neurons that were neither IB4 nor CGRP positive. Scale bar= 100 µm. (F=1.65 (2, 30) for F).
Figure 6
Figure 6
Spinal cord expression of TLR4 is increased in astrocytes but not microglia or neurons in paclitaxel-treated rats. TLR4 staining is relatively low in the spinal dorsal horn in vehicle treated rats (A) but becomes quite prominent at day 7 following paclitaxel treatments (B). Double immunohistochemistry reveals that TLR4 co-localizes to GFAP positive cells (C and higher magnification in D, arrow indicated) but is not found to co-localize with NeuN positive (E and F) or OX42 positive (G and H). Scale bar in A, B, C, E and G is 100 µm and in D, F and H is 50 µm.
Figure 7
Figure 7
Reversal and prevention of paclitaxel-induced neuropathic pain by intrathecal injection of a TLR4 antagonist (LPS-RS) and MyD88 homodimerization inhibitory peptide (MIP). After a baseline (BL) behavioral test, rats received intraperitoneal injection of paclitaxel (P) or vehicle (V). In panel A, the rats were also treated every 12 hours with 20 µg TLR4 antagonist (LPS-RS) or PBS beginning 2 days before and continuing to 2 days after paclitaxel or vehicle treatment. The paclitaxel- LPS-RS group (n=8) rats showed a significant partial prevention of mechanical hypersensitivity compared with the paclitaxel-PBS group rats (n=8) (A). Vehicle-treated rats receiving i.t PBS (n=5) or LPS-RS (n=5) showed no changes from the baseline measures (A). In B and C paclitaxel-induced mechanical hypersensitivity was confirmed at 14 days after treatment and then rats were treated with 20 µg of the TLR4 antagonist LPS-RS (n=7) or PBS (n=4) (i.t., B) or 500 µM MyD88 inhibitor peptide (n=8) (MIP, C) or 500 µM MyD88 control peptide (n=8) (CP, C). LPS-RS (black circles) transiently reversed the mechanical hyper-responsiveness with peak effect at 3h (B). Similarly, MIP (black circles) reversed mechanical hyper-responsiveness with a peak effects at 3 hours, but the duration in effect was sorter as mechanical withdrawal threshold returned to baseline by 6 hours after injection (C). No significant difference was observed in the rotarod test of the rats between MIP group 500 µM (n=4) and CP 500 µM group (n=4) (D). (*=p < 0.05; **=p < 0.01; ***=p < 0.001; two-way ANOVA followed by Bonferroni post hoc test). Asterisks indicate significant differences between the paclitaxel-LPS-RS groups and paclitaxel-MIP groups versus the paclitaxel-PBS and paclitaxel-CP groups. Crosses indicate significant decrease in mechanical withdrawal threshold in paclitaxel treated groups to baseline measures (+++ and ***= p < 0.001; ** = p < 0.01, * = p < 0.05). (F=4.98 (12, 115), 4.18 (7, 72), 8.84 (21, 176) and 0.01 (1, 12) for A, B, C and D, respectively). The representative photographs shows a low power view of the DRG (Fig. 7E) and high power view of some two DRG neurons (Fig. 7F) showing that Alexa488- labeled oligonucleotide reached the L5 DRG and was found in neurons 3 days following i.t. injection by lumbar puncture (20 µl). Scale bar in E and F is 100 µm and 10 µm.
Figure 8
Figure 8
The increase of MyD88, but not TRIF is prevented in the DRG in paclitaxel CIPN under LPS-RS treatment. The representative western blot images shown in A illustrate that the increasing expression of MyD88 in the DRG was blocked by day 7 of LPS-RS. The representative western blots shown in B illustrate that the expression of TRIF did not change. The bar graphs summarize the grouped data and indicate that the level of expression of MyD88 (A) and TRIF (B) in the DRG in the paclitaxel-LPS-RS treated rats (filled bars) compared to the paclitaxel-PBS treated rats (open bars). N = 3 for each group. β-act = beta-actin, P = paclitaxel-PBS, L = paclitaxel-LPS-RS, ** = p < 0.01.

References

    1. Asehnoune K, Strassheim D, Mitra S, Kim JY, Abraham E. Involvement of reactive oxygen species in Toll-like receptor 4-dependent activation of NF-kappa B. J Immunol. 2004 Feb 15;172:2522–2529. - PubMed
    1. Balosso S, Liu J, Bianchi ME, Vezzani A. Disulfide-Containing High Mobility Group Box-1 Promotes N-Methyl-d-Aspartate Receptor Function and Excitotoxicity by Activating Toll-Like Receptor 4-Dependent Signaling in Hippocampal Neurons. Antioxid Redox Signal. 2014 Jan 3; - PubMed
    1. Basu S, Sodhi A. Increased release of interleukin-1 and tumour necrosis factor by interleukin-2-induced lymphokine-activated killer cells in the presence of cisplatin and FK-565. Immunol Cell Biol. 1992;70(Pt 1):15–24. - PubMed
    1. Beattie EC, Stellwagen D, Morishita W, Bresnahan JC, Ha BK, von Zastrow M, Beattie MS, Malenka RC. Control of synaptic strength by glial TNFa. Science. 2002;295:2282–2285. - PubMed
    1. Beggs S, Salter MW. Stereological and somatotopic analysis of the spinal microglial response to peripheral nerve injury. Brain Behav Immun. 2007;21:624–633. - PMC - PubMed

Publication types

MeSH terms