. 2014 Jun;165(2):791-809.
doi: 10.1104/pp.114.239665. Epub 2014 Apr 22.

Contrasting Roles of the Apoplastic Aspartyl Protease APOPLASTIC, ENHANCED DISEASE SUSCEPTIBILITY1-DEPENDENT1 and LEGUME LECTIN-LIKE PROTEIN1 in Arabidopsis Systemic Acquired Resistance

Affiliations

Contrasting Roles of the Apoplastic Aspartyl Protease APOPLASTIC, ENHANCED DISEASE SUSCEPTIBILITY1-DEPENDENT1 and LEGUME LECTIN-LIKE PROTEIN1 in Arabidopsis Systemic Acquired Resistance

Heiko H Breitenbach et al. Plant Physiol. 2014 Jun.

Abstract

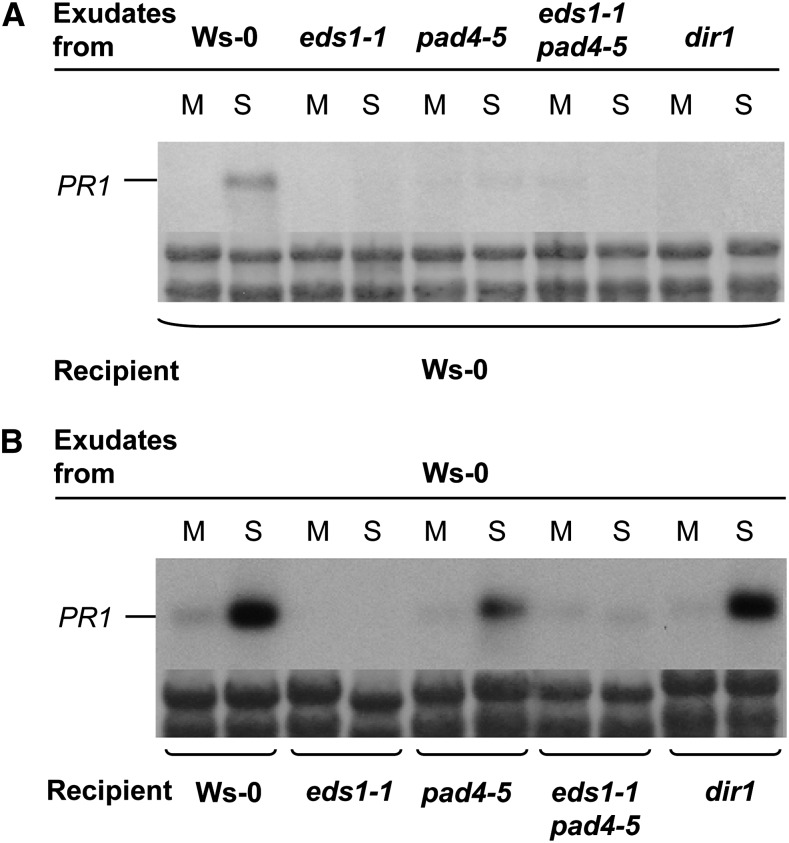
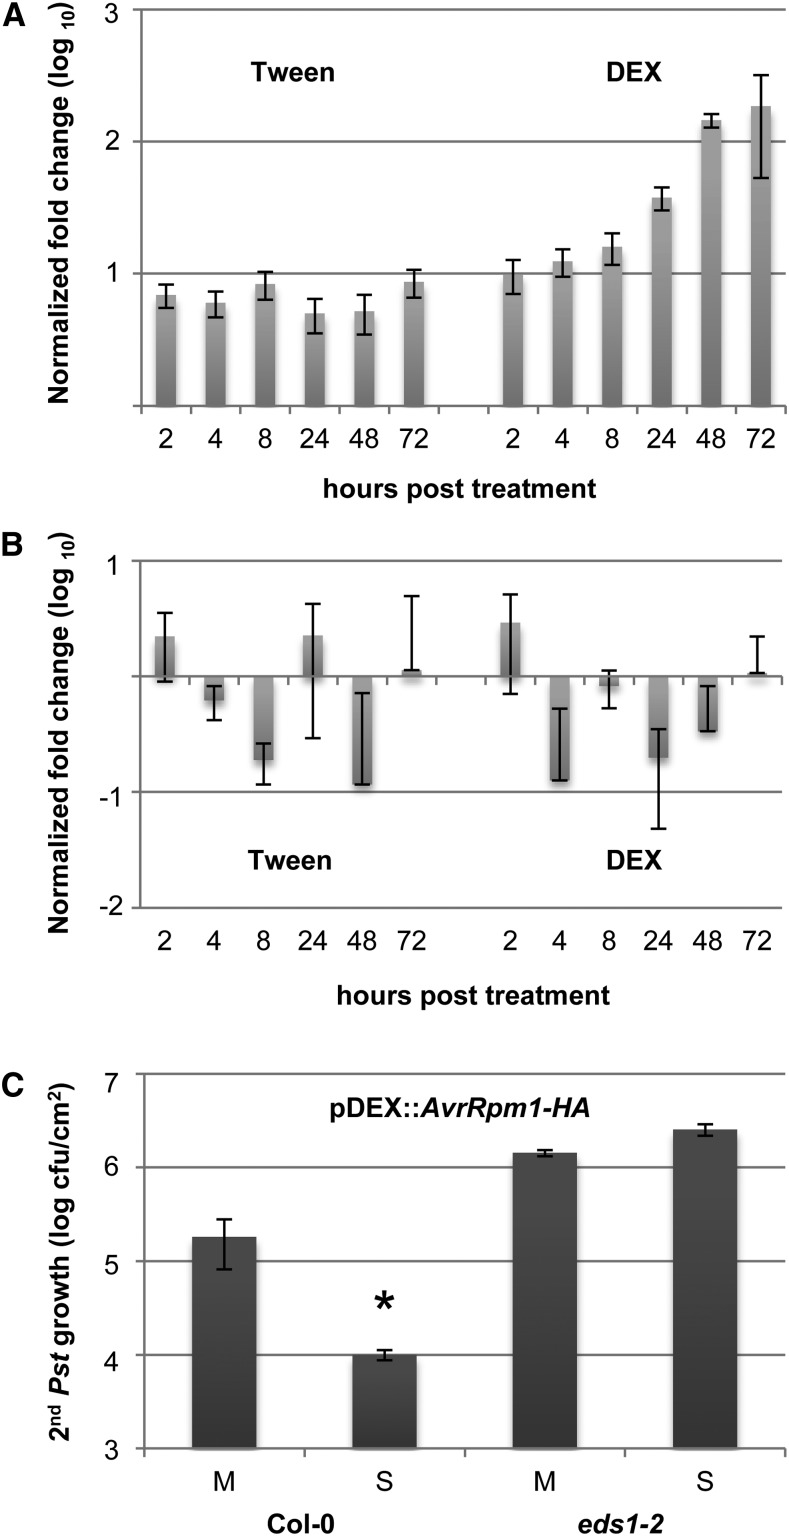
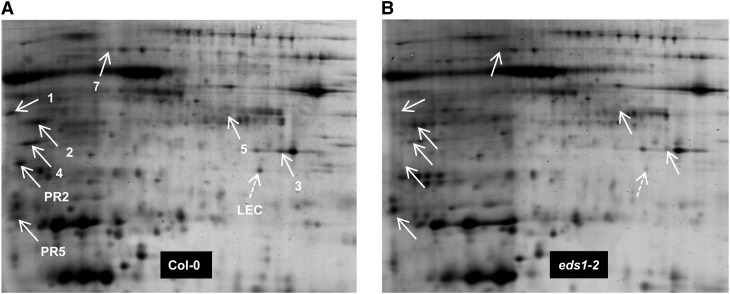
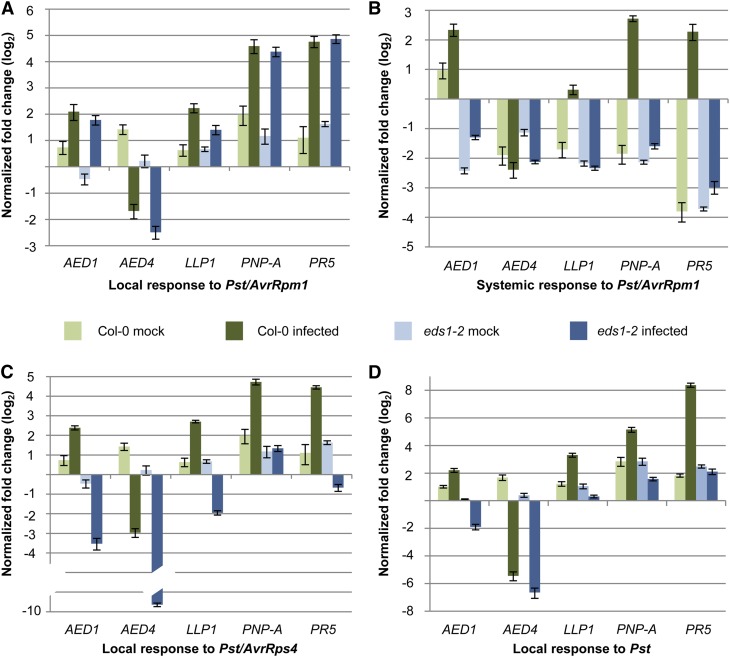
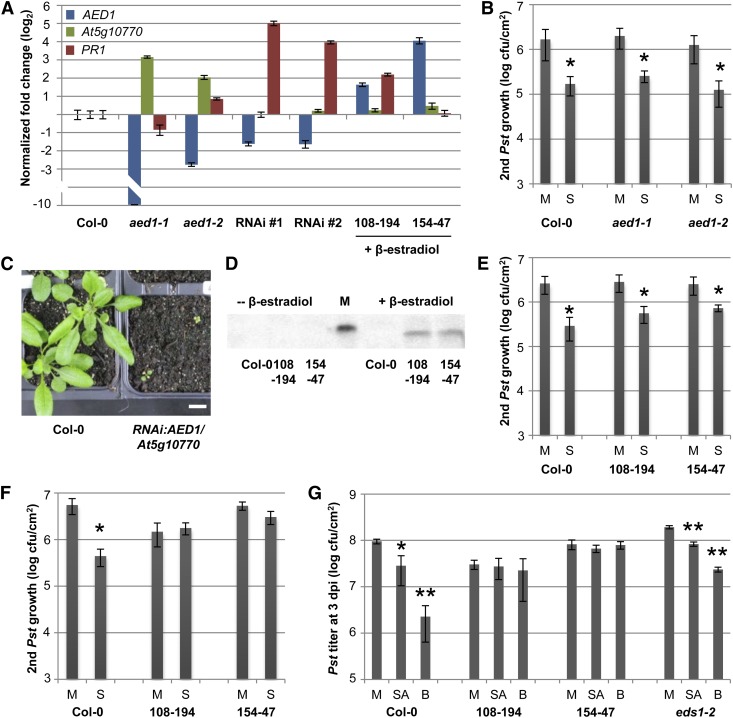
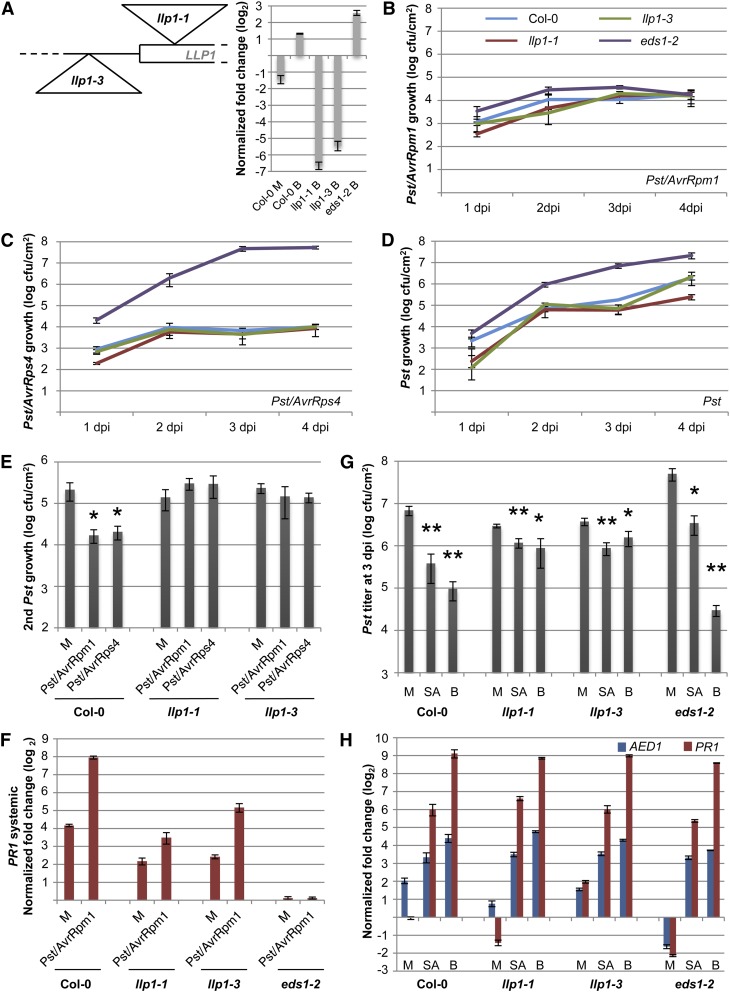
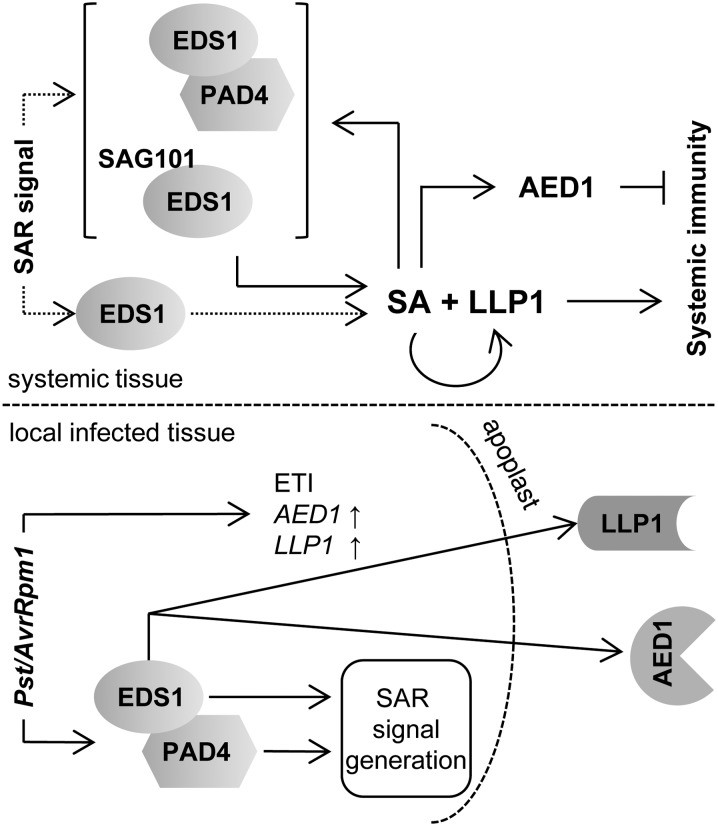
Systemic acquired resistance (SAR) is an inducible immune response that depends on ENHANCED DISEASE SUSCEPTIBILITY1 (EDS1). Here, we show that Arabidopsis (Arabidopsis thaliana) EDS1 is required for both SAR signal generation in primary infected leaves and SAR signal perception in systemic uninfected tissues. In contrast to SAR signal generation, local resistance remains intact in eds1 mutant plants in response to Pseudomonas syringae delivering the effector protein AvrRpm1. We utilized the SAR-specific phenotype of the eds1 mutant to identify new SAR regulatory proteins in plants conditionally expressing AvrRpm1. Comparative proteomic analysis of apoplast-enriched extracts from AvrRpm1-expressing wild-type and eds1 mutant plants led to the identification of 12 APOPLASTIC, EDS1-DEPENDENT (AED) proteins. The genes encoding AED1, a predicted aspartyl protease, and another AED, LEGUME LECTIN-LIKE PROTEIN1 (LLP1), were induced locally and systemically during SAR signaling and locally by salicylic acid (SA) or its functional analog, benzo 1,2,3-thiadiazole-7-carbothioic acid S-methyl ester. Because conditional overaccumulation of AED1-hemagglutinin inhibited SA-induced resistance and SAR but not local resistance, the data suggest that AED1 is part of a homeostatic feedback mechanism regulating systemic immunity. In llp1 mutant plants, SAR was compromised, whereas the local resistance that is normally associated with EDS1 and SA as well as responses to exogenous SA appeared largely unaffected. Together, these data indicate that LLP1 promotes systemic rather than local immunity, possibly in parallel with SA. Our analysis reveals new positive and negative components of SAR and reinforces the notion that SAR represents a distinct phase of plant immunity beyond local resistance.


Figures

Figure 1.
Figure 1.
EDS1 is required for SAR signal generation (A) and perception (B). PR1 transcript accumulation is shown 24 h after infiltration of leaves with petiole exudates collected from mock-treated (M; 10 mm MgCl2) or Pst/AvrRpm1-infected (S) leaves. The exudates were collected from the genotypes indicated above each RNA blot and infiltrated into the recipient plants indicated below each RNA blot. PR1 transcript accumulation was analyzed on northern blots, and equal loading was controlled by on-blot Methylene Blue staining of ribosomal RNA (shown below each RNA blot). This experiment was repeated three times with similar results.
Figure 2.
Figure 2.
Pathogen-free, effector-triggered systemic immunity. A and B, AvrRpm1-HA transcript accumulation was normalized to TUBULIN in Col-0 pDEX:AvrRpm1-HA plants treated with 0.01% (v/v) Tween 20 or 1 µm DEX. Transcript accumulation is shown in the treated (A) and systemic untreated (B) leaves relative to the transcript levels in the same leaves from untreated plants. C, Pst titers are shown 4 d after a secondary infection of pDEX:AvrRpm1-HA plants that was systemic to primary treatments with 0.01% (v/v) Tween 20 (mock; M) or 1 µm DEX (SAR; S). The asterisk indicates a significant difference from the mock-treated plants (P < 0.05, Student’s t test). This experiment was repeated three times with similar results.
Figure 3.
Figure 3.
2D gel analysis of apoplast-enriched extracts from AvrRpm1-HA-expressing Col-0 (A) and eds1-2 mutant (B) plants. Isoelectric focusing was performed along the horizontal axis across a pI range from 4 to 7, and proteins were resolved according to their mass along the vertical axis on 12% (w/v) polyacrylamide gels. White arrows indicate the positions of AED proteins. A putative lectin encoded by At3g16530 was identified on this gel set only and is marked with the dashed arrows (LEC). Numbers correspond to the number of each AED protein in Table I. This experiment was repeated multiple times (for reproducibility per spot, see Supplemental Fig. S4).
Figure 4.
Figure 4.
AED transcript accumulation in response to avirulent and virulent Pst. Col-0 wild-type (green bars) and eds1-2 mutant (blue bars) plants were treated with 10 mm MgCl2 (mock; light colored bars) or infected (dark colored bars). Three days later, the transcript accumulation of AED1, AED4, LLP1, PNP-A, and PR5 was analyzed by qRT-PCR and normalized to UBIQUITIN in leaves infected with Pst/AvrRpm1 (A), in systemic untreated leaves of Pst/AvrRpm1-infected plants (B), in leaves infected with Pst/AvrRps4 (C), and in leaves infected with Pst (D). The transcript accumulation is shown relative to the corresponding transcript levels in leaves of untreated plants of the same age. These experiments were repeated three (AED4, LLP1, and PNP-A) or more (AED1 and PR5) times with similar results.
Figure 5.
Figure 5.
AED1 likely suppresses SAR. A, Transcript levels of AED1 (blue bars), its neighboring locus At5g10770 (green bars), and PR1 (red bars) were normalized to UBIQUITIN in the aed1-1 and aed1-2 mutant plants, in two aerial tissue pools that each contained three RNAi:AED1/At5g10770 transgenic plants (T1), and in XVE:AED1-HA lines 108-194 and 154-47 at 24 h after treatment with 30 µm β-estradiol. For each set of mutant or transgenic plants, the transcript levels are shown relative to those in Col-0 plants of the same age (one representative Col-0 sample is shown). B, SAR in aed1-1 and aed1-2. Pst titers are shown 4 d after a secondary infection that was systemic to primary treatments with 10 mm MgCl2 (mock; M) or Pst/AvrRpm1 (SAR; S). C, Five-week-old RNAi:AED1/At5g10770 transgenic plants (T1) compared with Col-0. Both genotypes were grown for the first 2 weeks on Murashige and Skoog medium without (Col-0) or with (transgenic plants) antibiotics, transferred to soil, and propagated for another 3 weeks. D, Anti-HA western blot of whole protein extracts before (left) or 24 h after (right) treatment of Col-0 plants and XVE:AED1-HA lines 108-194 and 154-47 with 30 µm β-estradiol. M, Molecular size marker; the visible band corresponds to 50 kD. E and F, SAR in XVE:AED1-HA plants. The plants were either untreated (E) or sprayed with 30 µm β-estradiol 24 h before SAR induction (F). SAR was analyzed as in B. G, SA-induced resistance in XVE:AED1-HA plants. At 24 h after the treatment of Col-0, XVE:AED1-HA lines 108-194 and 154-47, and eds1-2 plants with 30 µm β-estradiol, all of the plants were sprayed with 0.01% (v/v) Tween 20 (mock; M) or with 1 mm SA or 1 mm BTH (B) in 0.01% (v/v) Tween 20. After another 24 h, the treated leaves were infected with Pst. The in planta Pst titers are shown at 4 dpi. Asterisks (B and E–G) indicate significant differences compared with the mock-treated controls (*P < 0.05, **P < 0.005, Student’s t test). These experiments were repeated two (aed1-2 [A and B] and RNAi lines [B]) to at least three times with similar results.
Figure 6.
Figure 6.
LLP1 promotes SAR. A, Schematic drawing of the positions of the llp1-1 and llp1-3 T-DNA insertions near the start codon of LLP1 and transcript levels of LLP1 normalized to UBIQUITIN in the Col-0, llp1-1, llp1-3, and eds1-2 plants 24 h after infiltration of the leaves with 10 mm MgCl2 (mock; M) or with 100 µm BTH (B; inset). Transcript accumulation is shown relative to that in untreated Col-0 plants. B to D, Growth curves of Pst/AvrRpm1 (B), Pst/AvrRps4 (C), and Pst (D) in the wild-type (blue), llp1-1 (red), llp1-3 (green), and eds1-2 (purple) plants. The bacterial titers in the infected leaves were determined at 1, 2, 3, and 4 dpi. E, SAR in Col-0, llp1-1, and llp1-3 plants. Pst titers are shown 4 d after a secondary infection that was systemic to primary treatments with 10 mm MgCl2 (M) or with Pst/AvrRpm1 or Pst/AvrRps4. F, Systemic PR1 induction. PR1 transcript levels were normalized to UBIQUITIN in the systemic untreated leaves 3 d after a primary treatment of Col-0, llp1-1, llp1-3, and eds1-2 plants with 10 mm MgCl2 (M) or Pst/AvrRpm1. G and H, SA-induced resistance in the llp1 mutants. Col-0 and llp1-1, llp1-3, and eds1-2 mutant plants were sprayed with 0.01% (v/v) Tween 20 (mock; M) or with 1 mm SA or 1 mm BTH (B) in 0.01% (v/v) Tween 20. After 24 h, leaves of the treated plants were either infected with Pst (G) or harvested for qRT-PCR analysis (H). In G, the in planta Pst titers are shown at 4 dpi; in H, the transcript levels of AED1 and PR1 were normalized to UBIQUITIN and are shown relative to those in untreated Col-0 plants of the same age. Asterisks indicate significant differences from the mock-treated controls (*P < 0.05, **P < 0.005, Student’s t test). These experiments were repeated two times (E [Pst/AvrRps4], F, and H) to at least three times (A–D, E [Pst/AvrRpm1], and G) with similar results.
Figure 7.
Figure 7.
Model integrating EDS1, PAD4, AED1, and LLP1 in SAR signaling. Both EDS1 and PAD4 are essential for SAR signal generation in Pst/AvrRpm1-infected tissue. In addition, signaling downstream of EDS1 leads to the accumulation of AED1 and LLP1 in the apoplast. Systemically, EDS1 either alone or together with PAD4 or SAG101 (both options are shown in dotted lines) mediates SAR signal perception upstream of SA. SA signaling is most likely fortified by the positive feedback loop of SA with EDS1/PAD4/SAG101. The local accumulation of AED1 and LLP1 transcripts in response to Pst/AvrRpm1 is EDS1 independent and appears to be related to ETI, whereas systemic AED1 and LLP1 expression is regulated by EDS1 and SA and may be associated with SAR. The predicted aspartyl protease AED1 likely suppresses systemic immunity, and the legume lectin-like protein LLP1 appears to promote systemic immunity via actions in parallel with SA.

Similar articles

Cited by

References

    1. Aarts N, Metz M, Holub E, Staskawicz BJ, Daniels MJ, Parker JE. (1998) Different requirements for EDS1 and NDR1 by disease resistance genes define at least two R gene-mediated signaling pathways in Arabidopsis. Proc Natl Acad Sci USA 95: 10306–10311 - PMC - PubMed
    1. Akoh CC, Lee GC, Liaw YC, Huang TH, Shaw JF. (2004) GDSL family of serine esterases/lipases. Prog Lipid Res 43: 534–552 - PubMed
    1. Armijo G, Salinas P, Monteoliva MI, Seguel A, García C, Villarroel-Candia E, Song W, van der Krol AR, Álvarez ME, Holuigue L. (2013) A salicylic acid-induced lectin-like protein plays a positive role in the effector-triggered immunity response of Arabidopsis thaliana to Pseudomonas syringae Avr-Rpm1. Mol Plant Microbe Interact 26: 1395–1406 - PubMed
    1. Bartsch M, Gobbato E, Bednarek P, Debey S, Schultze JL, Bautor J, Parker JE. (2006) Salicylic acid-independent ENHANCED DISEASE SUSCEPTIBILITY1 signaling in Arabidopsis immunity and cell death is regulated by the monooxygenase FMO1 and the Nudix hydrolase NUDT7. Plant Cell 18: 1038–1051 - PMC - PubMed
    1. Benning UF, Tamot B, Guelette BS, Hoffmann-Benning S. (2012) New aspects of phloem-mediated long-distance lipid signaling in plants. Front Plant Sci 3: 53. - PMC - PubMed