. 2014 Apr 22:5:3674.
doi: 10.1038/ncomms4674.

Imaging neural spiking in brain tissue using FRET-opsin protein voltage sensors

Affiliations

Imaging neural spiking in brain tissue using FRET-opsin protein voltage sensors

Yiyang Gong et al. Nat Commun. .

Abstract

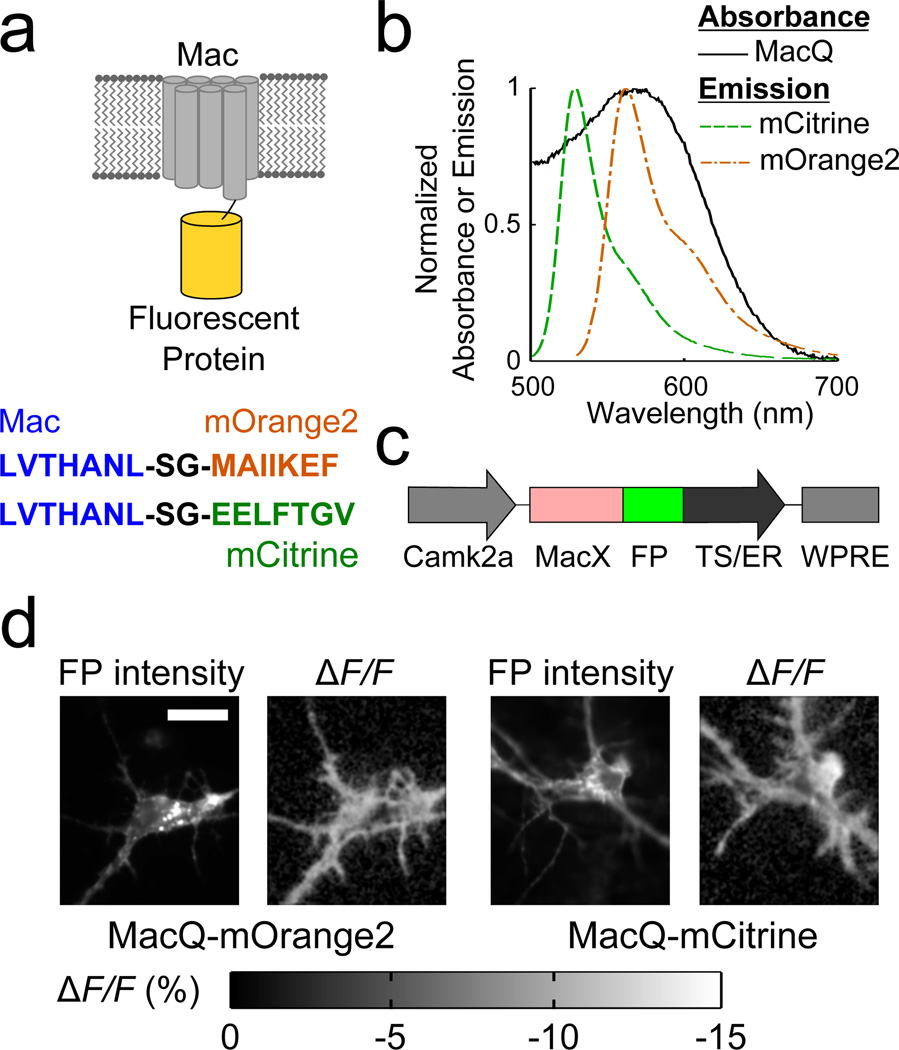
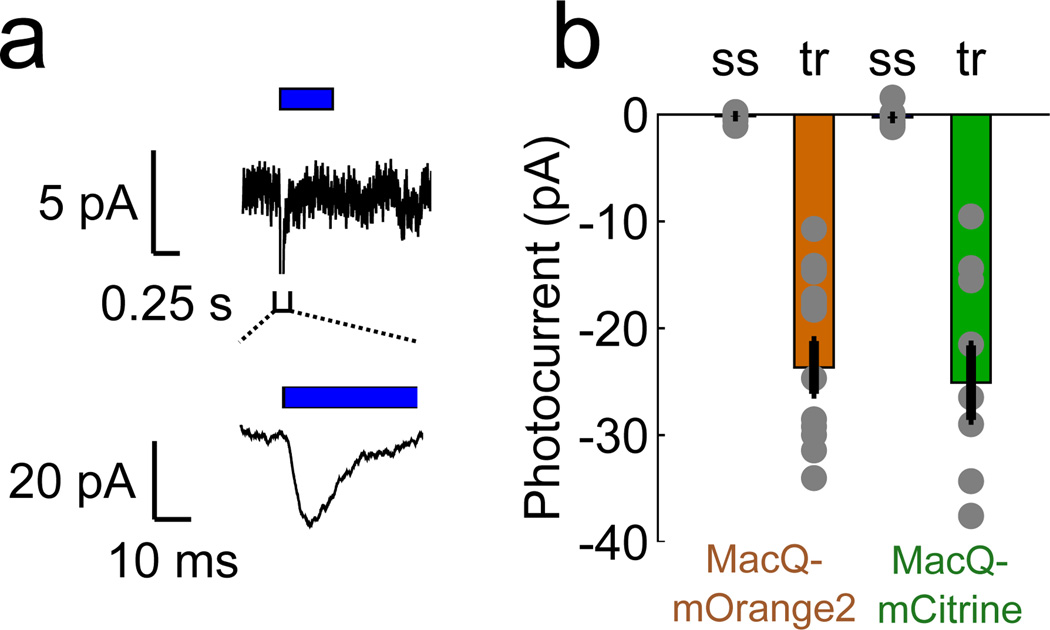
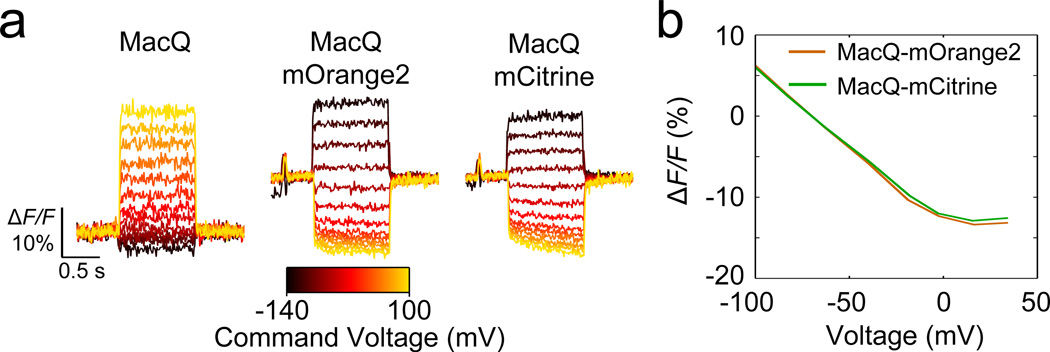
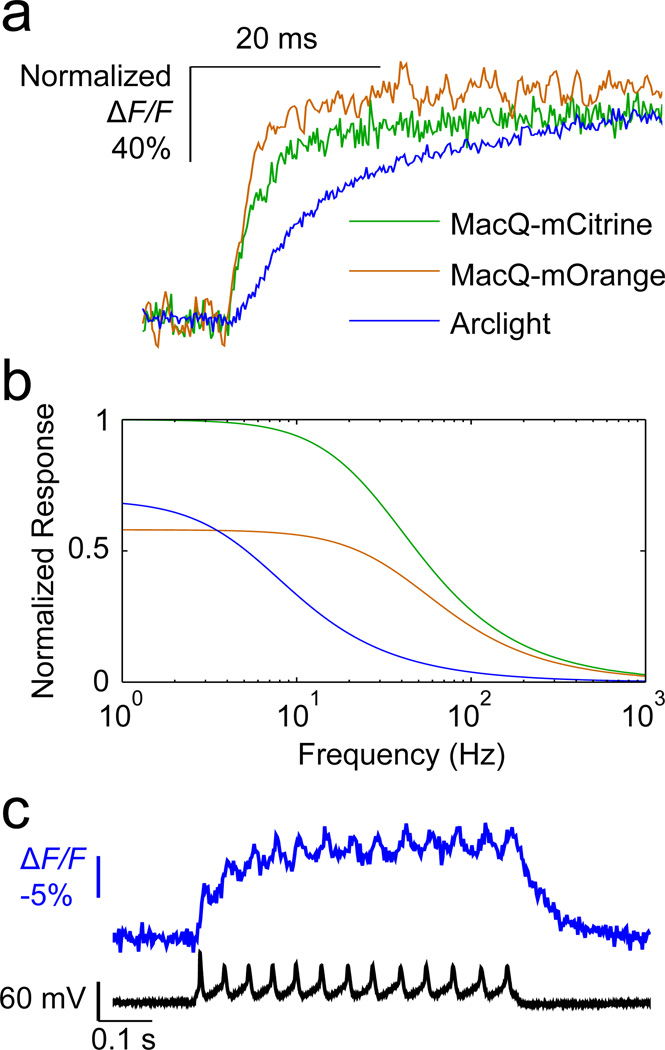
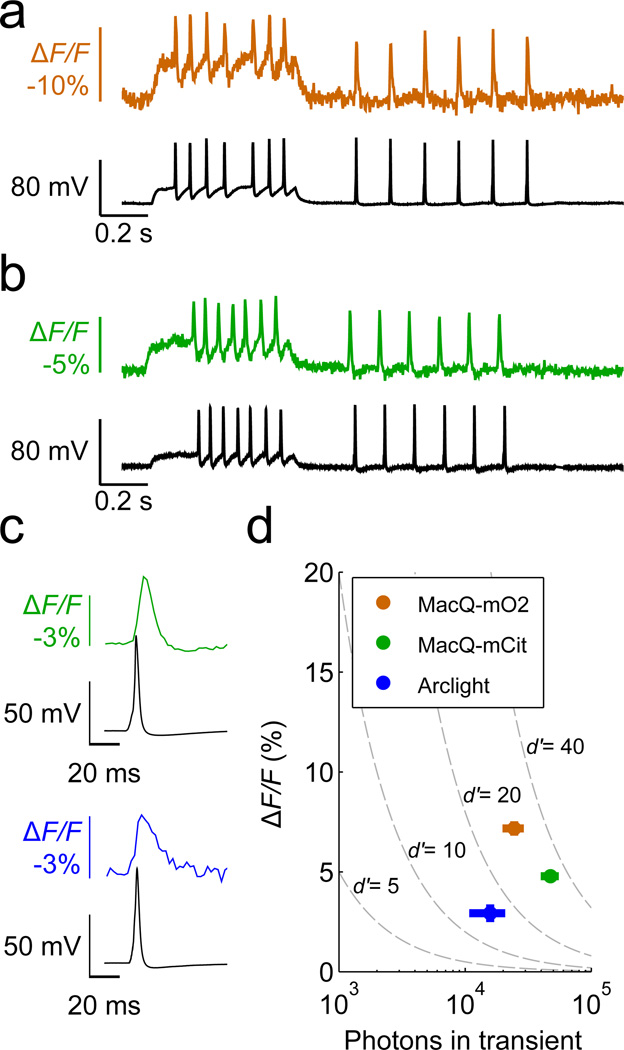
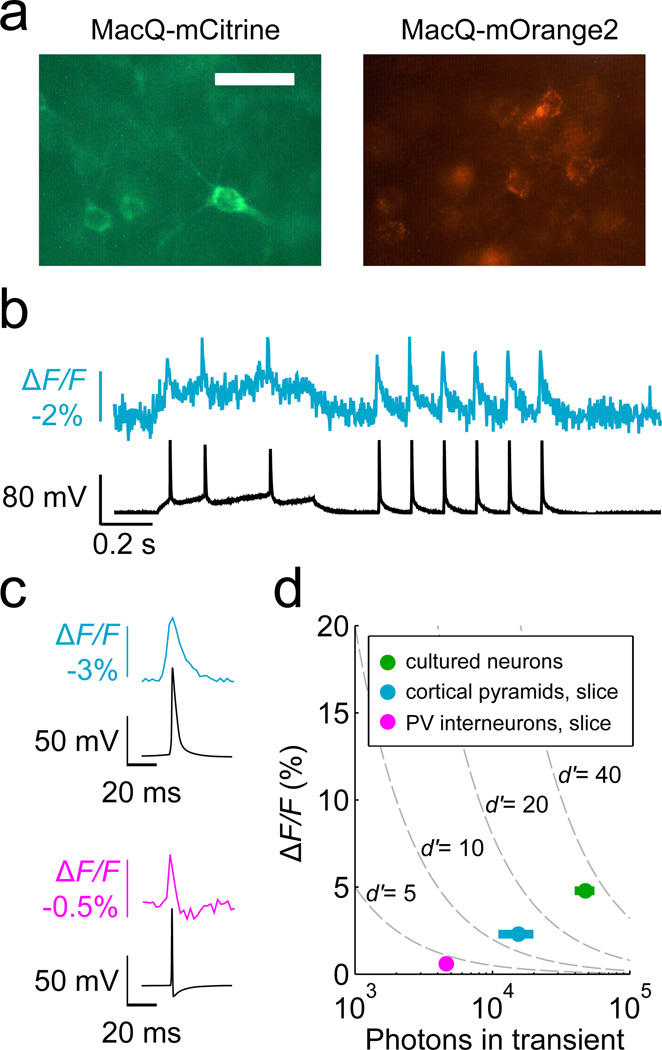
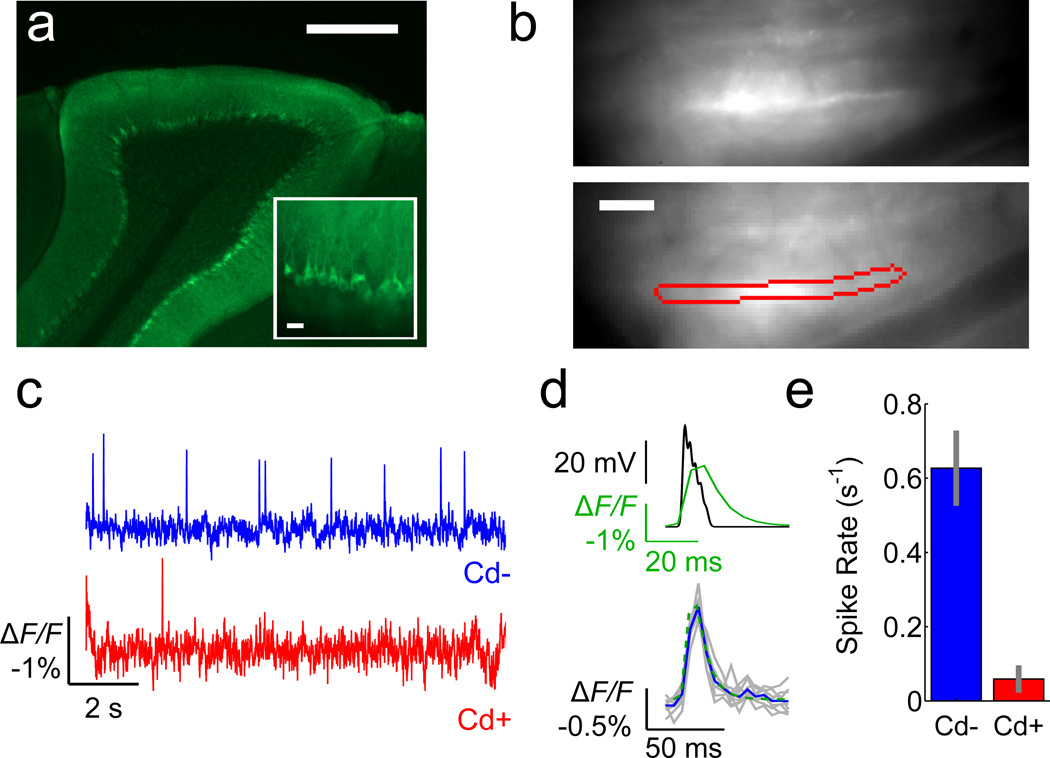
Genetically encoded fluorescence voltage sensors offer the possibility of directly visualizing neural spiking dynamics in cells targeted by their genetic class or connectivity. Sensors of this class have generally suffered performance-limiting tradeoffs between modest brightness, sluggish kinetics and limited signalling dynamic range in response to action potentials. Here we describe sensors that use fluorescence resonance energy transfer (FRET) to combine the rapid kinetics and substantial voltage-dependence of rhodopsin family voltage-sensing domains with the brightness of genetically engineered protein fluorophores. These FRET-opsin sensors significantly improve upon the spike detection fidelity offered by the genetically encoded voltage sensor, Arclight, while offering faster kinetics and higher brightness. Using FRET-opsin sensors we imaged neural spiking and sub-threshold membrane voltage dynamics in cultured neurons and in pyramidal cells within neocortical tissue slices. In live mice, rates and optical waveforms of cerebellar Purkinje neurons' dendritic voltage transients matched expectations for these cells' dendritic spikes.


Figures

Figure 1
Figure 1. Design and membrane localization of FRET-opsin sensor constructs in cultured neurons
(a) Top, Cartoon of the Mac-fluorescent protein fusion. Bottom, Amino acid sequences of the linker for the Mac-mOrange and Mac-mCitrine sensors. (b) Emission spectra of the donor mCitrine and mOrange fluorescent proteins and the absorption spectrum of MacQ, the FRET acceptor. (c) We expressed the enhanced Mac constructs as a protein fusion with mOrange2/mCitrine under the control of the Camk2a promoter and targeted the fusion protein to the cell membrane using the localization sequences TS and ER. (d) Fluorescence signals from neurons labeled with MacQ-mOrange2 and MacQ-mCitrine. The left images of each set are from the fluorescent protein’s color channel; the right images are spatial maps of the fluorescence response to a voltage step depolarization of approximately 100 mV. Regions of fluorescence and voltage response are generally co-localized. Scale bar is 20 µm and applies to all four images.
Figure 2
Figure 2. MacQ based sensors exhibit transient but not steady state photocurrents
(a) MacQ constructs generate a transient excitatory photocurrent at the onset of illumination, illustrated here by the inward current (top) evoked by illumination (blue bars) of a neuron expressing MacQ-mOrange2. The steady state photocurrent deviates negligibly from the baseline measured in the absence of illumination. An expanded view of the photocurrent transient (bottom) reveals its time course at the onset of illumination. (b) Steady-state (ss) and transient (tr) photocurrents of MacQ-mOrange2 (n = 14 cells) and MacQ-mCitrine (n = 9 cells) in response to 530 nm and 505 nm illumination, respectively. Illumination intensity at the specimen was 15 mW mm−2 for all panels. Error bars are s.e.m.
Figure 3
Figure 3. FRET-opsin sensors report voltage depolarization via decreases in emission intensity from the fluorescence donor
(a) Optical step responses of cultured HEK293T cells transfected with MacQ, and cultured neurons transfected with MacQ-mOrange2 and MacQ-mCitrine (440 Hz frame rate). The MacQ VSD increased its fluorescence intensity with increased voltage depolarization (left). The donor fluorescent proteins of the FRET-opsin sensors exhibited decreases in fluorescence intensity with increased depolarization (middle, right). We held neurons at −70 mV at the start of each trace and stepped to command voltages ranging from −140 mV to +100 mV. (b) Steady state fluorescence responses of MacQ-mOrange2 and MacQ-mCitrine as a function of neuronal membrane voltage. Illumination at the specimen plane was 1400 mW mm−2 (λ = 633 nm) for the MacQ studies, and 15 mW mm−2 (λ = 530 nm and 505 nm, for MacQ-mOrange and MacQ-mCitrine, respectively) for the FRET-opsin sensors. Error bars are s.e.m.
Figure 4
Figure 4. The rapid kinetics of MacQ sensors provide a superior frequency response curve as compared to Arclight
(a) Step responses of the MacQ sensors and Arclight to command voltage steps of +100 mV from a holding of −70 mV, normalized to the maximum (or steady-state) ΔF/F response to the command voltage (average of n = 3–6 trials for each construct). MacQ sensors exhibited three- to four-fold faster rise times than that of Arclight. Illumination intensities were 15–50 mW mm−2 at the specimen plane. We used a photomultiplier tube to attain a 5 kHz data acquisition rate. (b) To estimate each voltage sensor’s frequency response curve, we used the step response measurements from (a), the sensors’ empirically determined brightness values, and the sensors’ empirically determined time constants (Methods). Our calculations assumed these time constants were invariant across different holding potentials and voltage steps. Although this assumption is surely wrong for large voltage changes, it simplified the calculations while providing basic insights. MacQ-mCitrine substantially outperformed Arclight at all frequencies, due to MacQ-mCitrine’s faster kinetics, higher brightness, and superior SNR. (c) Electrophysiological and optical traces simultaneously acquired from a cultured neuron expressing Arclight (blue trace). The neuron exhibited repeated spiking during a period of constant current injection, and throughout the spike train there was a sustained increase in Arclight’s baseline fluorescence. As with isolated spikes, Arclight reported action potentials with small ΔF/F (<3%) values and without visible after-hyperpolarizations. Illumination intensity was 15 mW mm−2 (λ = 480 nm). The frame acquisition rate was 440 Hz.
Figure 5
Figure 5. Mac voltage sensors report single action potentials with higher spike detectability than Arclight
(a,b) Optical traces from cultured neurons expressing (a) MacQ-mOrange2 (orange trace) and (b) MacQ-mCitrine (green trace) had sharp peaks that matched the action potentials in the simultaneously acquired electrophysiological traces (black). (c) Optical waveforms of single action potentials from MacQ-mCitrine (green trace, averaged over n = 16 spikes) and Arclight (blue trace, average over n = 10 spikes). The MacQ sensor has faster decay kinetics and reports the after-hyperpolarization phase of the spike waveform. (d) Peak ΔF/F values of the optical responses to action potentials, plotted as a function of the total number of photons detected per spike. We estimated ordinate and abscissa values from the optical waveforms in panel c. Dashed lines are iso-contours of the spike detection fidelity, d’, which is determined by the sensor’s brightness, peak ΔF/F and optical waveform. Fluorescence imaging rates were 440 Hz for all panels, and the illumination intensity was 15 mW mm−2 at the specimen plane for all sensors. Error bars are s.e.m.
Figure 6
Figure 6. MacQ-mCitrine reports spikes from excitatory neurons in brain slices
(a) Fluorescence images of neocortical neurons in fixed brain tissue from mice electroporated in utero with Mac sensors. Neurons electroporated with MacQ-mCitrine (left) exhibited minimal protein aggregation, whereas neurons electroporated with MacQ-mOrange2 (right) showed substantial aggregation. Scale bar is 20 µm. (b) In a brain slice recording following in utero electroporation, MacQ-mCitrine fluorescence (cyan trace) from a layer 2/3 cortical pyramidal neuron matches the cell’s simultaneously recorded electrophysiological trace (black). (c) Optical waveforms for single action potentials from MacQ-mCitrine targeted to layer 2/3 neocortical pyramidal neurons (top, averaged over n = 10 spikes) or from hippocampal parvalbumin interneurons (bottom, averaged over n = 60 spikes) correspond well to the simultaneously recorded electrophysiological waveforms. (d) Peak ΔF/F values of the optical responses to action potentials, as a function of the total number of photons detected per spike. We measured the values of peak ΔF/F in live neocortex slices with MacQ-mCitrine in pyramidal neurons or parvalbumin (PV) interneurons, and estimated the abscissa values from the optical waveforms of panel c. The datum from studies in cultured neurons is shown for reference. Dashed lines are iso-contours of spike detection fidelity, d’. Fluorescence imaging rates were 440 Hz for all panels; illumination intensity was 30 mW mm−2 for all sensors. Error bars are s.e.m.
Figure 7
Figure 7. The MacQ-mCitrine sensor reports voltage transients in the dendrites of Purkinje neurons in live mice
(a) Fluorescence image of MacQ-mCitrine expressed in cerebellar Purkinje neurons, as seen in a fixed tissue slice. Scale bar is 400 µm. Inset: Magnified image of neurons expressing the voltage sensor reveals minimal sensor aggregation. Scale bar is 20 µm. (b) Epi-fluorescence image, acquired in an anesthetized mouse, of Purkinje neurons’ dendritic trees expressing (top) MacQ-mCitrine, and with the region of interest (enclosed within the red perimeter) used to estimate the fluorescence trace for an individual Purkinje neuron dendritic tree (bottom). Scale bar is 40 µm. (c) Fluorescence traces averaged across the dendritic region of interest in panel b showed transient depolarization events at rates consistent with those of dendritic Ca2+ spikes in the cerebellar molecular layer (blue trace). Application of the Ca2+ channel inhibitor CdCl2 largely abolished these events (red trace), as expected for Ca2+ spikes. Image acquisition rate was 190 Hz. Illumination intensity was 10 mW mm−2. (d) To estimate the expected optical waveform from a Purkinje neuron’s dendritic spike, we used as the basis for calculations the Ca2+ spike’s voltage waveform as recorded electrically in the dendritic tree ~65 µm from the cell body (top, black trace). By taking into account the kinetics and voltage-dependence of MacQ-mCitrine’s fluorescence emissions (Methods), we then computed the expected optical waveform of a single Ca2+ spike (top, green trace). The experimentally determined optical waveforms from individual Purkinje neurons (bottom, gray traces) and their mean (bottom, blue trace) closely matched the theoretically predicted time course (bottom, dashed green trace). However, the calculated peak ΔF/F response (1.7%) overestimated the peak of the average measured response (1.2%); we attribute the discrepancy to additional background photon emissions and noise fluctuations present in live mice that are absent in brain slices. (e) The mean detected rate of dendritic voltage transients before and after application of CdCl2 (n = 5 Purkinje neurons). Error bars are s.e.m.

Comment in

  • Visualizing voltage.
    Vogt N. Vogt N. Nat Methods. 2014 Jul;11(7):710-1. doi: 10.1038/nmeth.3018. Nat Methods. 2014. PMID: 25110781 No abstract available.

References

    1. Peterka DS, Takahashi H, Yuste R. Imaging voltage in neurons. Neuron. 2011;69:9–21. - PMC - PubMed
    1. Mutoh H, Akemann W, Knöpfel T. Genetically engineered fluorescent voltage reporters. ACS Chem Neurosci. 2012;3:585–592. - PMC - PubMed
    1. Grinvald A, Hildesheim R. VSDI: a new era in functional imaging of cortical dynamics. Nat. Rev. Neuro. 2004;5:874–885. - PubMed
    1. Chemla S, Chavane F. Voltage-sensitive dye imaging: Technique review and models. J Physiol Paris. 2010;104:40–50. - PubMed
    1. Salzberg BM, Grinvald A, Cohen LB, Davila HV, Ross WN. Optical Recording of Neuronal Activity in an Invertebrate Central Nervous System: Simultaneous Monitoring of Several Neurons. J. Neurophysiol. 1977;40:1281–1291. - PubMed

Publication types