. 2014 Jul 1;592(13):2845-64.
doi: 10.1113/jphysiol.2014.273185. Epub 2014 Apr 22.

A novel short-term plasticity of intrinsic excitability in the hippocampal CA1 pyramidal cells

Affiliations

A novel short-term plasticity of intrinsic excitability in the hippocampal CA1 pyramidal cells

A Sánchez-Aguilera et al. J Physiol. .

Abstract

Changes in neuronal activity often trigger compensatory mechanisms aimed at regulating network activity homeostatically. Here we have identified and characterized a novel form of compensatory short-term plasticity of membrane excitability, which develops early after the eye-opening period in rats (P16-19 days) but not before that developmental stage (P9-12 days old). Holding the membrane potential of CA1 neurons right below the firing threshold from 15 s to several minutes induced a potentiation of the repolarizing phase of the action potentials that contributed to a decrease in the firing rate of CA1 pyramidal neurons in vitro. Furthermore, the mechanism for inducing this plasticity required the action of intracellular Ca(2+) entering through T-type Ca(2+) channels. This increase in Ca(2+) subsequently activated the Ca(2+) sensor K(+) channel interacting protein 3, which led to the increase of an A-type K(+) current. These results suggest that Ca(2+) modulation of somatic A-current represents a new form of homeostatic regulation that provides CA1 pyramidal neurons with the ability to preserve their firing abilities in response to membrane potential variations on a scale from tens of seconds to several minutes.


Figures

Figure 1
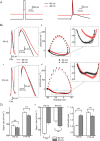
Figure 1. Sustained depolarization affects action potential (AP) waveform of CA1 pyramidal neurons
A, left, diagram of current clamp protocol used to elicit AP. Cells were held for 5 min at −60 mV or −80 mV before applying a short threshold depolarizing current pulse (5 ms). A, right, recorded spike traces obtained at −60 mV or −80 mV. Ba and Bc, representative traces of single spikes elicited at −60 mV or −80 mV from neurons at developmental stages: P9–12 (Ba) and P16–19 (Bc). The traces are overlaid to facilitate comparison. Bb and Bd, the average rates of membrane potential change are plotted vs. AP voltages when the membrane potential was held at −60 mV or −80 mV from neurons at both developmental stages: P9–12 (Bb) and P16–19 (Bd). Detail of repolarization phases is expanded to illustrate the differences. C, summary bar graphs comparing the depolarization rate (Ca), half-width (Cb) and repolarization rate (Cc) of the APs obtained when the membrane potential was held at −60 mV with those observed at −80 mV at both developmental stages. Note how sustained depolarization modifies some AP properties depending on the postnatal age. P9–12: n = 36; P16–19: n = 24 ***P < 0.001 (−60 mV vs. −80 mV).
Figure 2
Figure 2. Sustained depolarization does not affect action potential (AP) waveform of CA3 pyramidal cells and CA1 interneurons
Aa and Ba, cells were held for 5 min at −60 mV or −80 mV before applying a short threshold depolarizing current pulse (5 ms). Representative traces of single spikes elicited at −60 mV or −80 mV from CA3 pyramidal neurons (Aa) and CA1 interneurons (Ba) at developmental stages of P16–19. The traces are overlaid to facilitate comparison. Ab and Bb, the average rates of membrane potential change are plotted vs. AP voltages when the membrane potential was held at −60 mV or −80 mV from CA3 pyramidal neurons (Ab) and CA1 interneurons (Bb). Detail of the repolarization phase is expanded to illustrate the differences. Ac and Bc, summary bar graphs comparing AP half-width and repolarization rate obtained when the membrane potential was held at −60 mV with those observed at −80 mV from CA3 pyramidal neurons (Ac) and CA1 interneurons (Bc) at developmental stages of P16–19. CA3 pyramidal neurons: n = 9; CA1 interneurons: n = 11 *P < 0.05; **P < 0.01 (−60 mV vs. −80 mV).
Figure 3
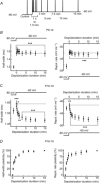
Figure 3. Temporal profile of the short-term intrinsic plasticity induction process
A, diagram of current clamp protocol used for the temporal profile of the induction process. Cells were held at −80 mV for more than 5 min before applying sustained depolarization at −60 mV. The action potentials were elicited by a 5 ms pulse applied after the cell was held at −80 mV for more than 5 min and after several depolarization durations (1, 15, 30, 60, 90, 180, 300, 450, 600 and 900 s) at −60 mV. B and C, graphs showing the average of the spike half-width and repolarization rate of the action potentials plotted vs. the depolarization durations, from neurons at developmental stages: P9–12 (B) and P16–19 (C). Note how both parameters are modified with the depolarization duration only at P16–19. The dotted line shows the baseline level. D, graphs showing the mean percentage plasticities of the half-width and the repolarization rate plotted against depolarization durations at P16–19. Note how the magnitude of the plasticity increases with the increment of the depolarization duration and is almost saturated when its duration is longer than 5 min. P9–12: n = 21; P16–19: n = 17 ***P < 0.001 (each value at −60 mV vs. control).
Figure 4
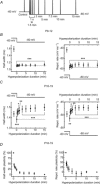
Figure 4. Temporal profile of the short-term intrinsic plasticity disappearing process
A, diagram of current clamp protocol used to study the temporal profile of the disappearing process. Cells were held at −60 mV for 5 min before the membrane potential returned to −80 mV. The APs were elicited by a 5 ms pulse applied after the cell was held at −60 mV for more than 300 s and after different hyperpolarization durations: 1, 15, 30, 60, 90, 180, 300, 450, 600 and 900 s. B and C, graphs showing the average of the spike half-width and repolarization rate of the AP plotted vs. the hyperpolarization durations from neurons at developmental stages: P9–12 (B) and P16–19 (C). Note how both parameters are modified with the duration of the hyperpolarization only at P16–19. The dotted line shows the baseline level. D, graphs showing the mean percentage plasticities of the half-width and the repolarization rate plotted against the hyperpolarization durations at P16–19. Note how the magnitude of the plasticity decreases with an increase in hyperpolarization duration. P9–12: n = 16; P16–19: n = 21 *P < 0.05; **P < 0.01; ***P < 0.001. (each value at −80 mV vs. control)
Figure 5
Figure 5. Short-term intrinsic plasticity decreases neuronal excitability in response to long current pulses
A, to avoid the difference in baseline membrane potential, input–output curves are plotted versus the suprathreshold current intensity (i.e. the current added to the threshold current). Aa and Ab, example of current clamp traces of the spike generation in response to 1 s depolarizing current pulse, when the membrane potential was held for 5 min at −60 mV or −80 mV in neurons of developmental stages: P9–12 (Aa) and P16–19 (Ab). The dashed line in the current step examples shows the suprathreshold intensity. Ac and Ad, mean number of action potentials elicited by 1 s pulses at different suprathreshold current intensities at developmental stages: P9–12 (Ac) (n = 27 cells, the neuronal excitability at −80 mV vs. −60 mV, was significantly lower between 0 and 130 pA) and P16–19 (Ad) (n = 17 cells, the neuronal excitability at −80 mV was significantly lower than at −60 mV for all the suprathreshold currents). B, to avoid the differences in basic membrane properties (−80 mV vs. −60 mV), input–output curves are plotted versus the theoretical steady-state membrane potential (i.e. the steady-state membrane potential given by Ohm's law) for each depolarizing current step. Ba and Bb, example of the spike generation in response to 1 s depolarizing current pulses, when the membrane potential was held during 5 min at −60 mV or −80 mV, in neurons of developmental stages: P9–12 (Ba) and P16–19 (Bb). The four current steps of the example traces depolarize the membrane potential at −45 mV (theoretical steady state). Bc and Bd, mean number of action potentials elicited by 1 s current steps versus the theoretical membrane potential values given at developmental stages: P9–12 (Bc) (n = 27 cells, the neuronal excitability at −80 mV vs. −60 mV was significantly higher at −35 and −30 mV) and P16–19 (Bd) (n = 17 cells, the neuronal excitability at −80 mV vs. −60 mV, was significantly higher from −52.5 to −30 mV). *P < 0.05; **P < 0.01; ***P < 0.001 (−80 mV vs. −60 mV).
Figure 6
Figure 6. Short-term intrinsic plasticity decreases neuronal excitability in response to short current pulses
A, diagram of current clamp protocol used to study neuronal excitability in response to short somatic current pulses (5 ms). Action potentials were elicited by 10 pulses applied every 100 ms, at 1.1 threshold current from baseline potentials of −80 mV and −60 mV. B, example of current clamp traces of the spike generation in response to 10 depolarizing current pulses, when membrane potential was held at −60 mV and at −80 mV in neurons at developmental stages: P9–12 and P16–19. C, summary bar graph comparing the number of successful pulses obtained at membrane potential held at −60 mV with those observed at −80 mV from developmental stages P9–12 (n = 24 cells, the neuronal excitability at −80 mV was significantly lower than at −60 mV) and P16–19 (n = 16 cells, the neuronal excitability at −80 mV was significantly higher than at −60 mV). *P < 0.05; ***P < 0.001 (−80 mV vs. −60 mV).
Figure 7
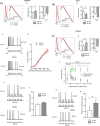
Figure 7. Induction of the short-term intrinsic plasticity is calcium-dependent
Aa, representative traces of single spikes elicited by brief threshold depolarizing current pulses at −60 mV or −80 mV, in the presence of intracellular BAPTA (10 mm). Ab, summary bar graphs comparing the half-width and the repolarization rate of the action potentials (APs) obtained when the membrane potential was held at −60 mV with those observed at −80 mV in the presence of BAPTA (n = 18 cells). Note that in the presence of BAPTA the change on AP half-width and repolarization rate was opposite to that in control conditions. Ac, example of current clamp traces of the spike generation in response to 1 s depolarizing current pulse, which depolarizes the membrane potential at −45 mV, when membrane potential was held at −80 mV (up) or −60 mV (down) in the presence of intracellular BAPTA. Ad, mean number of APs elicited by 1 s current steps versus the theoretical membrane potential in the presence of intracellular BAPTA (n = 9 cells). Ae, example of current clamp traces of the spike generation in response to 10 brief depolarizing current pulses, when membrane potential was held at −80 mV (up) or −60 mV (down) in the presence of intracellular BAPTA. Af, summary bar graph comparing the number of successful pulses obtained when the membrane potential was held at −60 mV with those observed at −80 mV in the presence of intracellular BAPTA (n = 9 cells). Note that in the presence of BAPTA the neuronal excitability was similar at −80 mV and −60 mV. Ba, representative traces of single spikes elicited by brief threshold depolarizing current pulses at −60 mV or −80 mV, in the presence of extracellular AP5 (50 μm). Bb, summary bar graphs comparing the half-width and the repolarization rate of the APs obtained when the membrane potential was held at −60 mV with those observed at −80 mV in the presence of AP5 (n = 18 cells). Ca, representative traces of single spikes elicited by brief threshold depolarizing current pulses at −60 mV or −80 mV, in the presence of extracellular nickel (500 μm). Cb, summary bar graphs comparing the half-width and the repolarization rate of the APs obtained when the membrane potential was held at −60 mV with those observed at −80 mV in the presence of extracellular nickel (500 μm) (n = 18 cells). Note that in the presence of nickel the change in AP half-width and repolarization rate was opposite to that in control conditions. Cc, graphs showing the average of the spike half-width of the AP plotted vs. the depolarization durations, in the presence and absence of extracellular nickel (500 μm; n = 5). Note how the half-width changes with increasing depolarization durations were the opposite after blocking the plasticity with nickel. Cd, example of current clamp traces of the spike generation in response to 10 brief depolarizing current pulses, when membrane potential was held at −80 mV (up) or at −60 mV (down) in the presence of extracellular nickel. Ce, summary bar graph comparing the number of successful pulses obtained when the membrane potential was held at −60 mV with those observed at −80 mV in the presence of extracellular nickel (n = 11 cells). The neuronal excitability was lower at −80 mV than −60 mV. *P < 0.05; **P < 0.01; ***P < 0.001 (−80 mV vs. −60 mV).
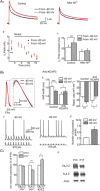
Figure 8
Figure 8. A-type potassium current (IA) is implicated in the short-term intrinsic plasticity
Aa, representative traces of spikes elicited by brief threshold depolarizing current pulses at −60 mV or at −80 mV, before (left) and after the addition of 3 mm 4-AP (right). Ab, summary bar graphs comparing the action potential parameters obtained when the membrane potential was held at −60 mV with those observed at −80 mV, before (control) and after the addition of 3 mm 4-AP. Note how 4-AP blocks plasticity. Ba, prepulse voltage protocol used to isolate the A-type potassium current at two pre-holding potentials: −60 and −80 mV. Ba, left, diagram showing the protocol at pre-holding potential of −80 mV. Ba, right, the IA was obtained by subtracting the current elicited with a prepulse to −20 mV, which removes the initial transient current, from those elicited from −120 mV, which contain all of the potassium currents. Dotted lines indicate zero current. Bb, representative isolated IA recorded at two pre-holding potentials: −60 mV and −80 mV. Note how the peak current amplitude was higher when pre-holding potential was held at −60 mV than at −80 mV. The traces are overlaid to facilitate comparison in this figure and the following. Bc, summary bar graphs showing how the mean peak current amplitude was statistically higher when membrane potential was held at −60 mV than at −80 mV (n = 11 cells). Bd, summary bar graphs showing how the mean current time-constant was statistically greater when membrane potential was held at −60 mV than at −80 mV (n = 11 cells). *P < 0.05; **P < 0.01; ***P < 0.001 (−80 mV vs. −60 mV). 4-AP, 4-aminopyridine.
Figure 9
Figure 9. Expression mechanisms underlying the short-term intrinsic plasticity
Aa, representative isolated IA recorded at two pre-holding potentials: −60 mV and −80 mV obtained before (left) and after the addition of 0.5 mm nickel (right). Note how the differences in the peak current amplitude disappear in the presence of nickel. Ab, summary temporal graph showing that the peak current amplitude decreases more at pre-holding potential −60 mV than at −80 mV, during the extracellular application of nickel (0.5 mm). Ac, summary bar graph showing how the differences in the current time-constant disappear in the presence of nickel (n = 11 cells). Ba, representative traces of single spikes elicited by short depolarizing current pulses at −60 mV and at −80 mV in the presence of intracellular anti-KChIP3 antibody. Bb, summary bar graphs comparing the action potential parameters obtained when the membrane potential was held at −60 mV with those observed at −80 mV, in control conditions (n = 24) and in the presence of intracellular anti-KChIP3 antibody (n = 12 cells). Note how the internal perfusion of the anti-KChIP3 antibody blocked the plasticity. Bc, example of current clamp traces of the spike generation in response to 10 brief depolarizing current pulses, when membrane potential was held at −60 mV (right) or at −80 mV (left) in the presence of intracellular anti-KChIP3 antibody. Bd, summary bar graph comparing the number of successful pulses obtained when the membrane potential was held at −60 mV with those observed at −80 mV in the presence of intracellular anti-KChIP3 antibody (n = 4 cells). Note that in the presence of intracellular anti-KChIP3 antibody the change on action potential half-width and repolarization rate was opposite to that in control conditions. Ca, graph summarizing the expression of Cav3.2 and Kv4.2 channels in hippocampal membrane extracts at P10 and P17 ages. The data were normalized as a percentage of P10 expression. Hippocampal Cav3.2 levels were similar in ages P10–P17. However, Kv4.2 levels significantly decreased at 17 days of age in four of four experiments leading to an increase in the Cav3.2/Kv4.2 ratio. Cb, individual Western blots of hippocampal membrane extracts. *P < 0.05; **P < 0.01; ***P < 0.001.

References

    1. Aizenman CD, Linden DJ. Rapid, synaptically driven increases in the intrinsic excitability of cerebellar deep nuclear neurons. Nat Neurosci. 2000;3:109–111. - PubMed
    1. Anderson D, Mehaffey WH, Iftinca M, Rehak R, Engbers JD, Hameed S, Zamponi GW, Turner RW. Regulation of neuronal activity by Cav3-Kv4 channel signaling complexes. Nat Neurosci. 2010;13:333–337. - PubMed
    1. Anderson D, Engbers JD, Heath NC, Bartoletti TM, Mehaffey WH, Zamponi GW, Turner RW. The Cav3-Kv4 complex acts as a calcium sensor to maintain inhibitory charge transfer during extracellular calcium fluctuations. J Neurosci. 2013;33:7811–7824. - PMC - PubMed
    1. Axmacher N, Miles R. Intrinsic cellular currents and the temporal precision of EPSP-action potential coupling in CA1 pyramidal cells. J Physiol. 2004;555:713–725. - PMC - PubMed
    1. Blanton MG, Lo Turco JJ, Kriegstein AR. Whole cell recording from neurons in slices of reptilian and mammalian cerebral cortex. J Neurosci Methods. 1989;30:203–210. - PubMed

Publication types

Substances

LinkOut - more resources