

Changes in trends and pattern of strong opioid prescribing in primary care
- PMID: 24756859
- PMCID: PMC4238849
- DOI: 10.1002/j.1532-2149.2014.496.x
Changes in trends and pattern of strong opioid prescribing in primary care
Abstract
Background: This study evaluated the prescribing trends of four commonly prescribed strong opioids in primary care and explored utilization in non-cancer and cancer users.
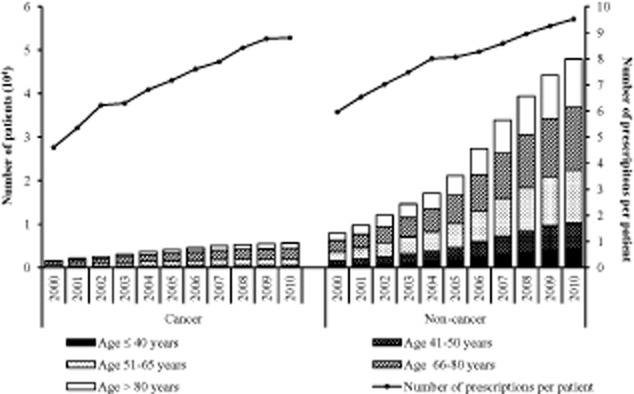
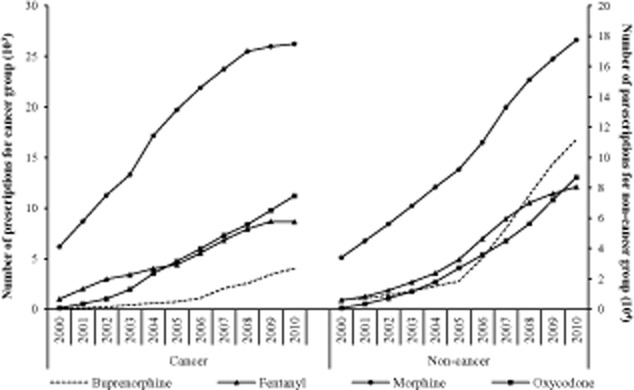
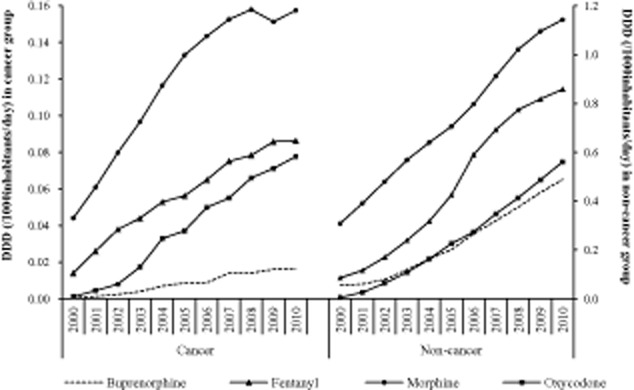
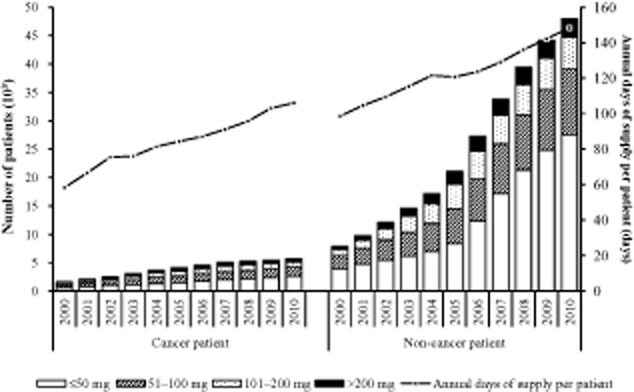
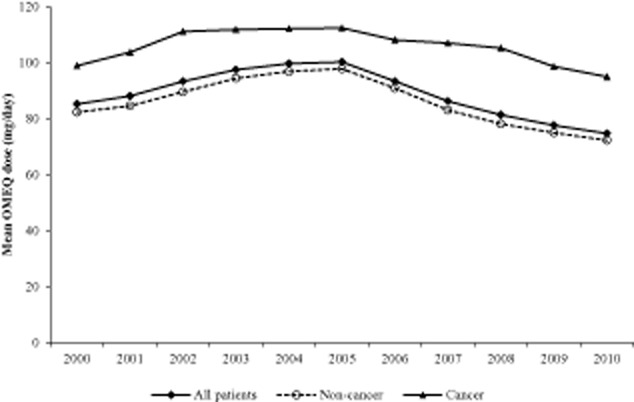
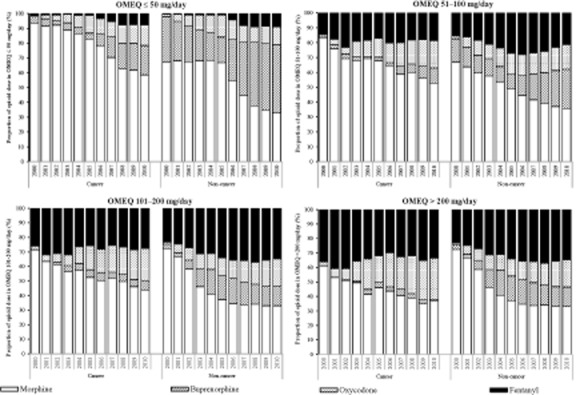
Methods: This cross-sectional study was conducted from 2000 to 2010 using the UK Clinical Practice Research Datalink. Prescriptions of buprenorphine, fentanyl, morphine and oxycodone issued to adult patients were included in this study. Opioid prescriptions issued after patients had cancer medical codes were defined as cancer-related use; otherwise, they were considered non-cancer use. Annual number of prescriptions and patients, defined daily dose (DDD/1000 inhabitants/day) and oral morphine equivalent (OMEQ) dose were measured in repeat cross-sectional estimates.
Results: In total, there were 2,672,022 prescriptions (87.8% for non-cancer) of strong opioids for 178,692 users (59.9% female, 83.9% non-cancer, mean age 67.1 ± 17.0 years) during the study period. The mean annual (DDD/1000 inhabitants/day) was higher in the non-cancer group than in the cancer group for all four opioids; morphine (0.73 ± 0.28 vs. 0.12 ± 0.04), fentanyl (0.46 ± 0.29 vs. 0.06 ± 0.24), oxycodone (0.24 ± 0.19 vs. 0.038 ± 0.028) and buprenorphine (0.23 ± 0.15 vs. 0.008 ± 0.006). The highest proportion of patients were prescribed low opioid doses (OMEQ ≤ 50 mg/day) in both non-cancer (50.3%) and cancer (39.9%) groups, followed by the dose ranks of 51-100 mg/day (26.2% vs. 28.7%), 101-200 mg/day (15.1% vs. 19.2%) and >200 mg/day (8.25% vs. 12.1%).
Conclusions: There has been a huge increase in strong opioid prescribing in the United Kingdom, with the majority of prescriptions for non-cancer pain. Morphine was the most frequently prescribed, but the utilization of oxycodone, buprenorphine and fentanyl increased markedly over time.
© 2014 The Authors. European Journal of Pain published by John Wiley & Sons Ltd on behalf of European Pain Federation - EFIC®.
Figures
Comment in
-
Increasing use of opioids for pain.Eur J Pain. 2014 Oct;18(9):1219-20. doi: 10.1002/ejp.505. Eur J Pain. 2014. PMID: 25195682 No abstract available.
References
-
- Bekkering GE, Soares-Weiser K, Reid K, Kessels AG, Dahan A, Treede RD, Kleijnen J. Can morphine still be considered to be the standard for treating chronic pain? A systematic review including pair-wise and network meta-analyses. Curr Med Res Opin. 2011;27:1477–1491. - PubMed
-
- Boggon R, van Staa TP, Chapman M, Gallagher AM, Hammad TA, Richards MA. Cancer recording and mortality in the General Practice Research Database and linked cancer registries. Pharmacoepidemiol Drug Saf. 2013;22:168–175. - PubMed
-
- Bohnert AS, Valenstein M, Bair MJ, Ganoczy D, McCarthy JF, Ilgen MA, Blow FC. Association between opioid prescribing patterns and opioid overdose-related deaths. JAMA. 2011;305:1315–1321. - PubMed
-
- Caudill-Slosberg MA, Schwartz LM, Woloshin S. Office visits and analgesic prescriptions for musculoskeletal pain in US: 1980 versus 2000. Pain. 2004;109:514–519. - PubMed
-
- Chapman CR, Lipschitz DL, Angst MS, Chou R, Denisco RC, Donaldson GW, Fine PG, Foley KM, Gallagher RM, Gilson AM, Haddox JD, Horn SD, Inturrisi CE, Jick SS, Lipman AG, Loeser JD, Noble M, Porter L, Rowbotham MC, Schoelles KM, Turk DC, Volinn E, Von Korff MR, Webster LR, Weisner CM. Opioid pharmacotherapy for chronic non-cancer pain in the United States: A research guideline for developing an evidence-base. J Pain. 2010;11:807–829. - PubMed
Web references
-
- National Health Service. National Treatment Agency for Substance Misuse. 2011. Addiction to medicine: An investigation into the configuration and commissioning of treatment services to support those who develop problems with prescription-only or over-the-counter medicine. Retrieved from: http://www.nta.nhs.uk/uploads/addictiontomedicinesmay2011a.pdf (accessed on 25 February 2013)
-
- National Health Service. The Information Centre for Health and Social Care. 2013. Prescribing cost analysis England. Retrieved from: http://www.ic.nhs.uk/statistics-and-data-collections/primary-care/prescr... (accessed on 25 February 2013)
-
- WHO Collaborating Centre for Drug Statistics Methodology. 2013. Guidelines for ATC classification and DDD assignment. Retrieved from: http://www.whocc.no/atc_ddd_index/ (accessed on 25 February 2013)
Publication types
MeSH terms
Substances
LinkOut - more resources
Full Text Sources
Other Literature Sources
Medical
Research Materials
