. 2014:2014:418292.
doi: 10.1155/2014/418292. Epub 2014 Mar 13.

5-azacytidine promotes an inhibitory T-cell phenotype and impairs immune mediated antileukemic activity

Affiliations

5-azacytidine promotes an inhibitory T-cell phenotype and impairs immune mediated antileukemic activity

Thomas Stübig et al. Mediators Inflamm. 2014.

Abstract

Demethylating agent, 5-Azacytidine (5-Aza), has been shown to be active in treatment of myeloid malignancies. 5-Aza enhances anticancer immunity, by increasing expression of tumor-associated antigens. However, the impact of 5-Aza immune responses remains poorly understood. Here, T-cell mediated tumor immunity effects of 5-Aza, are investigated in vitro and in vivo. T-cells from healthy donors were treated with 5-Aza and analyzed by qRT-PCR and flow cytometry for changes in gene expression and phenotype. Functionality was assessed by a tumor lysis assay. Peripheral blood from patients treated with 5-Aza after alloSCT was monitored for changes in T-cell subpopulations. 5-Aza treatment resulted in a decrease in CD8+ T-cells, whereas CD4+ T-cells increased. Furthermore, numbers of IFN-γ + T-helper 1 cells (Th1) were reduced, while Treg-cells showed substantial increase. Additionally, CD8+ T-cells exhibited limited killing capacity against leukemic target cells. In vivo data confirm the increase of Treg compartment, while CD8+ T-effector cell numbers were reduced. 5-Aza treatment results in a shift from cytotoxic to regulatory T-cells with a functional phenotype and a major reduction in proinflammatory Th1-cells, indicating a strong inhibition of tumor-specific T-cell immunity by 5-Aza.


Figures
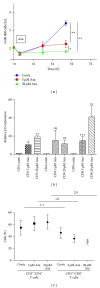
Figure 1
Figure 1
5-Azacytidine reduces T-cell proliferation mainly by inhibition of CD8 T-cell proliferation by p15 upregulation. (a) T-cells were isolated from buffy coats and cultured for one week in presence of IL-2. 12 h before 5-Aza treatment cells were seeded in fresh medium. T-cells were treated with 5 μM or 20 μM 5-Aza or left untreated as control. Numbers of viable cells were determined every 12 h, over a period of 72 h by Trypan blue exclusion. Depicted results show mean value of triplicates. (*P < 0.05, **P < 0.005). (b) CD3, CD4, and CD8 T-cells were sorted and treated with (5 μM or 20 μM) or without 5-Aza. p15 mRNA levels of the different subsets were analyzed by qRT-PCR. Data show mean values of triplicates. (*P < 0.05, **P < 0.005, not significant (n.s.)). (c) After 5-Aza for 48 h T-cell subsets were analyzed by FACS with mAB against CD3, CD4, and CD8. CD4/CD8 ratios were indicated for each treatment group. Data represent mean value of four independent experiments with SD.
Figure 2
Figure 2
Treatment with 5-Aza induces FOXP3+ Treg and upregulates immunomodulatory cytokines. (a) CD3+ and CD4+ T-cells were isolated and cultured for one week in the presence of IL2. Thereafter, cells were treated with the indicated dosages of 5-Aza. After 48 h mRNA was isolated and FOXP3 expression levels were analyzed in the CD3+ and CD4+ T-cell subset. Data show mean value with SD. (*P < 0.05, **P < 0.005). (b) T-cells were analyzed by FACS after the described treatment with or without 5-Aza for the expression of FoxP3. CD4+/CD25+/FoxP3+, triple positive cells were considered as Tregs. A representative example of three independent experiments is shown. (c) The marker combination CD4+/CD25hi/CD127lo was used to confirm the results of (b). Data show mean value with SD of three different experiments. (d) mRNA of 5-Aza treated or control CD3+ T-cells were isolated and mRNA levels of IL10 and TGF-β were measured. Data shown as fold pattern gene induction. (*P < 0.05, **P < 0.005).
Figure 3
Figure 3
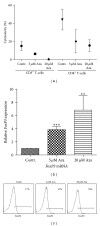
CD8 T-cells show reduced cytotoxic function after 5-Aza treatment and upregulation of FOXP3. (a) CD3+ or CD8+ T-cells were isolated and treated with 5 μM or 20 μM or without 5-Aza for 48 h. Thereafter, T-cells were resuspended in fresh medium and cocultured with the target cell line HL60 for 4 h. LDH release was used as marker for cell death. Specific cytotoxicity was calculated as described by the manufacturer. Four independent experiments (all with an E : T ratio 10 : 1) are shown. (b) CD8+ T-cells were sorted and treated with 5-Aza (5 μM and 20 μM) for 48 h. mRNA levels of FOXP3 in CD8 cell compartment were assessed by qRT-PCR. (*P < 0.05). (c) CD8+ T-cells were analyzed after treatment with or without 5-Aza, for their intracellular expression of FoxP3. A representative of three different experiments is shown.
Figure 4
Figure 4
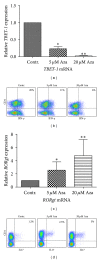
In vitro treatment with Azacytidine has different influence on TH1 and TH17 cells. (a) CD4+ T-cells were treated with or without 5-Aza for 48 h. mRNA was isolated and the expression of TBET1 was analyzed by qRT-PCR. Data are shown as mean value with SD. (*P < 0.05, **P < 0.005). (b) CD4+ T-cells were analyzed for their expression of IFN-γ, after T-cell treatment with or without 5-Aza and additional stimulation with PMA and ionomycin in the presence of brevedinA for 4.5 h. IFN-γ expression was analyzed by FACS. A representative example of three independent experiments is shown. (c) After sorting, CD4+ T-cells were treated with or without 5-Aza for 48 h, and mRNA was isolated. Expression of RORγt was analyzed by qRT-PCR. Data are shown as mean value with SD. (*P < 0.05, **P < 0.005, not significant (n.s.)). (d) Similar to the aforementioned IFN-γ staining, CD4+ T-cells were analyzed for their expression of IL17 after 5-Aza treatment. A representative sample of three independent experiments is shown.
Figure 5
Figure 5
Azacytidine inhibits memory T-cells while naïve T-cell number is not affected. CD4+ and CD8+ T-cells were isolated and treated with or without the discussed 5-Aza concentrations. 48 h after treatment, cells were assessed for the expression of CD4, CD8, CD45RA, CCR7, and CD45RO. A representative sample and the gating strategy are shown in Supplementary Part (Supplementary Figure S2). (a) Cells expressing both (CD45RA+/CCR7+) were considered to be naïve T-cells. (b) Cells expressing the CD45RO antigen were considered to be memory T-cells. Data were shown as mean with standard deviation, a summary of three independent experiments is shown. Plots show a percentage of gated T-cells.
Figure 6
Figure 6
Treatment with 5-Azacytidine reduces long-term memory cell phenotype. (a) CD3+ were treated for 48 h with 5 μM 5-Aza or untreated as control. Thereafter, T-cells were first assessed for their CD4 and CD8 expression. CD4+ T-cells as well as CD8+ T-cells were further analyzed for the expression of CD62L and CD127. High expression (>104 compared to isotype control) of both antigens was taken as a surrogate marker for long-term memory cells. A representative example for three independent experiments is shown. (b) CD3+ T-cells were analyzed for the expression of CD62L by flow cytometry after treatment with 5-Aza. Data were shown as mean value of 3 independent experiments with standard deviation. (*P < 0.05; **P < 0.01).
Figure 7
Figure 7
In vivo effects of 5-Azacytidine in the treatment after alloSCT. (a) CD4+ and CD8+ T-cells were measured in the peripheral blood of three different patients during their treatment with 5-Aza. Data is shown as mean with SD and depicted values are baseline (before the first application of 5-Aza) and at the end of the 2 cycles (after treatment). (b) CD3+ T-cells were analyzed for the expression of HLA-DR by flow cytometry as long-term activation marker during treatment with 5-Aza. Time points are identical with those in (a). Data were shown as median with SD. (c) Cells expressing CD4+/CD25hi/CD127lo were considered to be Treg cells. Tregs were measured in weekly intervals for both cycles. Data were shown as mean with SD. (↓ shows the time point of 5 days of 5-Aza as treatment). (*P < 0.05). (d) Naïve T-cells were classified by the expression of CD3+/CD4+ or CD8+/CD45RA+. In contrast, cells expressing CD45RO were considered to be memory T-cells. Data is shown as mean with SD and depicted values are baseline (before the first application of 5-Aza) and at the end of the 2 cycles (after treatment).

Comment in

References

    1. Delcuve GP, Rastegar M, Davie JR. Epigenetic control. Journal of Cellular Physiology. 2009;219(2):243–250. - PubMed
    1. Esteller M. Cancer epigenomics: DNA methylomes and histone-modification maps. Nature Reviews Genetics. 2007;8(4):286–298. - PubMed
    1. Silverman LR, Demakos EP, Peterson BL, et al. Randomized controlled trial of azacitidine in patients with the myelodysplastic syndrome: a study of the cancer and leukemia group B. Journal of Clinical Oncology. 2002;20(10):2429–2440. - PubMed
    1. Fenaux P, Mufti GJ, Hellstrom-Lindberg E, et al. Azacitidine prolongs overall survival compared with conventional care regimens in elderly patients with low bone marrow blast count acute myeloid leukemia. Journal of Clinical Oncology. 2010;28(4):562–569. - PubMed
    1. Stresemann C, Lyko F. Modes of action of the DNA methyltransferase inhibitors azacytidine and decitabine. International Journal of Cancer. 2008;123(1):8–13. - PubMed