

Prevalence and trends of obesity and association with socioeconomic status in Thai adults: National Health Examination Surveys, 1991-2009
- PMID: 24757561
- PMCID: PMC3976913
- DOI: 10.1155/2014/410259
Prevalence and trends of obesity and association with socioeconomic status in Thai adults: National Health Examination Surveys, 1991-2009
Abstract
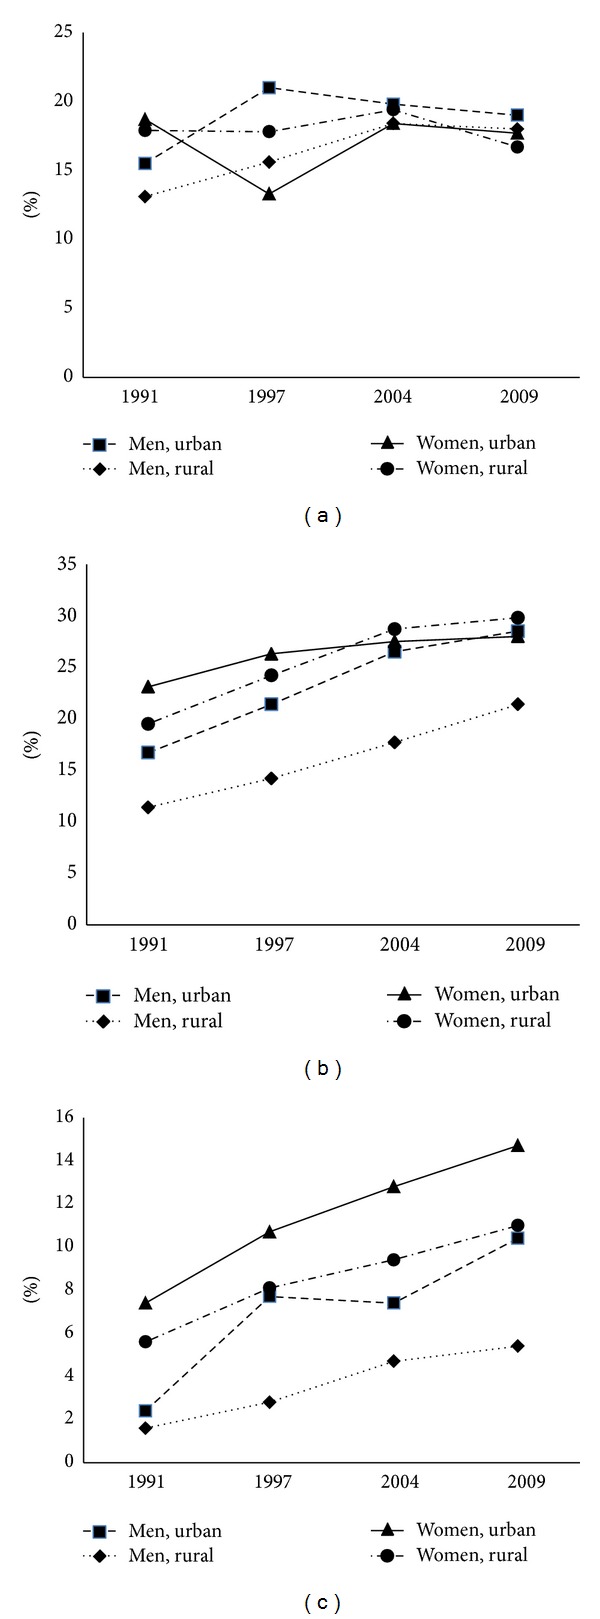
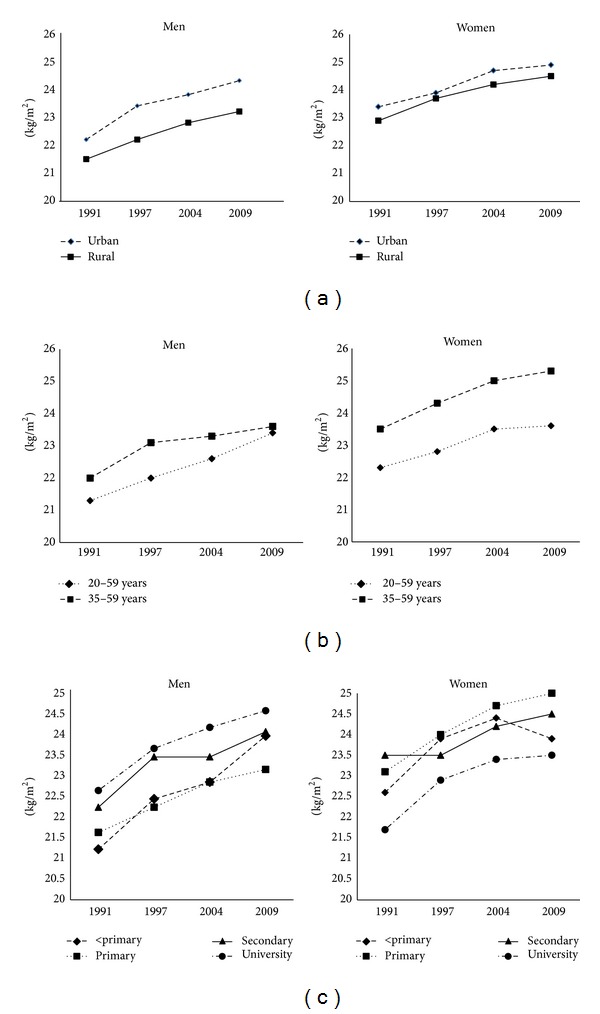
We determined the prevalence of obesity in Thai adults aged 20 and over in 2009 and examined trends of body mass index (BMI) between 1991 and 2009. Data from Thai National Health Examination Survey for 19,181 adults in 2009 and 64,480 adults between 1991 and 2004 were used to calculate age-adjusted mean and prevalence. Logistic regression was used to examine the association of obesity with education level. In 2009, age-adjusted prevalence of obesity classes I (BMI 25-29.9 kg/m(2)) and II (BMI ≥30 kg/m(2)) in Thai adults aged ≥20 years were 26.0% and 9.0%, respectively. Compared with primary education, the odds of obesity class I were highest in men with university education. For women, the odds of obesity classes I and II were highest in those with primary education. BMI significantly increased from 21.6 kg/m(2) in men and 22.8 kg/m(2) in women in 1991 to 23.3 kg/m(2) and 24.4 kg/m(2) in 2009, respectively. The average BMI increases per decade were highest in men with secondary education (1.0 kg/m(2), P < 0.001) and in women with primary education with the same rate. There were increasing trends in BMI with slight variation by SES groups in Thai men and women during 1991-2009.
Figures
References
-
- WHO. Global Action Plan for the Prevention and Control of Noncommunicable Diseases 2013–2020. Geneva, Switzerland: World Health Organization; 2013.
MeSH terms
LinkOut - more resources
Full Text Sources
Other Literature Sources
Medical
