. 2014 Apr 23:15:303.
doi: 10.1186/1471-2164-15-303.

Severe hypoxia exerts parallel and cell-specific regulation of gene expression and alternative splicing in human mesenchymal stem cells

Affiliations

Severe hypoxia exerts parallel and cell-specific regulation of gene expression and alternative splicing in human mesenchymal stem cells

Xinyang Hu et al. BMC Genomics. .

Abstract

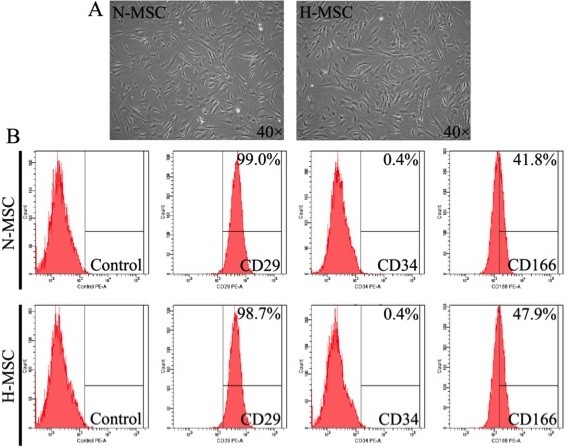
Background: The endosteum of the bone marrow provides a specialized hypoxic niche that may serve to preserve the integrity, pluripotency, longevity and stemness of resident mesenchymal stem cells (MSCs). To explore the molecular genetic consequences of such a niche we subjected human (h) MSCs to a pO2 of 4 mmHg and analyzed global gene expression and alternative splicing (AS) by genome-exon microarray and RT-qPCR, and phenotype by western blot and immunostaining.

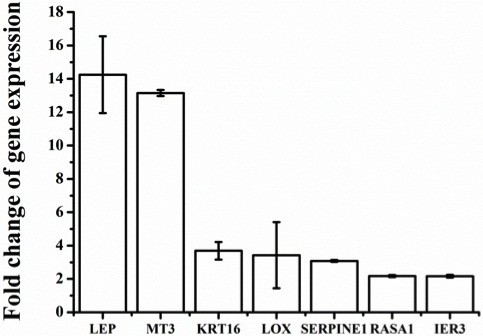
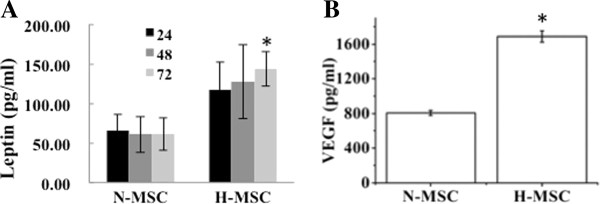
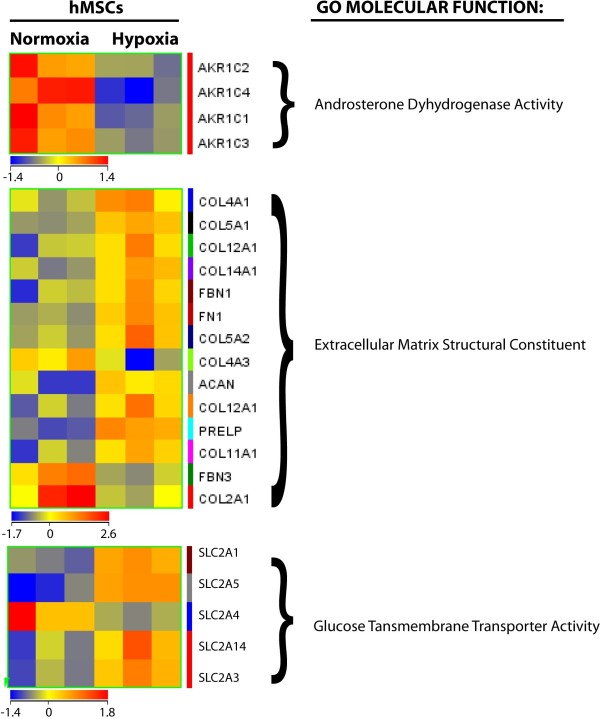
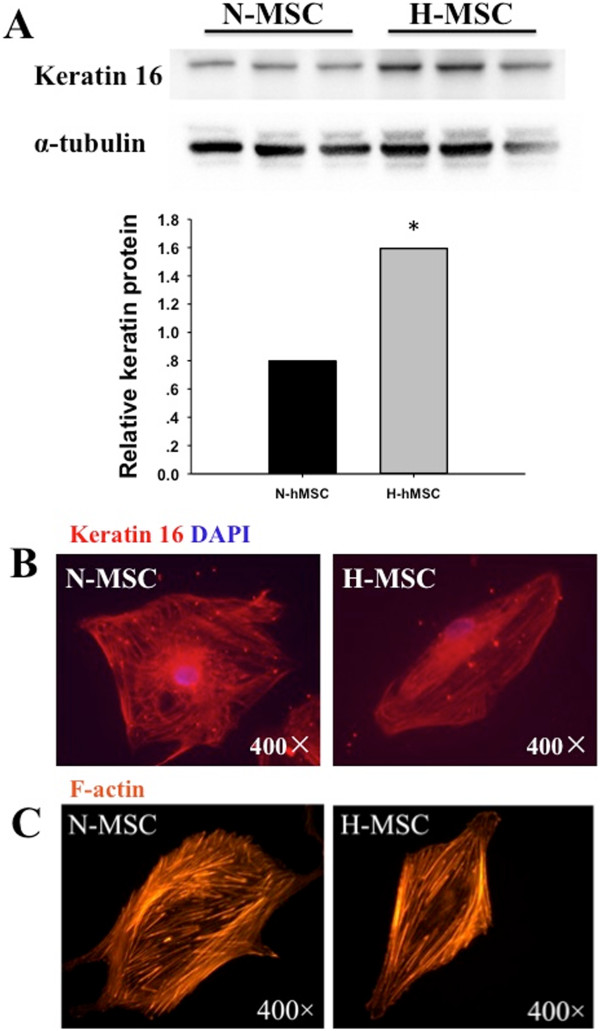
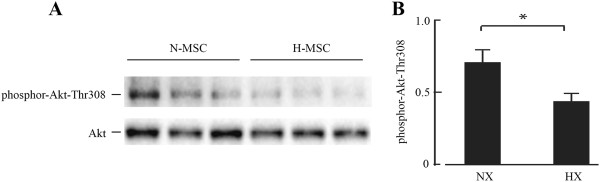
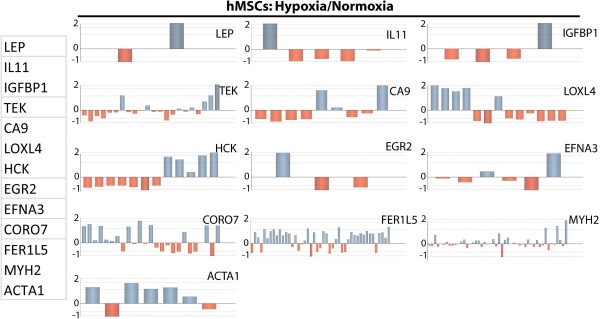
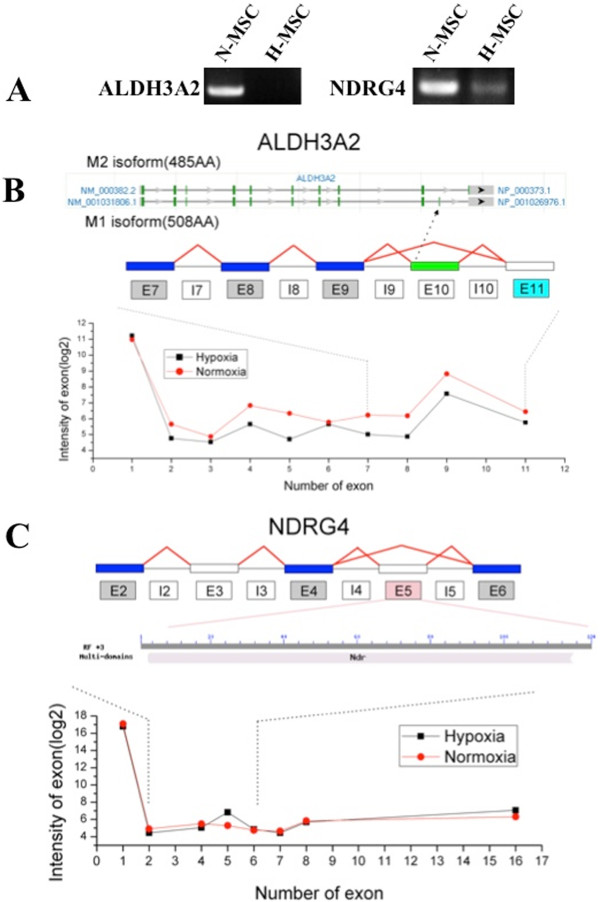
Results: Out of 446 genes differentially regulated by >2.5-fold, down-regulated genes outnumbered up-regulated genes by 243:203. Exon analyses revealed 60 hypoxia-regulated AS events with splice indices (SI) >1.0 from 53 genes and a correlation between high SI and degree of transcript regulation. Parallel analyses of a publicly available AS study on human umbilical vein endothelial cells (HUVECs) showed that there was a strong cell-specific component with only 11 genes commonly regulated in hMSCs and HUVECs and 17 common differentially spliced genes. Only 3 genes were differentially responsive to hypoxia at the gene (>2.0) and AS levels in both cell types. Functional assignments revealed unique profiles of gene expression with complex regulation of differentiation, extracellular matrix, intermediate filament and metabolic marker genes. Antioxidant genes, striated muscle genes and insulin/IGF-1 signaling intermediates were down-regulated. There was a coordinate induction of 9 out of 12 acidic keratins that along with other epithelial and cell adhesion markers implies a partial mesenchymal to epithelial transition.

Conclusions: We conclude that severe hypoxia confers a quiescent phenotype in hMSCs that is reflected by both the transcriptome profile and gene-specific changes of splicosome actions. The results reveal that severe hypoxia imposes markedly different patterns of gene regulation of MSCs compared with more moderate hypoxia. This is the first study to report hypoxia-regulation of AS in stem/progenitor cells and the first molecular genetic characterization of MSC in a hypoxia-induced quiescent immobile state.


Figures

Figure 1
Figure 1
Characterization of hMSCs cultures under air or hypoxia. (A) Morphology and (B) surface antigen profiling of normoxic (N-MSC) and hypoxic hMSCs (H-MSC). Conditions and procedures are described in Methods. Representative of n = 3.
Figure 2
Figure 2
Real-time PCR (RTqPCR) validation of differentially expressed genes. RTqPCR was implemented on the same mRNA samples used for microarray as described in Methods. Results are mean ± SEM of n = 3.
Figure 3
Figure 3
Quantification of leptin and VEGF protein in MSC spent media during exposure to hypoxia. (A) Numbers in left panel refer to time (h) under hypoxia. (B) VEGF incubation time was 24 h. All results are representative of 3 separate experiments; *p < 0.05, n = 3.
Figure 4
Figure 4
Heatmaps of differentially expressed genes in 2 main Gene Ontology (GO) molecular functions. Differentially expressed genes in human MSCs under hypoxia were subjected to GO analysis. A significance cut-off of p < 0.05 was used.
Figure 5
Figure 5
Keratin induction and reorganization of intermediate- and micro-filaments under hypoxia. (A) Western blot of Keratin-16 expression in normoxic (N-MSC) and hypoxic (H-MSC) human MSCs. (B) Keratin immunostaining and (C) F-actin immunostaining of MSCs cultured for 24 h under normoxia (N-MSC) or hypoxia (H-MSC). Western blots and immunostaining are described in Methods. All results are representative of 3 separate experiments; *p < 0.05, n = 3.
Figure 6
Figure 6
Western blot and quantification of phosphor-Akt expression in normoxic (N-MSC) and hypoxic (H-MSC) human MSCs (A and B). Western blot procedures are described in Methods. Akt-P-Thr308 quantification was by NIH image using total Akt as loading control; *p < 0.05, n = 3.
Figure 7
Figure 7
Splicing maps of highly regulated genes with high splice indices. Genes were selected based on highest positive (LEP, IL11, IGFBP1, TEK, CA9, LOX4, HCK, ERG2) and negative (EFNA3, CORO7, FER1L5, MYH2, ACTA1) fold change of gene expression hypoxia vs. normoxia. Bar graphs indicate hypoxic/normoxic differential exonic expression levels (n = 3).
Figure 8
Figure 8
Oxygen-dependent differential splicing of the ALDH3A2 and NDRG4 genes. (A) Expression of splice isoforms confirmed by RT-PCR of genes with prior evidence of AS. (B) Annotation of each alternative isoform (M2 and M1, top graphic), exon structure (middle graphic) and expression profiles (bottom graphic) for ALDH3A2. Light blue boxes indicate down-regulation for hypoxic (H) versus normoxic (N) MSCs; gray boxes indicate no significant change; white boxes indicate no probe detection above expression threshold. The green exon (exon10) indicates the unique exon of isoform M1. Exon expression values (log2) are displayed for both H-MSC (black data points) and N-MSC (red data points), ranked in order of genomic position on the x-axis. The various isoforms can be validated in the PCR result although there is no probe annotated to the isoform-specific exon. (C) Exon structure (top graphic) modified domain of AS (middle graphic) and expression profiles (bottom graphic) for NDRG4. Light red boxes indicate up-regulation for hypoxic (H) versus normoxic MSCs (N) MSCs; gray boxes indicate no significant change; white boxes indicate no probe detection above expression threshold. A Modified or disrupted conserved domain of differentially expressed exon is from the CDD database (NCBI). Exon expression values (log2) are displayed for both H-MSC (black data points) and N-MSC (red data points), ranked in order of genomic position on the x-axis.

References

    1. Jones DL, Wagers AJ. No place like home: anatomy and function of the stem cell niche. Nat Rev Mol Cell Biol. 2008;9:11–21. doi: 10.1038/nrm2319. - DOI - PubMed
    1. Scadden DT. The stem-cell niche as an entity of action. Nature. 2006;441:1075–1079. doi: 10.1038/nature04957. - DOI - PubMed
    1. Eliasson P, Rehn M, Hammar P, Larsson P, Sirenko O, Flippin LA, Cammenga J, Jönsson JI. Hypoxia mediates low cell-cycle activity and increases the proportion of long-term reconstituting hematopoietic stem cells during in vitro culture. Exp Hematol. 2010;38:301–310. doi: 10.1016/j.exphem.2010.01.005. - DOI - PubMed
    1. Panchision DM. The role of oxygen in regulating neural stem cells in development and disease. J Cell Physiol. 2009;220:562–568. doi: 10.1002/jcp.21812. - DOI - PubMed
    1. Silván U, Díez-Torre A, Arluzea J, Andrade R, Silió M, Aréchaga J. Hypoxia and pluripotency in embryonic and embryonal carcinoma stem cell biology. Differentiation. 2009;78:159–168. doi: 10.1016/j.diff.2009.06.002. - DOI - PubMed

Publication types