

Review
doi: 10.1021/cr400479b.
Metalloproteins containing cytochrome, iron-sulfur, or copper redox centers
Affiliations
- PMID: 24758379
- PMCID: PMC4002152
- DOI: 10.1021/cr400479b
Item in Clipboard
Review
Metalloproteins containing cytochrome, iron-sulfur, or copper redox centers
Chem Rev.
.
No abstract available
Figures
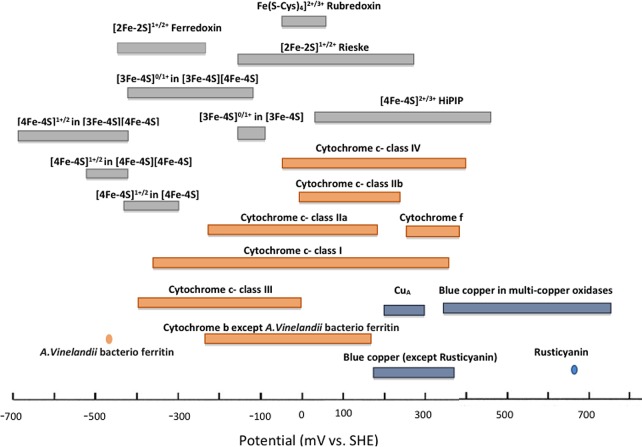
Reduction
potential range of redox centers in electron transfer
processes.
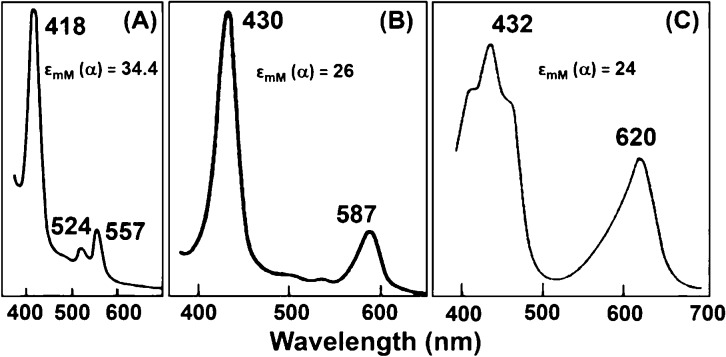
Representative pyridine
hemochromogen spectra of hemin cofactors:
(A) heme b, (B) heme a, and (C)
heme d1. The spectrum of pyridine ferrohemochrome c is similar to that of heme b. Reprinted
with permission from ref (116). Copyright 1992 Springer-Verlag.
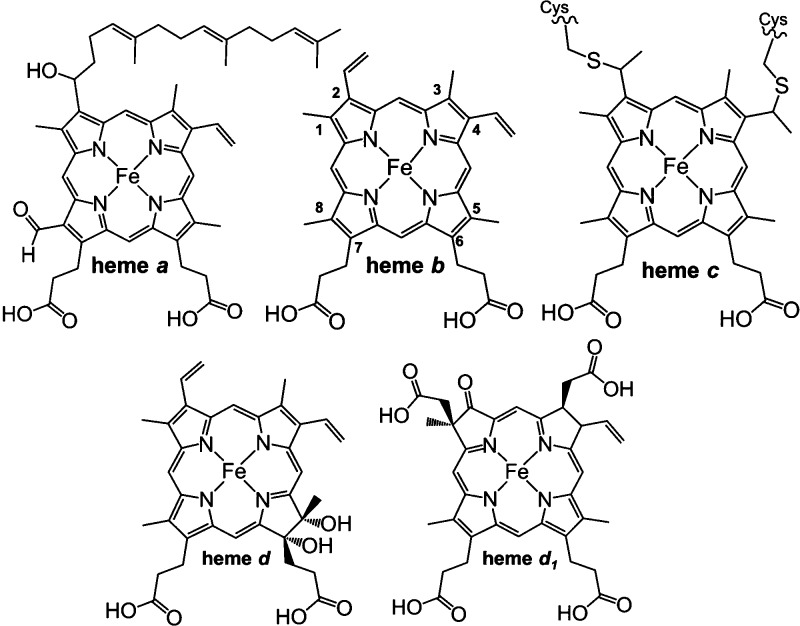
Different types of heme
found in cytochromes.
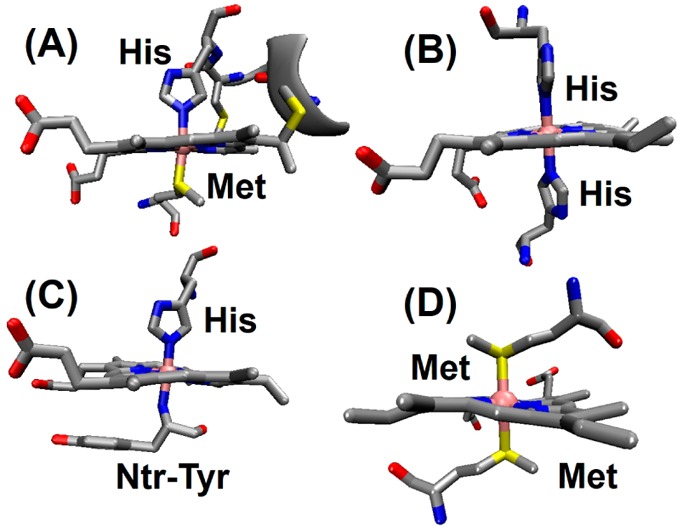
Commonly found heme axial ligands in various cytochromes. (A) Class
I cyts c (PDB ID 3CYT) uses His/Met axial ligation. (B) Cyts b and multiheme cyts c contain bis-His
ligation (bovine liver cyt b5, PDB ID 1CYO). (C) An unusual
His/amine ligation is found only in cyt f (PDB ID 1HCZ). (D) Bis-Met ligation
is encountered in bacterioferritin (PDB ID 1BCF). For c-type cytochromes
the conserved -Cys-Xxx-Xxx-Cys-His- ligation and its covalent linkage
to the heme via Cys residues are shown.
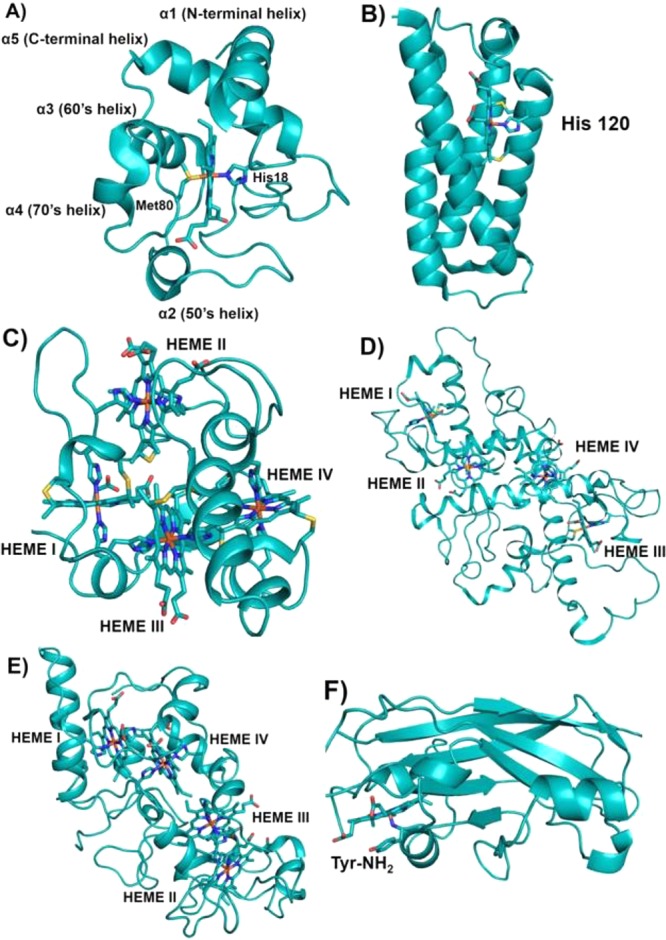
Schematic representations
of various classes of cyts c. (A) Class I cyt c fold with His/Met heme axial
ligands (PDB ID 3CYT). Mitochondrial designation of the helices is also shown. (B) Four-helix
bundle cyt c′ belongs to class II cyt c having a 5c heme with His120 as the sole axial ligand
(PDB ID 1E83). (C) Tetraheme cyt c3 belongs to class
III cyt c with bis-His ligation to all four hemes
(PDB ID 1UP9). Hemes I and III are attached to the protein via the highly conserved
-Cys-Xxx-Xxx-Cys-His- sequence, whereas hemes II and IV are covalently
bound to the protein by a -Cys-Xxx-Xxx-Xxx-Xxx-Cys-His- motif. In
(A)–(C) the covalent attachment of the heme to the protein
via Cys residues is shown. (D) Tetraheme cyt c from
the photosynthetic reaction center (RC) belongs to class IV cyt c. Hemes I, II, and III have His/Met axial ligands, while
heme IV has bis-His axial ligation to the heme iron (PDB ID 2JBL). (E) Cyt c554 from Nitrosomonas europaea belongs to a class of its own. Hemes I, III, and IV have bis-His-ligated
heme iron, whereas heme II is 5c with His as the only axial ligand
(PDB ID 1BVB). Heme numbering in (C)–(E) is according to their attachment
occurring along the protein’s primary sequence. (F) Cyt f from chloroplast is unique from all other classes of cytochromes
in that it mostly contains β-sheets and the heme is 6c with
a His and N-terminal backbone NH2 group of a Tyr residue
(PDB ID 1HCZ). It has been included as a subclass of cyt c because
the heme is covalently bound to the protein via the highly conserved
-Cys-Xxx-Xxx-Cys-His- signature motif for heme attachment ubiquitously
found in c-type cytochromes.
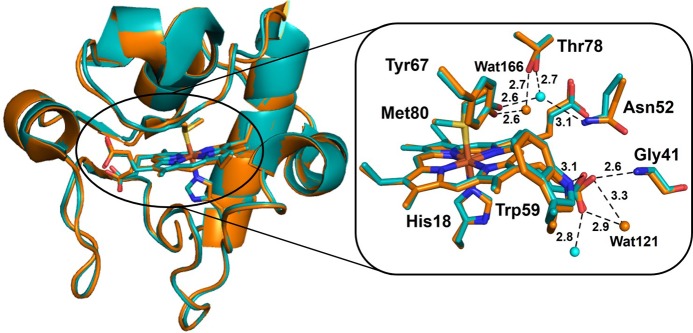
Overall structural overlay
of the reduced (cyan, PDB ID 1YCC) and oxidized (orange,
PDB ID 2YCC)
iso-1-cyt c (left). A close look at the heme site
and the nearby residues is shown on the right along with some hydrogen
bond interactions.

X-ray structure of cyt c-dependent NOR
(cNOR)
(PDB ID 3O0R) from Ps. aeruginosa.
Reprinted from ref (273). Copyright 1996 American
Chemical Society.
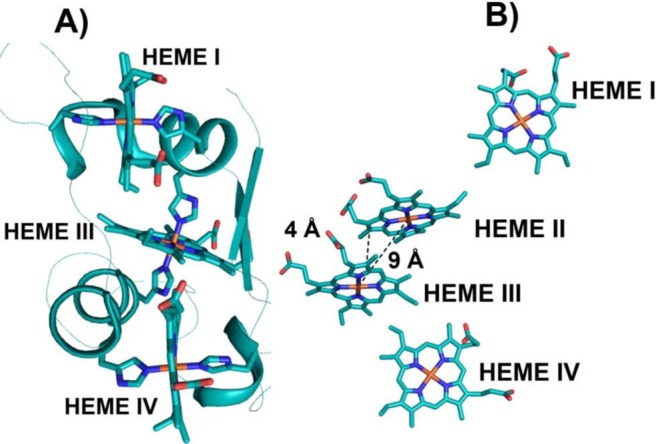
(A) X-ray structure of triheme cyt c7 (PDB ID 1HH5). All the hemes are bis-His-ligated. Cyt c7 is a minimized version of cyt c3 where heme II is missing. (B) Spatial arrangement of the
four hemes
in flavocytochrome c3 fumarate reductase
(PDB ID IQO8). The heme irons of the heme pair II and III are in close proximity
at 9 Å from each other, and the heme edges are 4 Å away.
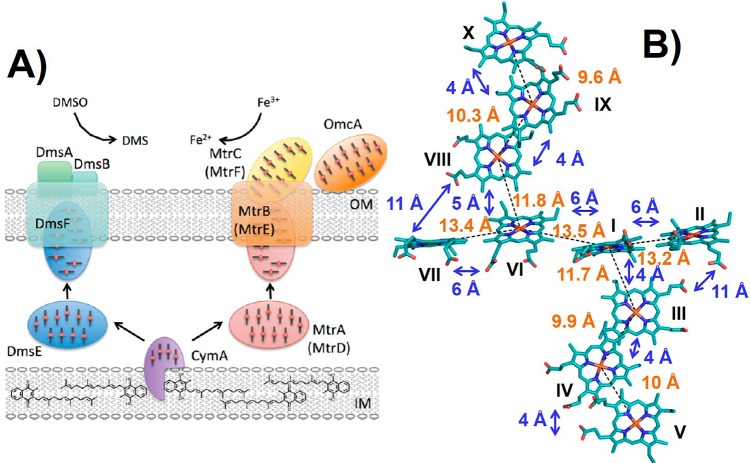
(A) Schematic model for DMSO reduction by DmsEFAB and
iron reduction
by MtrABC(DEF). Flows of electrons are shown with arrows. DmsE and
MtrA(D) are proposed to accept electrons from the menaquinone pool
via CymA. Multiheme groups in CymA, MtrACDF, and DmsE are shown. IM
= inner membrane, and OM = outer membrane. (B) “Staggered-cross”
orientation of the hemes in outer membrane decaheme MtrF (PDB ID 3PMQ). Heme numbering
is shown as Roman numerals, heme–iron distances are shown in
orange, and distances between heme edges are shown in blue. (A) Reprinted
with permission from ref (315). Copyright 2012 Biochemical Society. (B) Adapted from ref (316) Copyright 2011 National
Academy of Sciences.
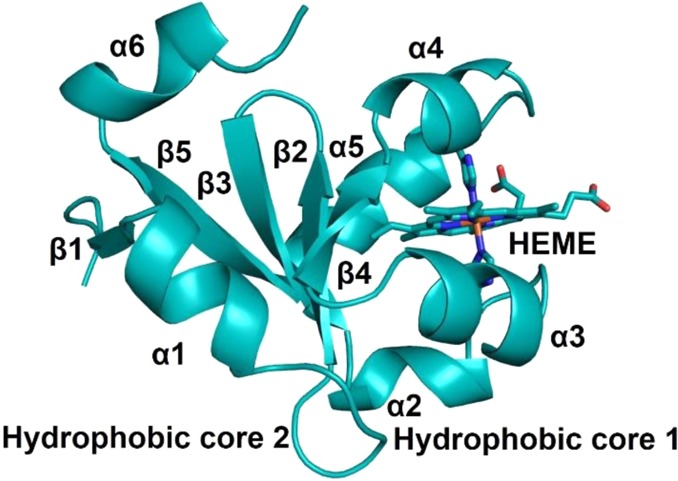
Schematic representation of the X-ray structure
of bovine cyt b5 that belongs to the α
+ β class
(PDB ID 1CYO). Two hydrophobic core domains, six α-helices, five β-strands,
and 6c bis-His-ligated heme are shown. Adapted from ref (357). Copyright 2011 American
Chemical Society.
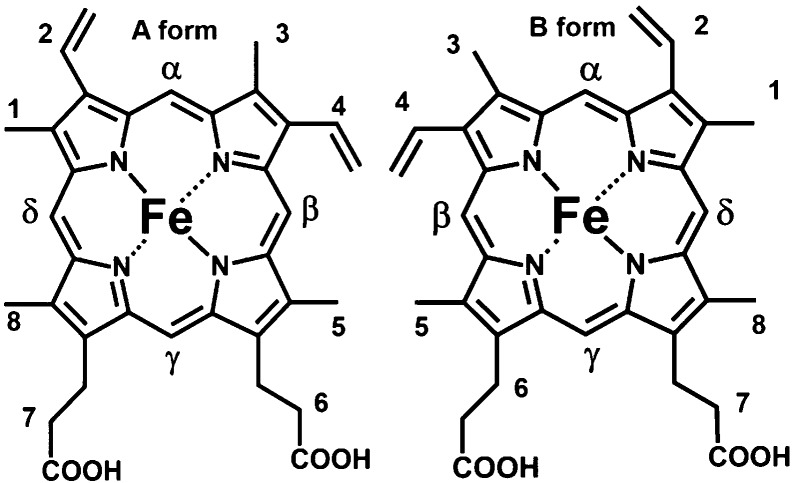
Two orientation isomers (A and B forms) of heme observed in solution
studies of the soluble fragment of cyt b5. The two isomers are related by a 180° rotation around the
α,γ-meso-carbon atoms.
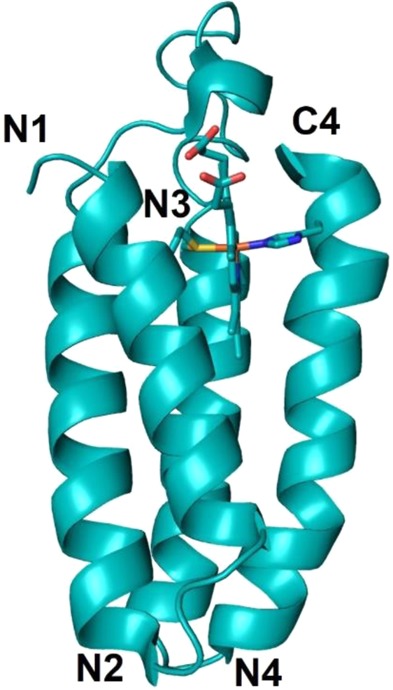
NMR structure of the
antiparallel four-helix bundle cyt b562 (PDB ID 1QPU). His/Met axial coordination to the heme
iron is shown.
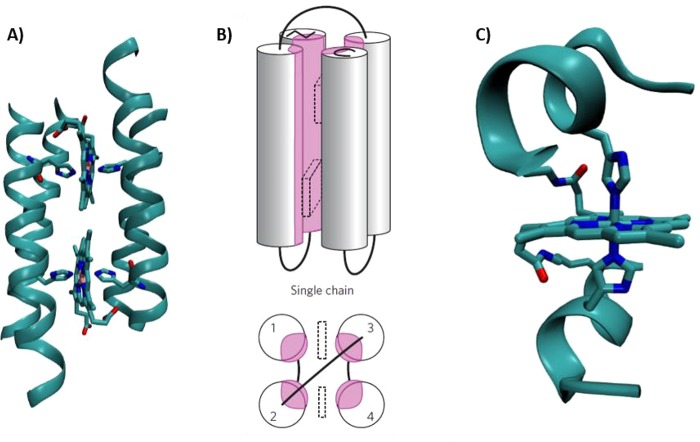
Structural models of designed cytochrome models
in de novo scaffolds.
(A) A design model for a homodimeric four-helix tetraheme binding
protein inspired by cyt bc1. Remade from
coordinates courtesy of G. Ghirlanda and W. F. DeGrado. (B) Schematic representation of monomeric four-α-helix
maquettes used to mimic ET cytochromes. Reprinted with permission
from ref (406). Copyright
2013 Macmillan Publishers Ltd. (C) Crystal structure of Co(II) mimichrome
IV (PDB 1PYZ).
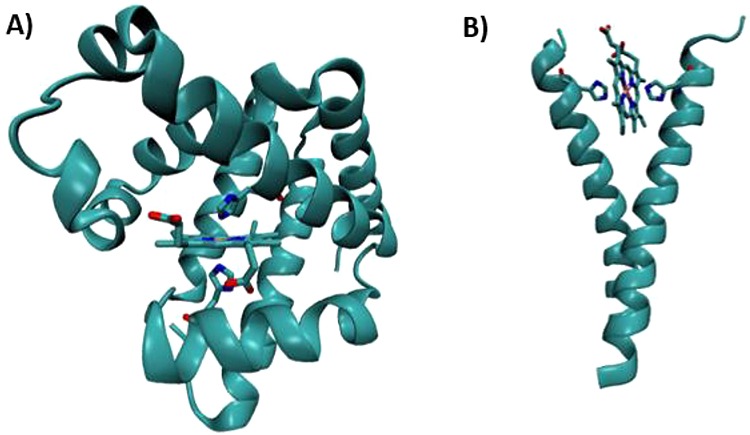
Structural
models of designed cytochrome models in native scaffolds.
(A) X-ray crystallographic model of a pig myoglobin designed to have
cytochrome-like bis-His ligation (PDB ID 1MNI). (B) Molecular
dynamics model of a histidine mutant of the membrane protein, glycophorin
A, designed to bind heme in a cytochrome-like manner. Coordinates provided by courtesy of G. Ghirlanda.
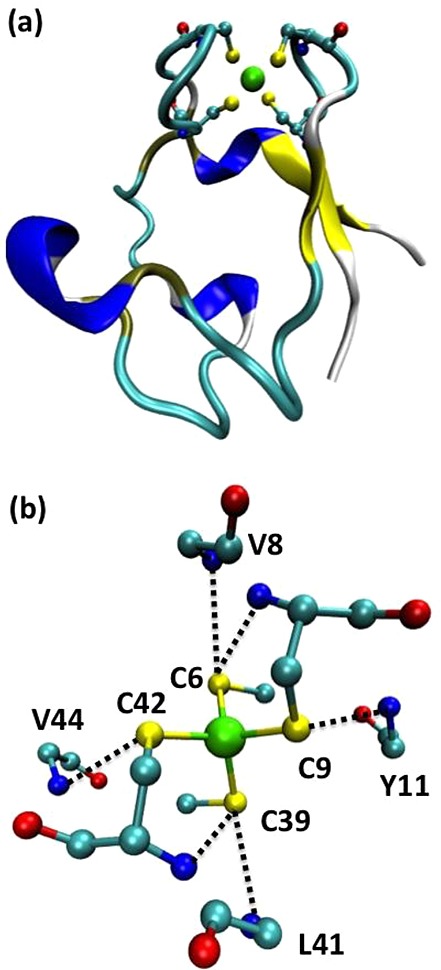
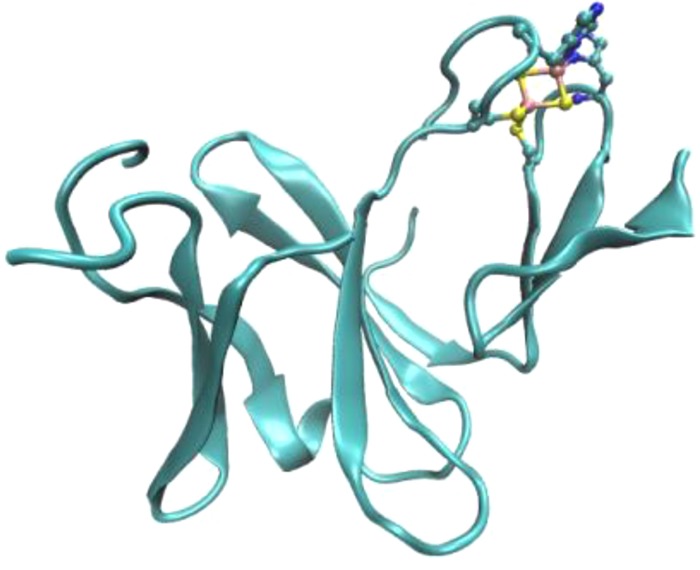
Crystal structure of CpRd (PDB ID 1IRO) at 1.1 Å resolution.
(a) Overall fold of chain A of CpRd. The Fe(Cys)4 center is displayed as a ball-and-stick representation. (b)
NH···S H-bond interactions around the Fe(Cys)4 center of CpRd. The side chains of C6, C39, V8,
Y11, L41, and V44 are omitted for clarity. Color code: Fe, green;
C, cyan; S, yellow, O, red; N, blue.
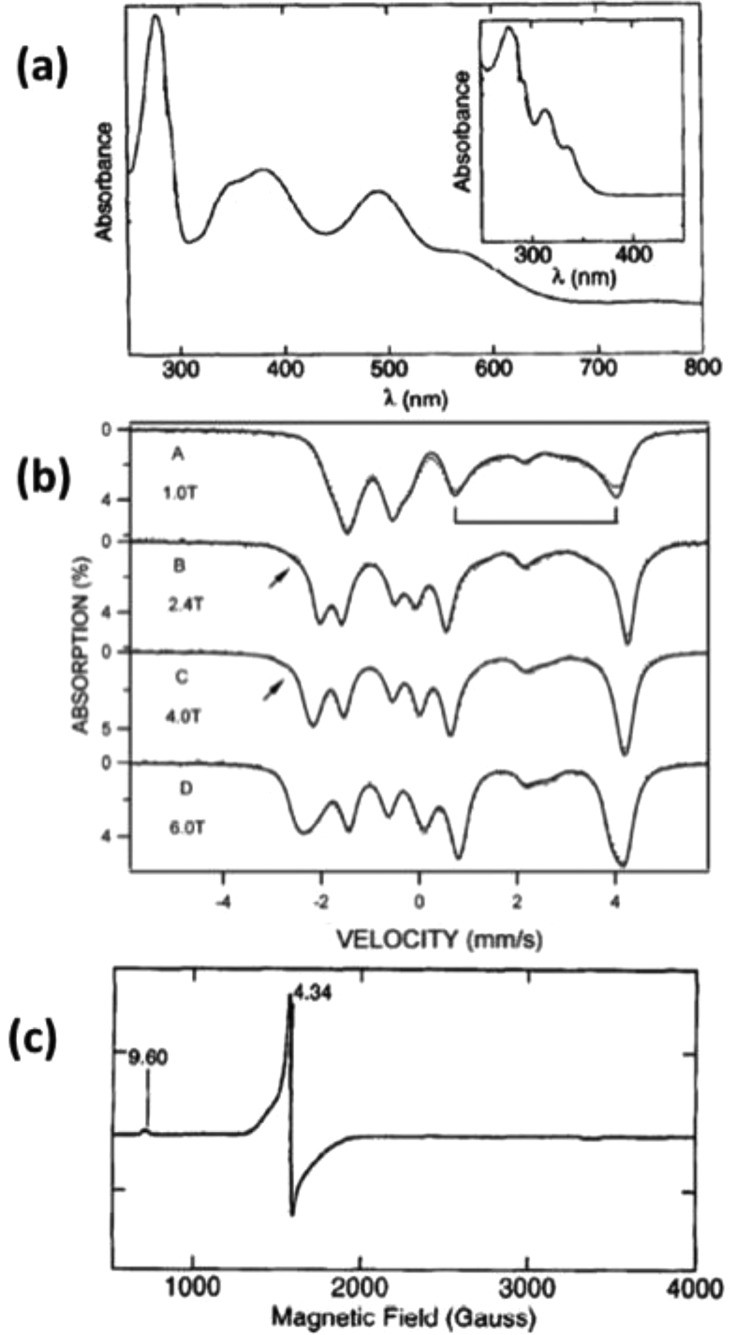
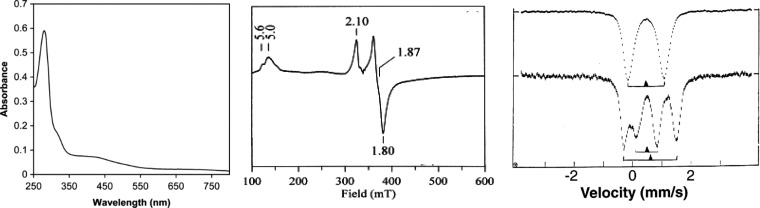
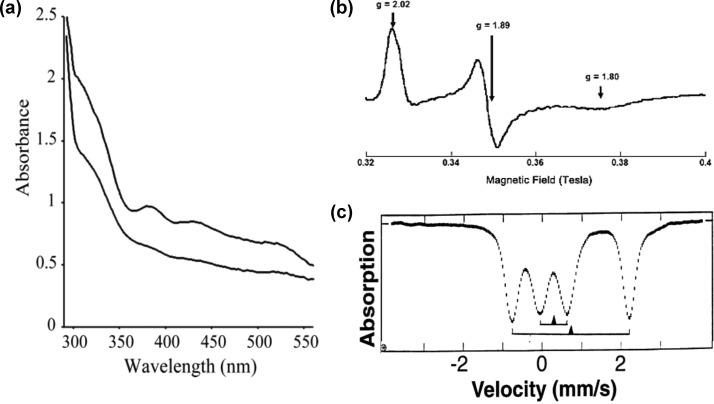
Representative spectra of rubredoxins. (a) UV–vis spectra
of ferric and ascorbate reduced ferrous (inset) CpRd. (b) Mössbauer spectra of dithionite reduced ferrous CpRd measured at 4.2 K under a magnetic field applied parallel
to the γ-rays. Reprinted from ref (623). Copyright 2002 American Chemical Society.
(c) EPR spectra of CpRd. Reprinted with permission
from ref (611). Copyright
1996 Elsevier.
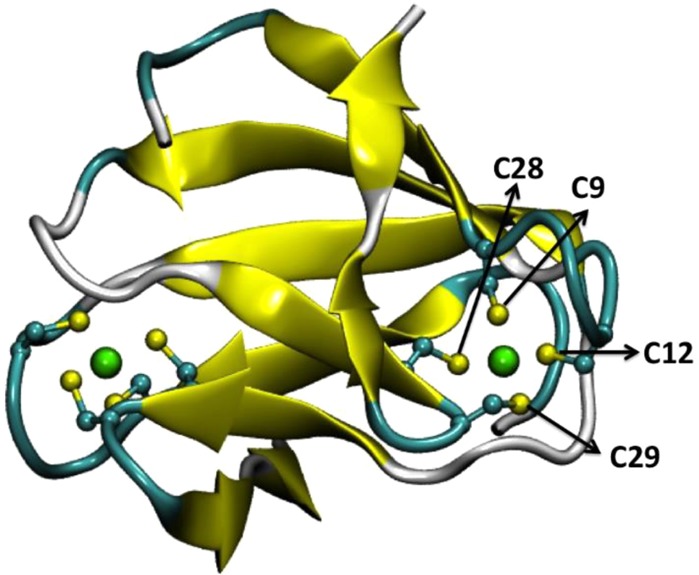
Crystal structure of
desulforedoxin from Dv. gigas (PDB
ID 1DXG). The
[FeCys4] centers are displayed in ball-and-stick
mode and denoted. The backbones of coordinating cysteines are omitted
for clarity. Color code for the ball-and-stick mode: cyan, carbon;
green, iron; yellow, sulfur.
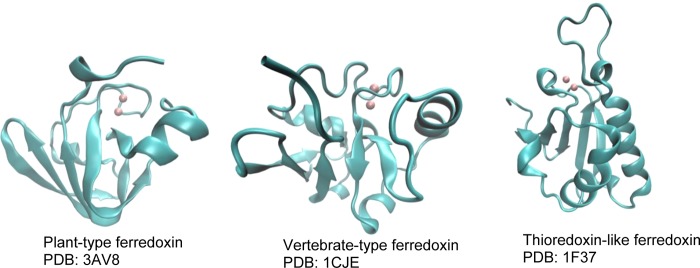
Structures of three
classes of [2Fe–2S] ferredoxins. Notice
that, in their physiological form, thioredoxin-like ferredoxins function
as a dimer.
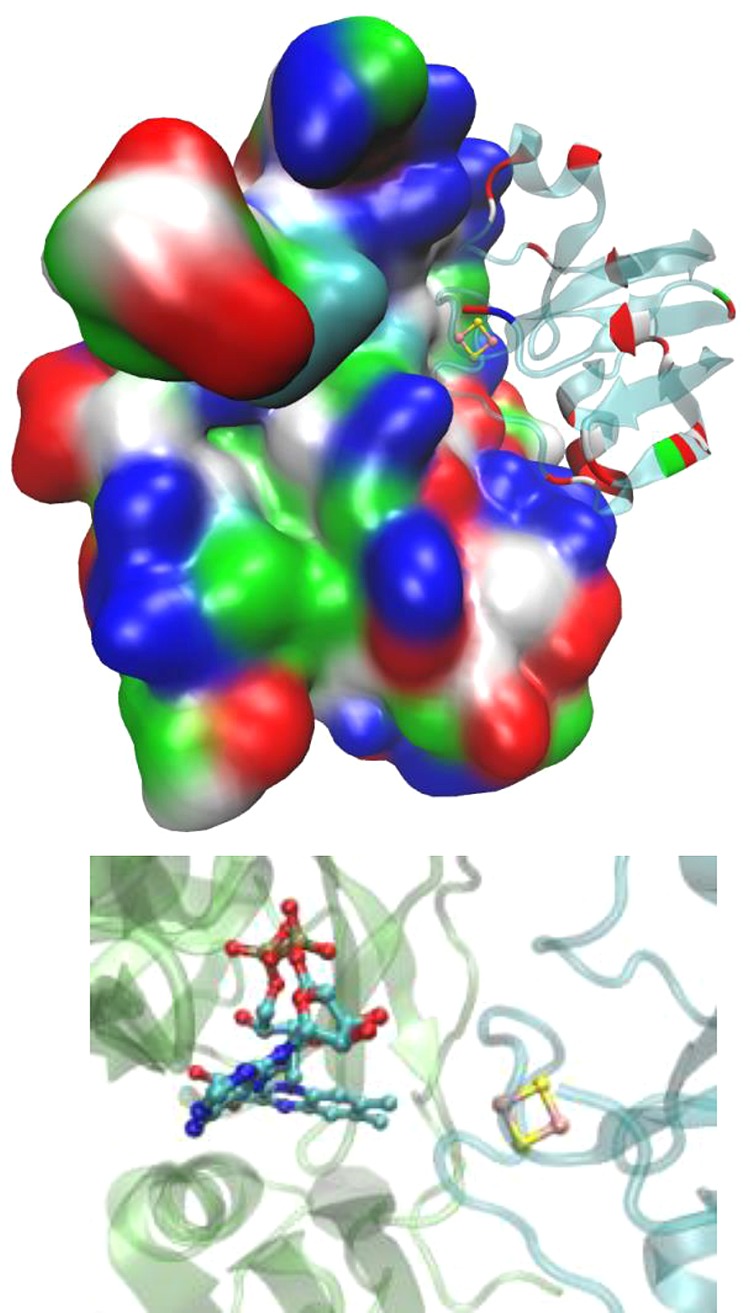
Structure of ferredoxin (right) cross-linked
to FNR (left), PDB
ID 3W5U. As
shown, red acidic patches of ferredoxin are positioned in contact
with blue basic residues of FNR. A zoomed-in figure of the region
containing the cofactors (Fe–S and FAD) is shown at the bottom.
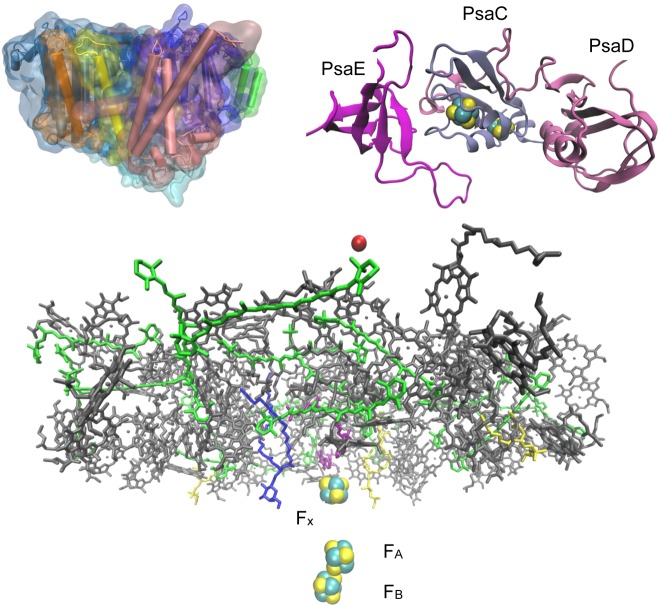
Structure of PSI (PDB ID 1JB0). The top left figure shows the overall
structure,
and the bottom figure shows all the cofactors in the system. The top
right figure shows the PsaC, PsaD, and PsaE sites with FA and FB. Ferredoxin binds in the interface between PsaC,
PsaD, and PsaE.
Structure of adrenodoxin
(right) in complex with adrenodoxin reductase
(left) (PDB ID 1E6E). As shown, red acidic patches of adrenodoxin are positioned against
blue basic residues of adrenodoxin reductase. A zoom-in region of
the cofactors (Fe–S and FAD) is shown at the bottom.
H-bonding
network in plant-type ferredoxins.
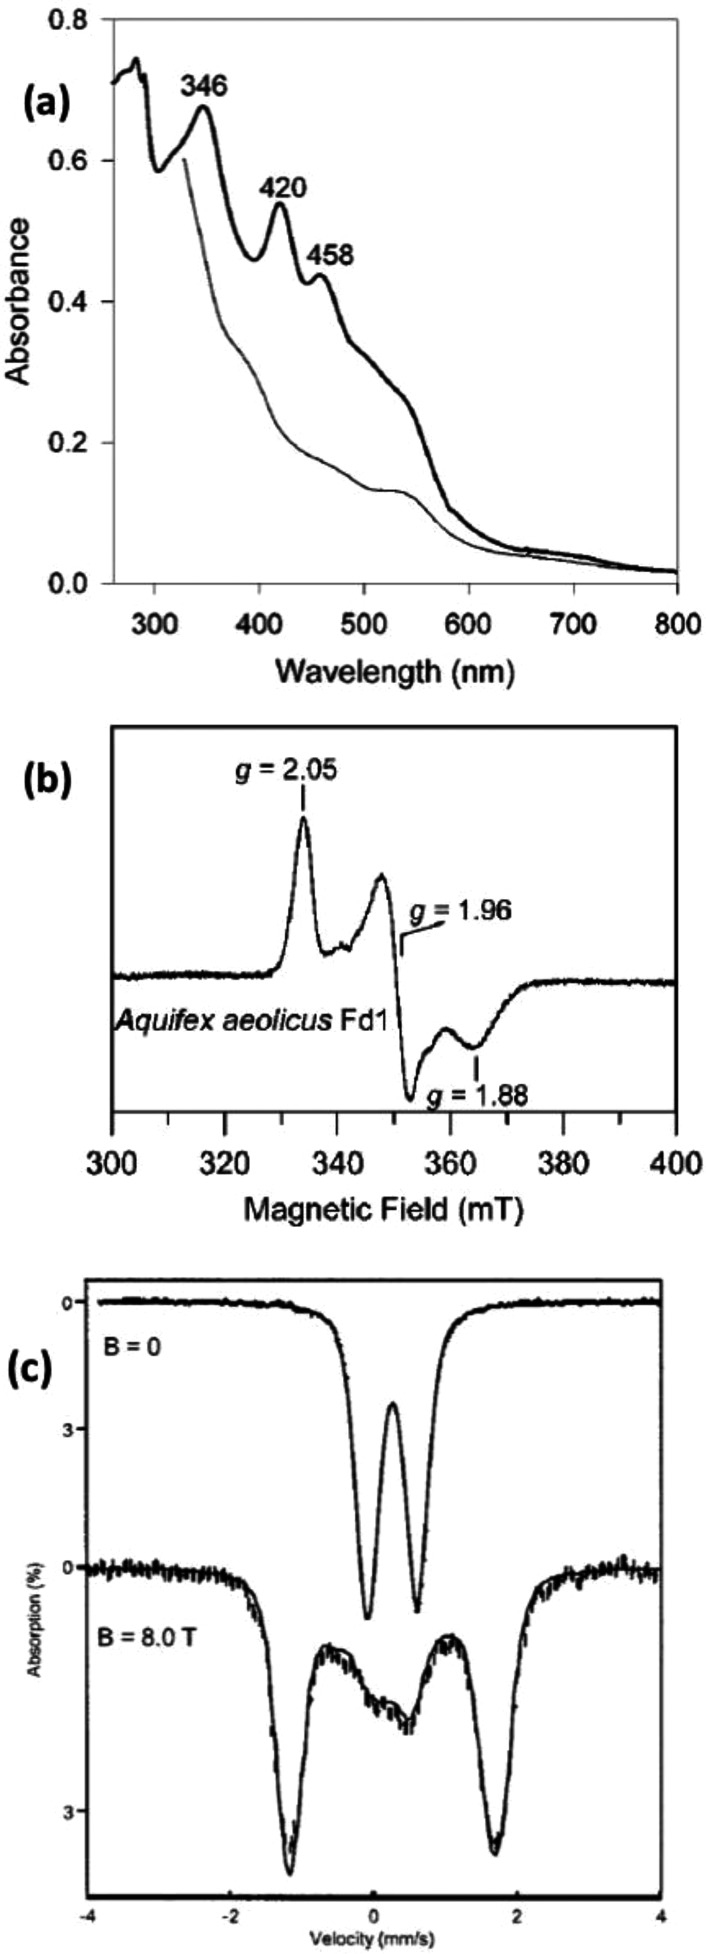
Representative spectra
of [2Fe–2S] ferredoxins: (a)
UV–vis spectra of reduced (thin
line) and oxidized (thick line) forms of ferredoxin from Aquifex aeolicus; (b) X-band EPR of [2Fe–2S]+ ferredoxin from Aq. aeolicus at 20 K; (c) Mössbauer of the [2Fe–2S]2+ state of ferredoxin from Aq. aeolicus at 4.2 K in zero field (upper) and an 8.0 T applied field parallel
to the observed γ radiation (lower). Reprinted from ref (728). Copyright 2002 American
Chemical Society.
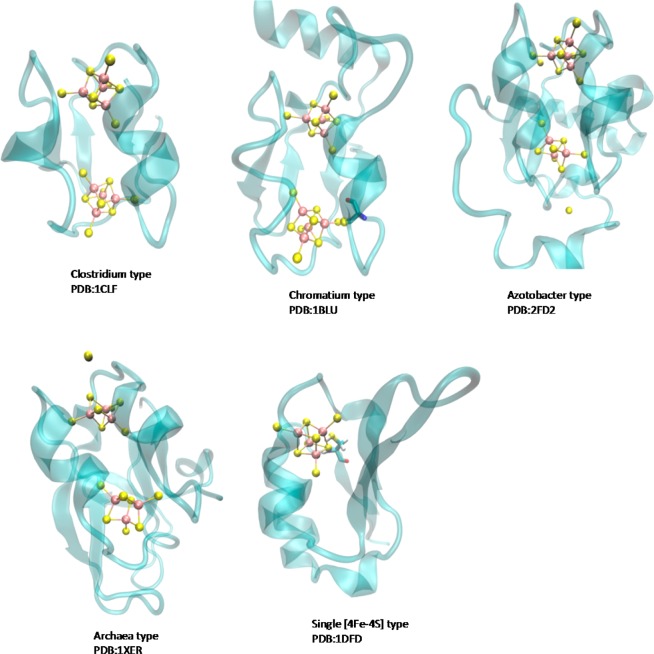
Structures of the five
classes of two-subunit ferredoxins.
Consensus sequences
in ferredoxins. Reprinted with permission from
ref (740). Copyright
2007 University Science Books.
Representative spectra of [4Fe–4S] proteins.
(a, left) UV–vis
of the oxidized form. Reprinted with permission from ref (760) Copyright 2005 Springer-Verlag.
(b, middle) EPR of the [4Fe–4S]1+ state. Reprinted
with permission from ref (761). Copyright 1999 Elsevier. (c, right) Mössbauer of
the [4Fe−4S]2+ cluster of the E.
coli FNR protein, T = 4.2 K (top),
and the [4Fe−4S]1+ cluster of E.
coli sulfite reductase, T = 110 K
(bottom). Reprinted with permission from ref (529). Copyright 1997 American
Association for the Advancement of Science.
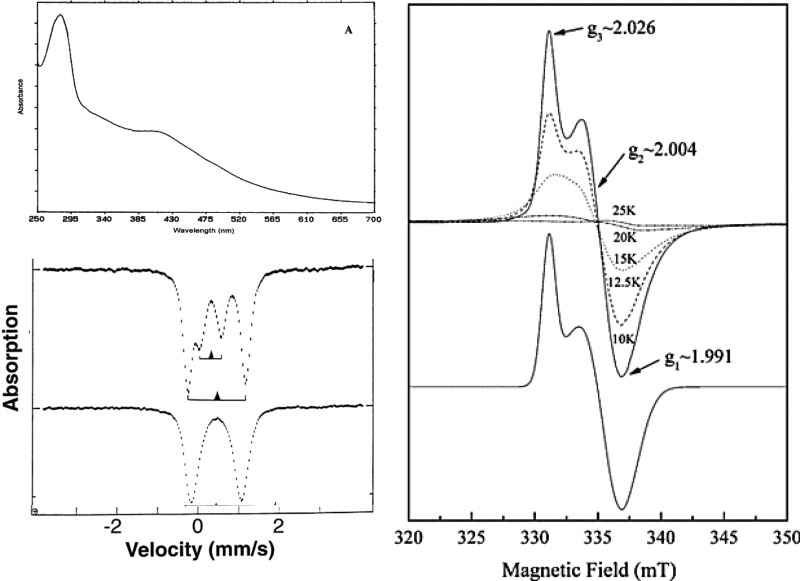
Representative spectra of the [3Fe–4S] cluster. (a, left
top) UV–vis of the oxidized form and (b, right) temperature-dependent
EPR of the [3Fe–4S]1+ cluster. Reprinted with permission
from ref (762). Copyright
2002 Elsevier. (c, left bottom) Mössbauer of the [3Fe–4S]1+ (top) and [3Fe–4S]0 (bottom) clusters
. Reprinted with permission from ref (529). Copyright 1997 American Association for the
Advancement of Science.
Minimal Rieske fold with three β-sheets and loops coordinating
the [2Fe–2S] cluster with two His ligands and two Cys ligands
(from PDB ID 1NDO).
Structure of the bc1 complex from chicken
(PDB ID 3H1J) and its Rieske protein and Rieske center (left) and structure of
the b6f complex from Mastigocladus laminosus (PDB ID 1VF5) and its Rieske
protein and Rieske center (right).
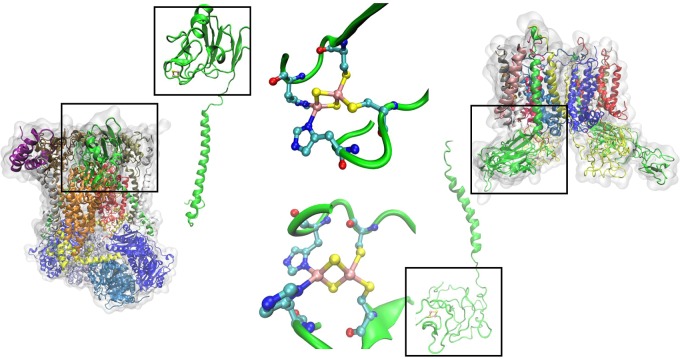
Structure of naphthalene
1,2-dioxygenase (PDB ID 1NDO), the archetype
of Rieske-type proteins from two different views, and a close-up of
the active site Rieske center.
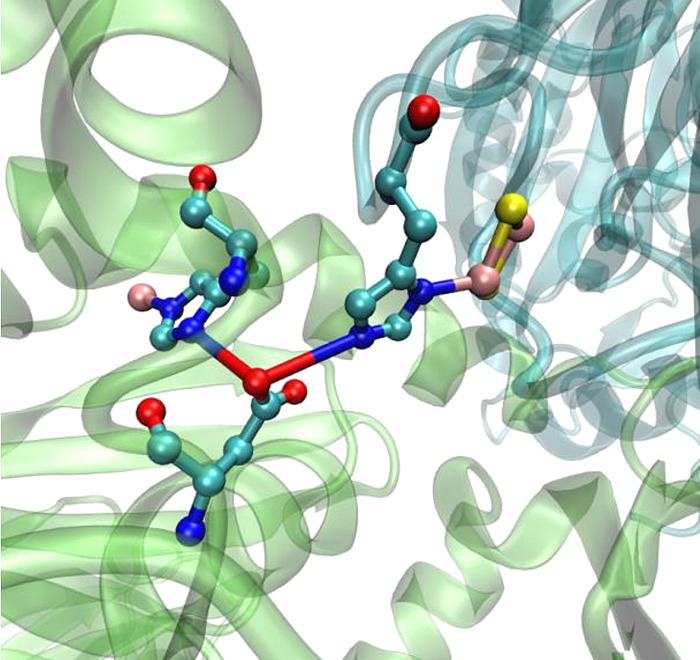
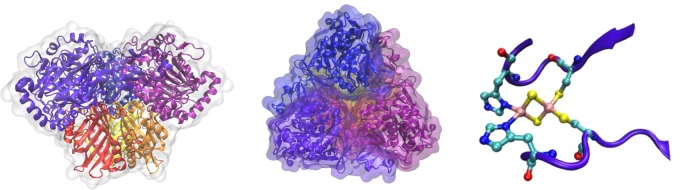
Interface between two monomers of naphthalene dioxygenase, NDO.
Asp205 from the polypeptide chain on the left bridges two His residues
that are ligands to the Fe–S cluster and catalytic nonheme
iron center (PDB ID 1NDO).
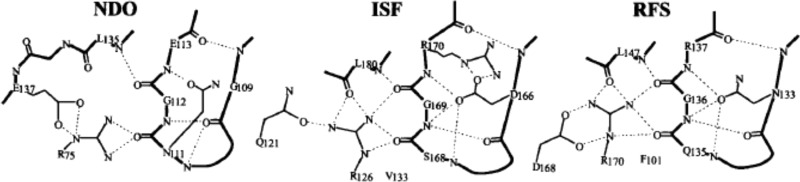
Differences in the H-bond pattern between the
Rieske fragment of
naphthalene dioxygenase, NDO (PDB ID 2NDO), the water-soluble Rieske fragment of
the bc1 complex, ISF (PDB ID 1RIE), and the Rieske
fragment from the b6f complex, RFS (PDB ID 1RFS). Reprinted with permission from ref (773). Copyright 1999 Elsevier.
Representative spectra of Rieske centers. (a) UV–vis of
the reduced (lower spectrum) and oxidized (upper spectrum) forms.
Reprinted with permission from ref (866). Copyright 2004 National Academy of Sciences.
(b) EPR of the reduced form. Reprinted with permission from ref (867). Copyright 2007 National
Academy of Sciences. (c) Mössbauer of the [2Fe−2S]+ cluster of the Rieske protein from Ps. mendocina at T = 200 K. Reprinted with permission from ref (529). Copyright 1997 American
Association for the Advancement of Science.
Structure of reduced
(PDB ID 1HRR) and oxidized (PDB ID 1NER) HiPIP from Ch. vinosum (top left and top right, respectively).
The overlay of the structures and zoom-in of the Fe–S cluster
are shown at the bottom. As shown, only slight structural changes
occurred upon reduction.
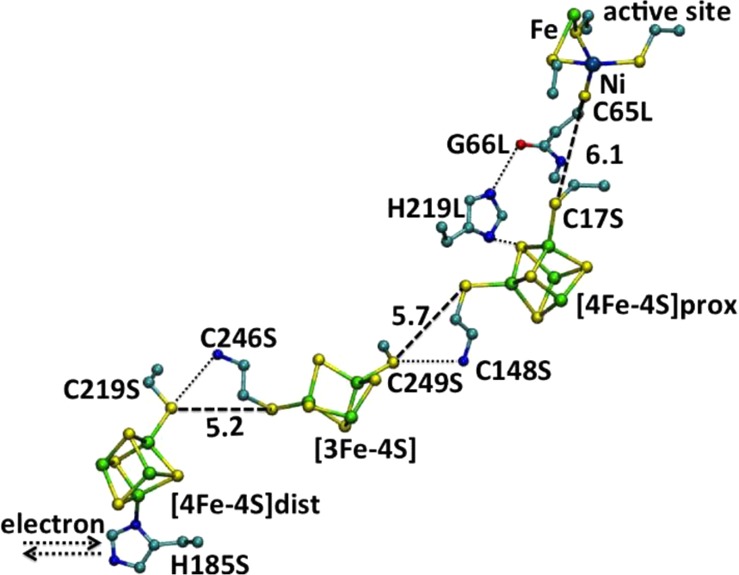
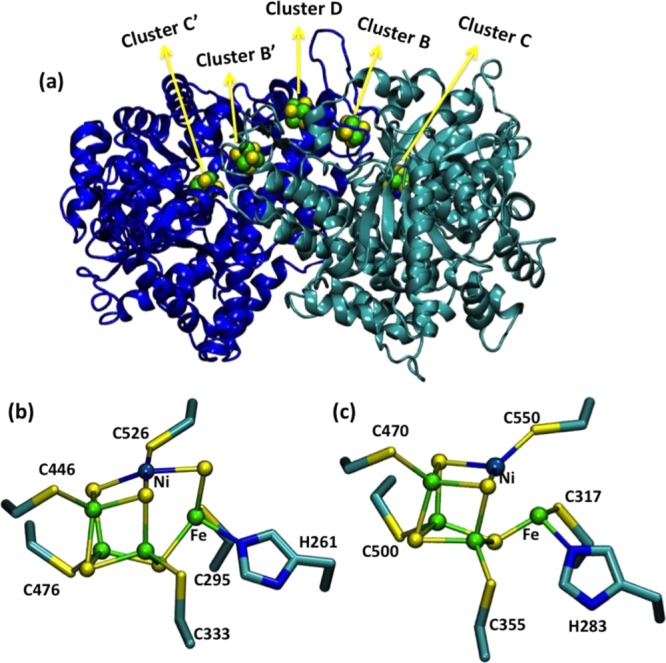
Proposed ET pathway
in Dv. gigas [NiFe] hydrogenase. Selected
distances are given in angstroms. PDB
ID 1FRV. Color
code: Fe, green; Ni, gray blue; C, cyan; S, yellow, O, red; N, blue.
Reprinted with permission from ref (940). Copyright 1995 Macmillan Publishers Ltd.
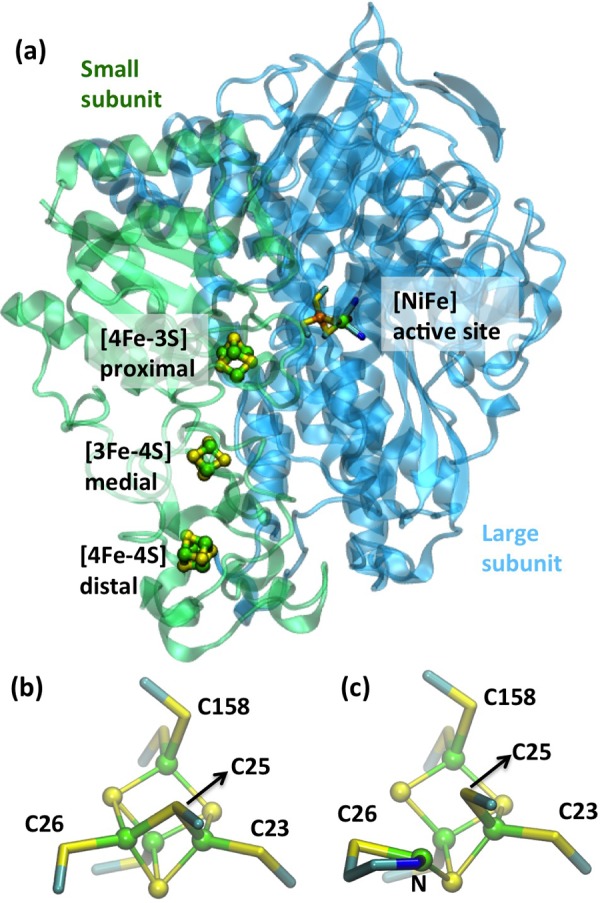
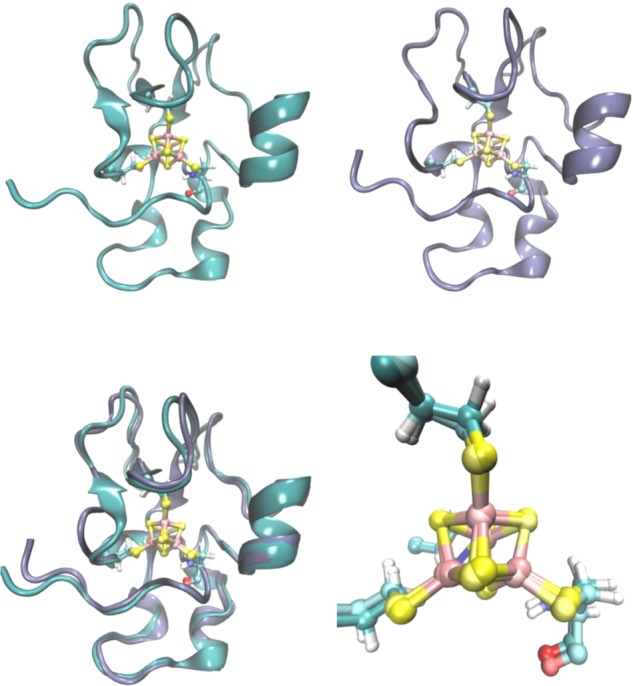
(a) Crystal structure of O2-tolerant membrane-bound
hydrogenase from Ralstonia eutropha (PDB ID 3RGW). Reprinted from ref (945). Copyright 2013 American Chemical Society. (b) Reduced
[4Fe–3S] cluster from MBH (PDB ID 3AYX) (Reprinted with permission from ref (946). Copyright 2012 Wiley-VCH)
and (c) oxidized [4Fe–3S] cluster from MBH (PDB ID 3AYZ). Reprinted with
permission from ref (946). Copyright 2012 Wiley-VCH. Color code: Fe, green; C, cyan; S, yellow;
N, blue; Ni, orange.
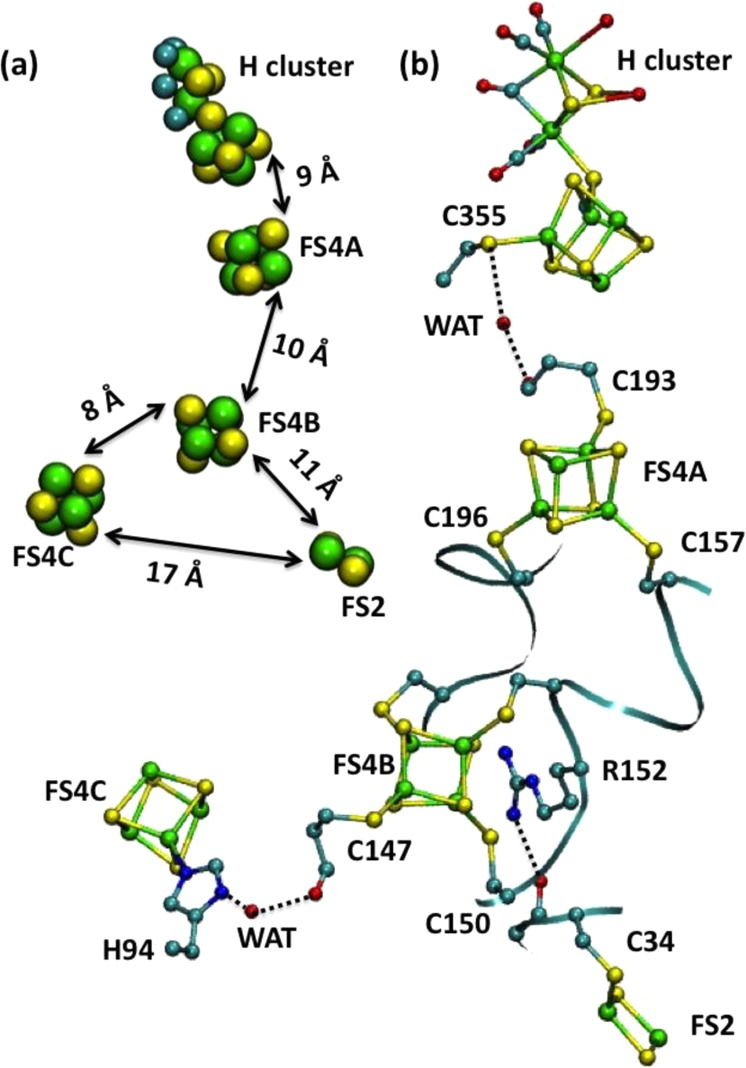
(a) Location of Fe–S clusters
in [FeFe] hydrogenase (PDB
ID 1FEH). (b)
Proposed ET pathways for [FeFe] hydrogenase. Reprinted with permission
from ref (958). Copyright
1998 American Association for the Advancement of Science.
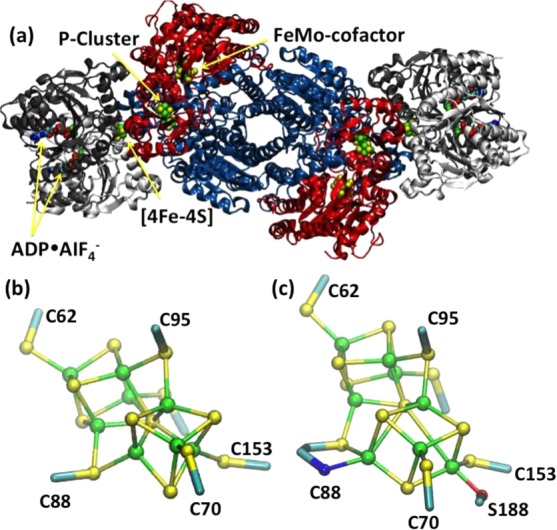
(a) Overall structure of nitrogenase (PDB ID 1N2C). Cofactors are
shown as spheres and denoted. Reprinted with permission from ref (965). Copyright 1997 Macmillan
Publishers Ltd. (b) Reduced P cluster from nitrogenase (PDB ID 3U7Q) (Reprinted with
permission from ref (946). Copyright 2012 Wiley-VCH.) and (c) oxidized P cluster from nitrogenase
(PDB ID 2MIN). Reprinted with permission from ref (946). Copyright 2012 Wiley-VCH.
(a) Crystal structure of Rs. rubrum Ni CODH. Clusters are shown as spheres. PDB ID 1JQK. (b) [4Fe–5S–Ni]
cluster C of Ca. hydrogenoformans Ni
CODH. PDB ID 1SU8. (c) [4Fe–4S–Ni] cluster C of M. thermoacetica Ni CODH. PDB ID 1MJG. Reprinted with permission from ref (990). Copyright 2011 Elsevier.
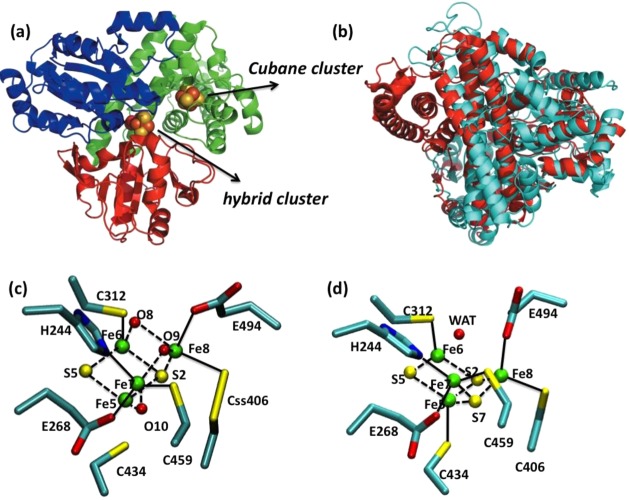
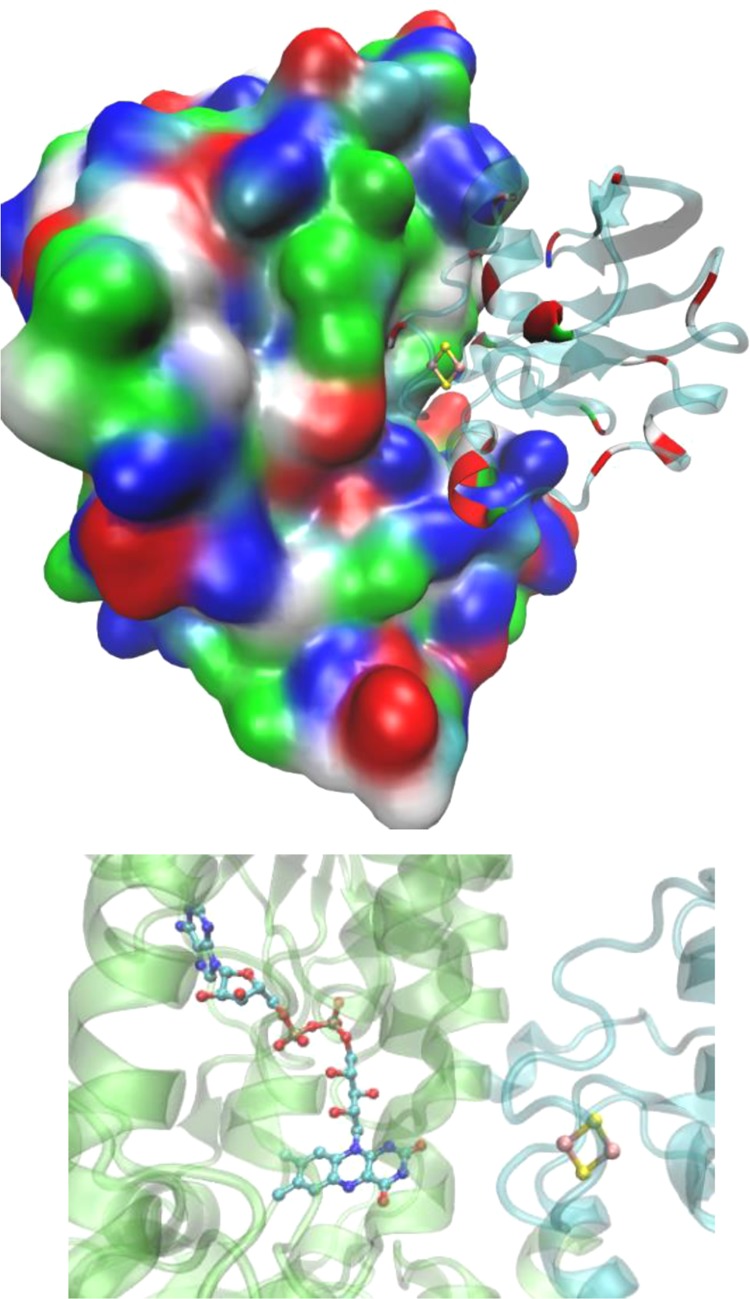
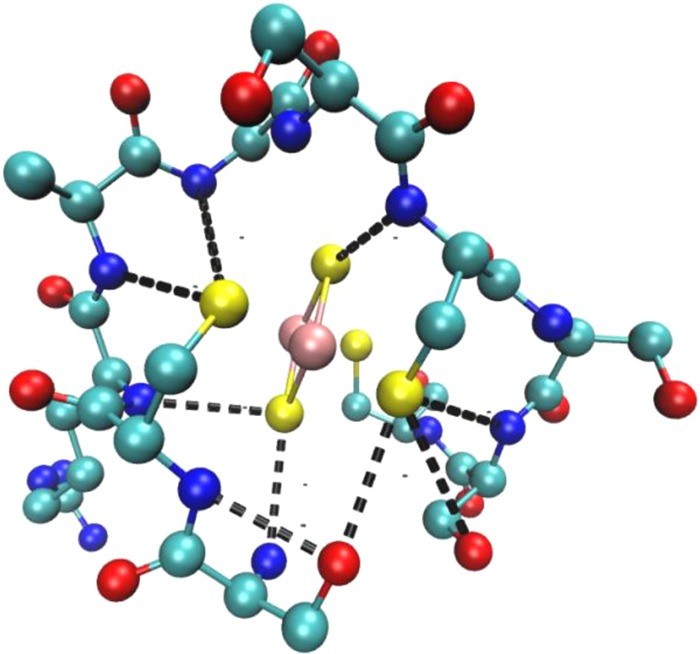
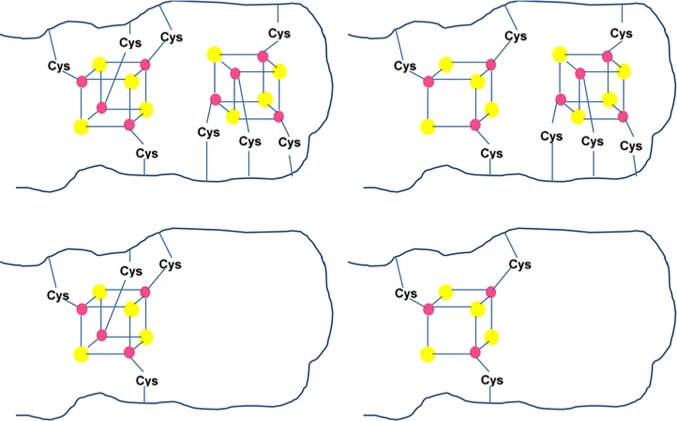
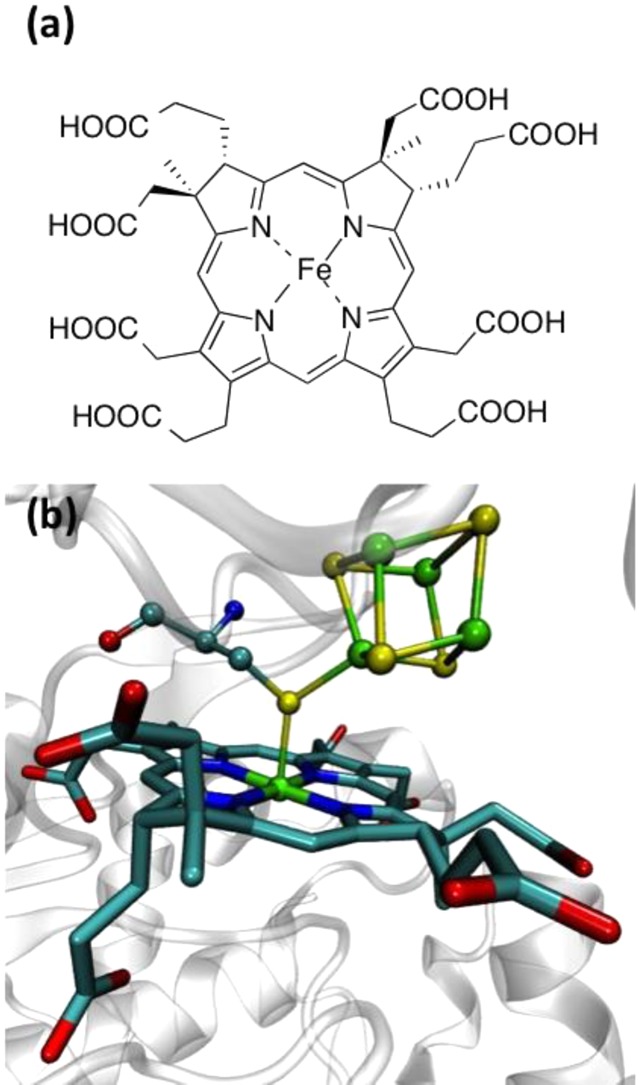
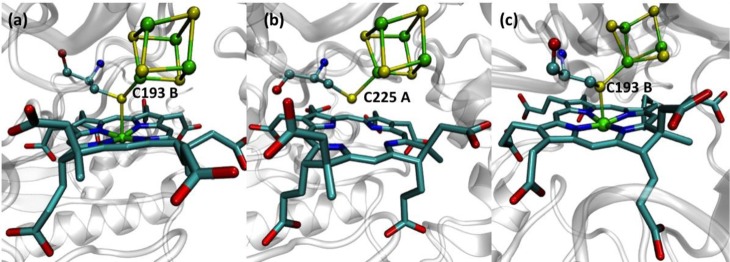
Hybrid clusters in HCP.
(a) Overall structure of as-isolated Dv. vulgaris HCP. Metal clusters are shown as spheres.
PDB ID 1W9M.
(b) Superposition of Dv. vulgaris HCP
(cyan) and NiCODH (red, PDB code 1SU7). (c) Hybrid cluster in the as-isolated
oxidized form of Dv. vulgaris HCP prepared
anaerobically. PDB ID 1W9M. (d) Hybrid cluster in the reduced form of Dv. vulgaris HCP. PDB ID 1OA1. Residue backbones are omitted for clarity.
Bonds inside the cluster are shown as dotted lines, and bonds between
residues and the cluster are shown as solid lines. Color code: Fe,
green; C, cyan; S, yellow; O, red; N, blue. Reprinted with permission
from ref (995). Copyright
2008 International Union of Crystallography.
(a) Structure of siroheme.
(b) Siroheme and the [4Fe–4S]
cluster of spinach nitrite reductase. PDB ID 2AKJ. Color code: Fe,
green; C, cyan; S, yellow; O, red; N, blue.
(a) Siroheme group and
[4Fe–4S] cluster of DsrI. PDB ID 3OR1. (b) Sirohydrochlorin
group and [4Fe–4S] cluster of DsrII. PDB ID 3OR2. (c) Siroheme group
and [3Fe–4S] cluster of DsrII. PDB ID 3OR2. Color code: Fe,
green; C, cyan; S, yellow; O, red; N, blue.
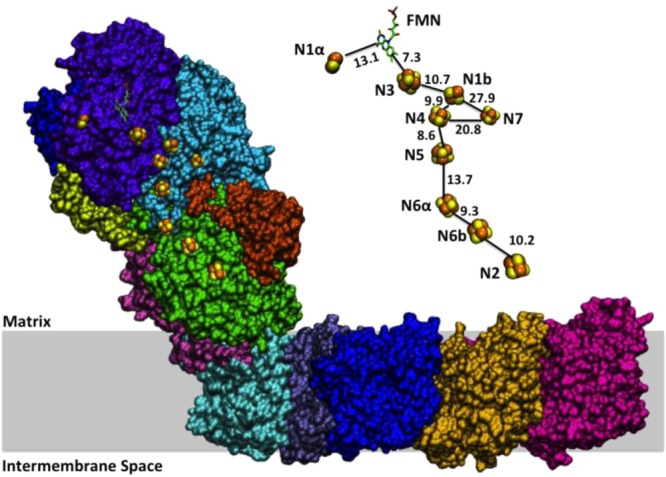
Crystal structure of mitochondrial respiratory complex
I from T. thermophilus. PDB ID 4HEA. Cofactors involved
in the ET pathway
are shown on the right side with distances and directions denoted.
Reprinted with permission from ref (1022). Copyright 2013 Elsevier.
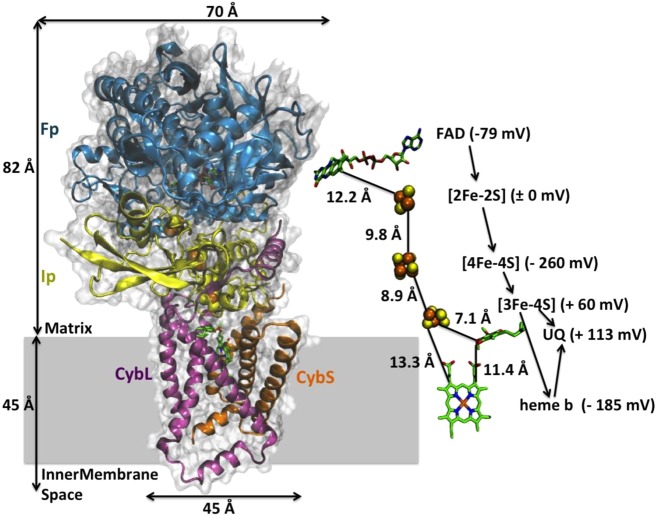
Crystal structure of mitochondrial respiratory
complex II. FAD
binding protein (Fp) is shown in blue, iron–sulfur protein
(Ip) is shown in cream, hydrophobic domains are shown in pink and
orange, and the putative membrane is shown in gray shading. PDB ID 1ZOY. Cofactors involved
in the ET pathway are shown on the right side, with distances, reduction
potential, and directions denoted. Reprinted with permission from
ref (1024). Copyright
2005 Elsevier.
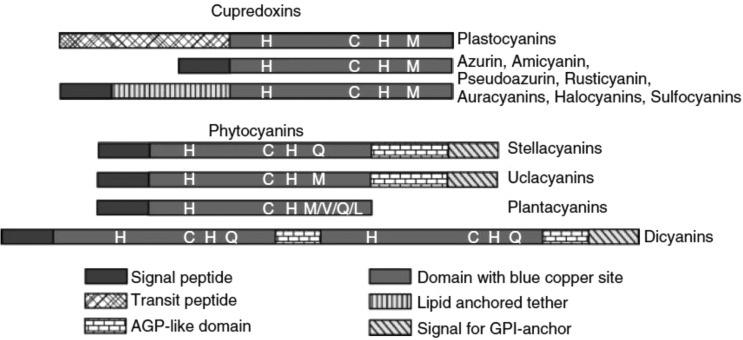
Domain arrangement of type 1 copper protein. Reprinted with permission
from ref (1119). Copyright
2006 Wiley-VCH.
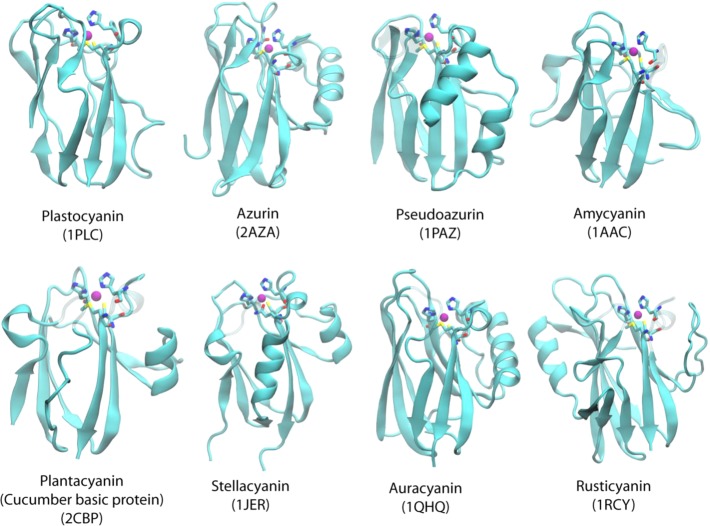
Crystal structures of the T1 copper proteins. The secondary
structure
(α-helix and β-sheet) is shown in cartoon format, copper
is shown as a purple ball, and ligands are shown in stick format.
The name of the protein and its PDB ID are given below each structure.
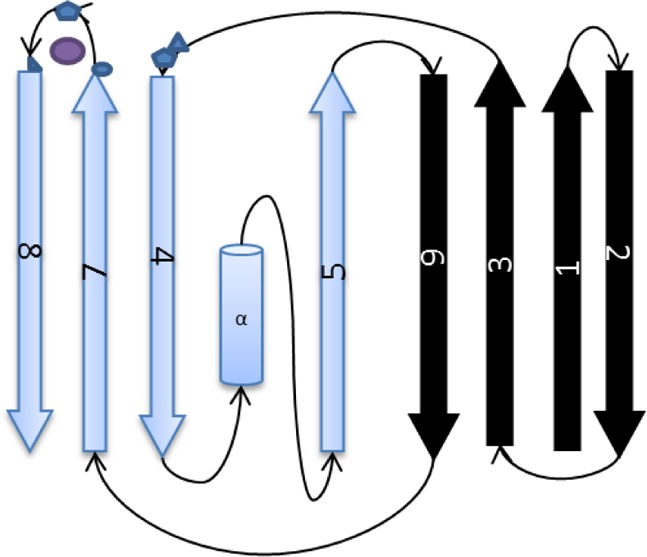
Topology diagram showing the scheme of
the secondary structure
of azurin. β-Strands are shown as arrows, and the α-helix
is shown as a cylinder. Copper ligands between β-strands 3 and
4 and between β-strands 7 and 8 are shown as blue polygons,
while copper is shown as a purple circle.
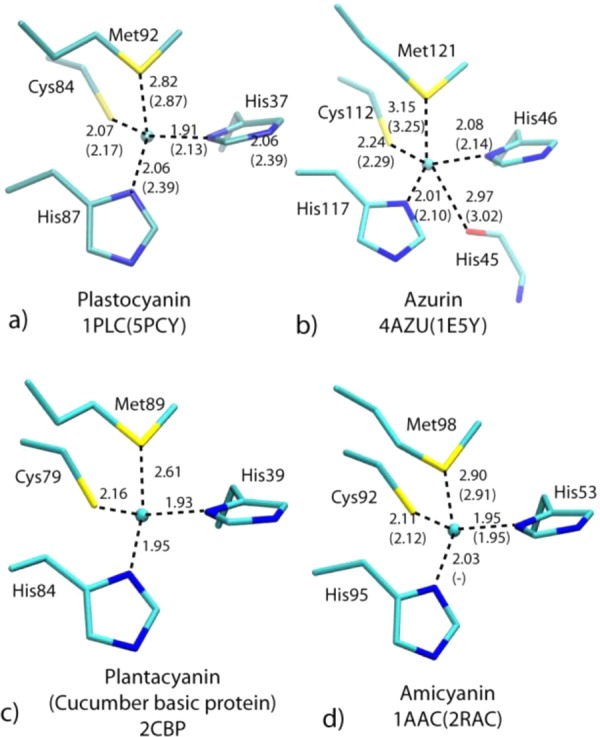
T1 copper
centers in plastocyanin, azurin, plantacyanin, and amicyanin.
Reprinted with permission from ref (1119). Copyright 2006 Wiley-VCH.
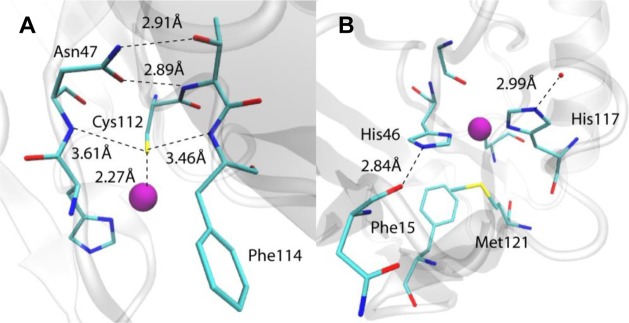
H-bonding around Cys112 (A) and other ligands
(B) of azurin. PDB
ID 4AZU.
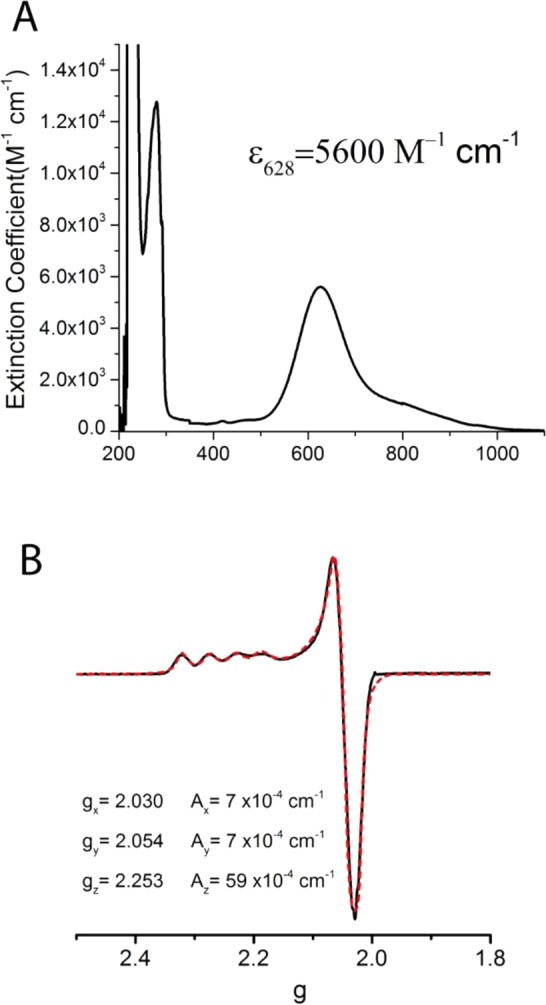
Electronic absorption (A) and EPR (B) spectra
of azurin.
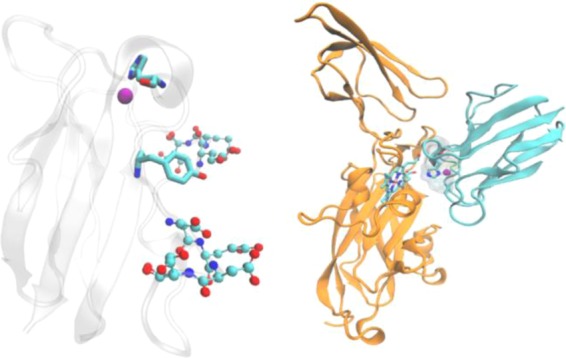
Structures of plastocyanin
(left) and the complex of plastocyanin
and cyt f (right). Left: copper ion is represented
as a purple ball, His87 and Tyr 83 are represented in licorice format,
and residues in two acidic patches are represented as ball and stick
models. Right: plastocyanin is colored cyan, and cyt f is orange. The copper ion and His87 from plastocyanin and heme from
cyt f are also shown.
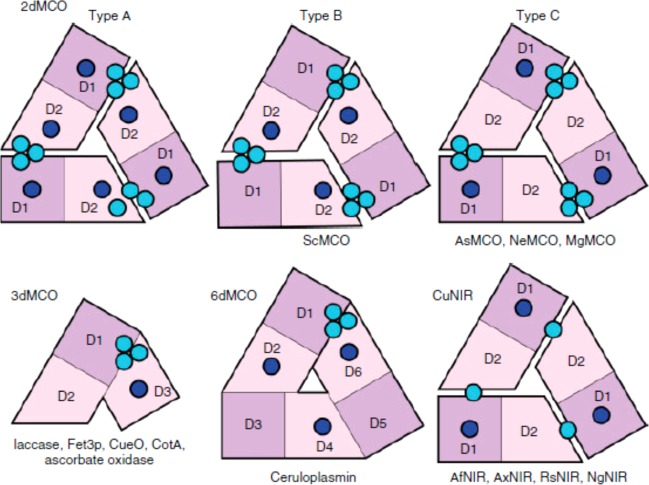
Domain organization
and copper center distribution in multicopper
oxidases. Reprinted with permission from ref (1265). Copyright 2011 Wiley-VCH.
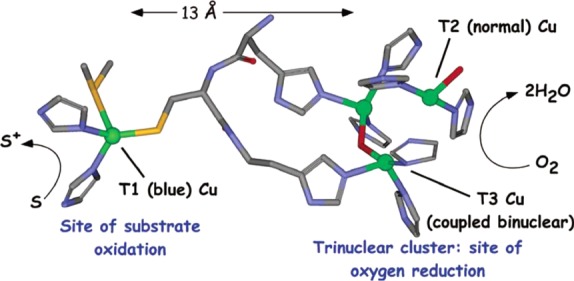
Active site of the multicopper oxidases.
Cu sites are shown as
green spheres. Figure generated from the crystal structure of ascorbate
oxidase (PDB ID 1AOZ). Reprinted from ref (1264). Copyright 2007 American Chemical Society.
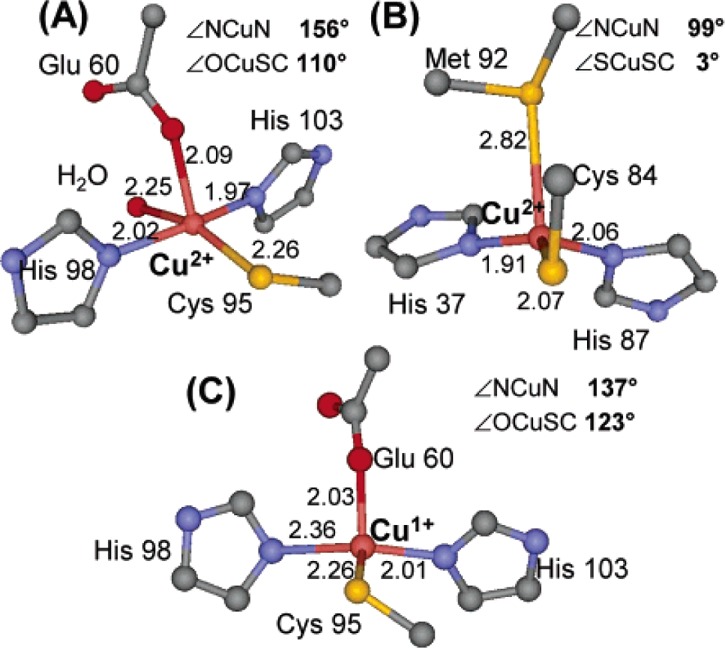
Crystal structures of
(A) the oxidized red copper site in nitrosocyanin,
(B) the oxidized T1 copper site in plastocyanin, and (C) the reduced
red copper site in nitrosocyanin. Reprinted from ref (1271). Copyright 2005 American
Chemical Society.
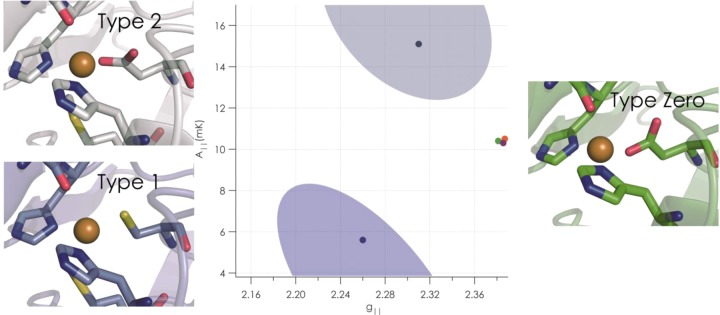
Active sites of type 2, type 1, and the newly constructed type
0 copper. In the center, a plot shows (in the shaded ovals) the typical
values of two electron paramagnetic resonance spectroscopy parameters, A∥ and g∥, for type 1 (lower) and type 2 (upper) copper sites and the values
of type 0 copper (green, red, and black points, right center), showing
that type 0 copper does not fall into the typical ranges for these
other kinds of sites. Reprinted with permission from ref (1308). Copyright 2009 Macmillan
Publishers Ltd.
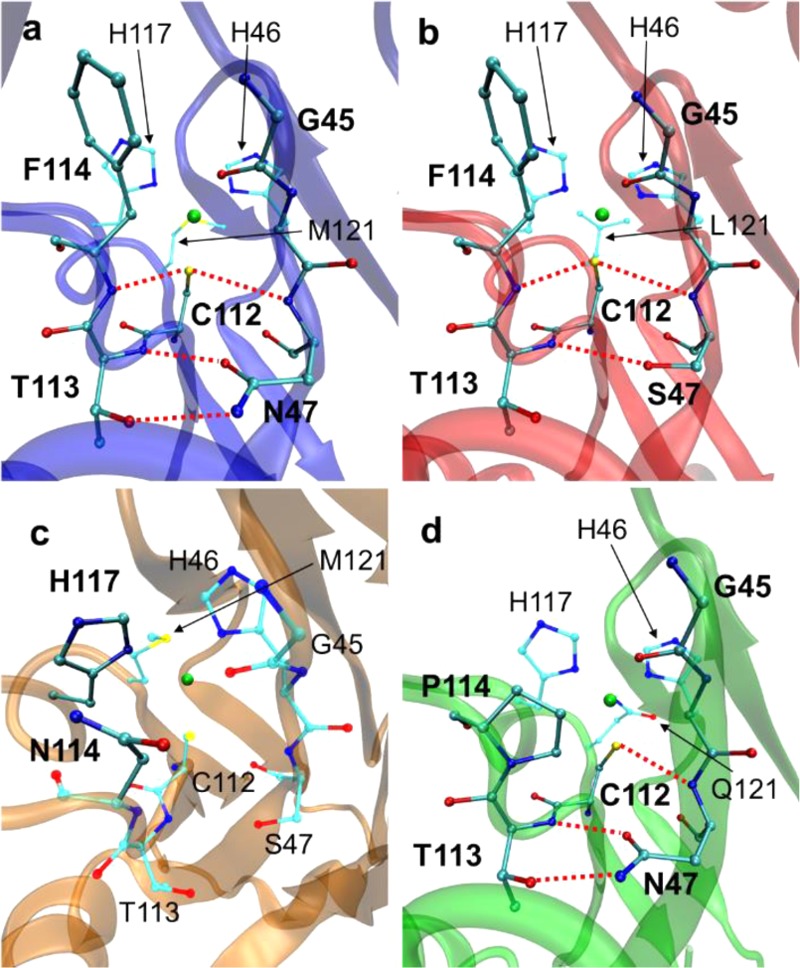
X-ray structures of Az and selected variants.
(a) Native azurin
(PDB ID 4AZU). (b) N47S/M121L azurin (PDB ID 3JT2). (c) N47S/F114N azurin (PDB ID 3JTB). (d) F114P/M121Q
azurin (PDB ID 3IN0). Copper is shown in green, carbon in cyan, nitrogen in blue, oxygen
in red, and sulfur in yellow. Hydrogen-bonding interactions are shown
by dashed red lines. Reprinted with permission from ref (1088). Copyright 2009 Macmillan
Publishers Ltd.
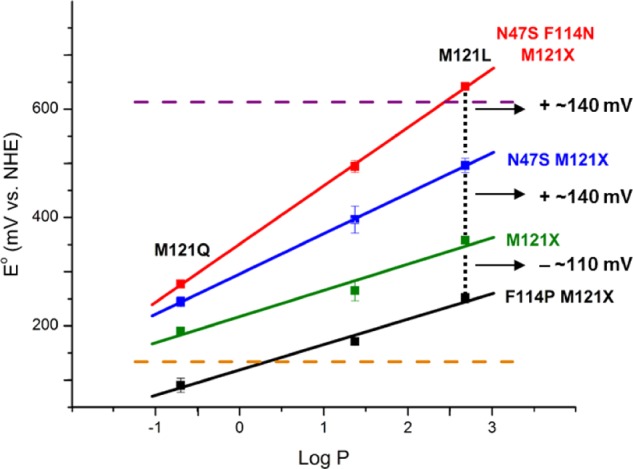
Reduction potentials for a number of Az mutants versus a measure
of the hydrophobicity (log P), revealing the linear
trend with respect to the axial position (residue 121). Reprinted
with permission from ref (1088). Copyright 2009 Macmillan Publishers Ltd.
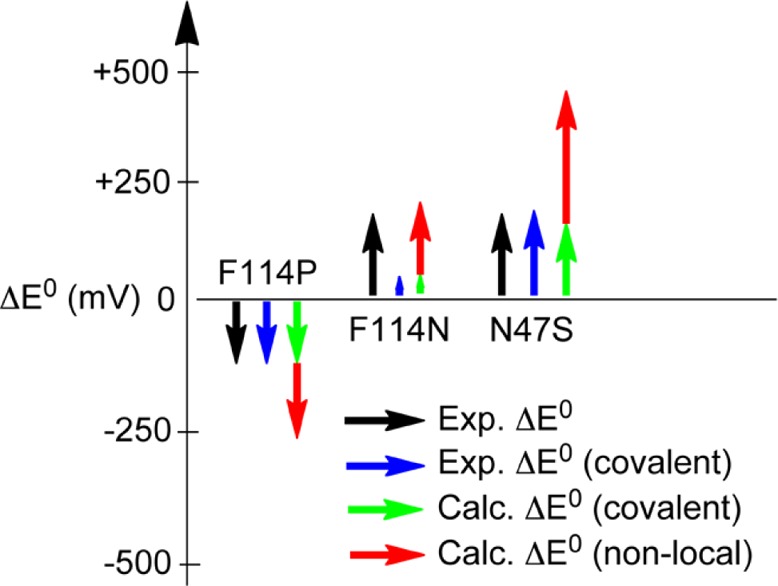
Illustration of the
experimentally derived covalent and nonlocal
electrostatic contributions to E° for the variants
of Az relative to WT Az and their comparison to calculations. Reprinted
from ref (1316). Copyright
2012 American Chemical Society.
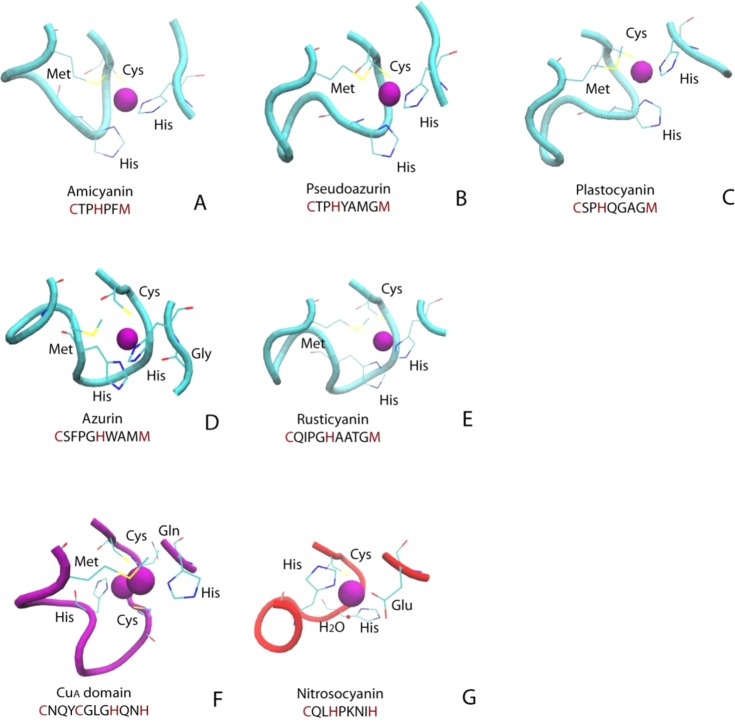
Ligand and
loop structure in different T1 copper proteins, CuA from T. thermophilus heme–copper
oxidase, and red copper protein nitrosocyanin: (A) amicyanin (PDB
ID 1AAC); (B)
pseudoazurin (PDB ID 1PAZ); (C) plastocyanin (PDB ID 1PLC); (D) azurin (PDB ID 2AZA); (E) rusticyanin
(PDB ID 1RCY); (F) CuA from T. thermophilus heme–copper oxidase (PDB ID 1CUA); (G) nitrosocyanin (PDB ID 1IBY).
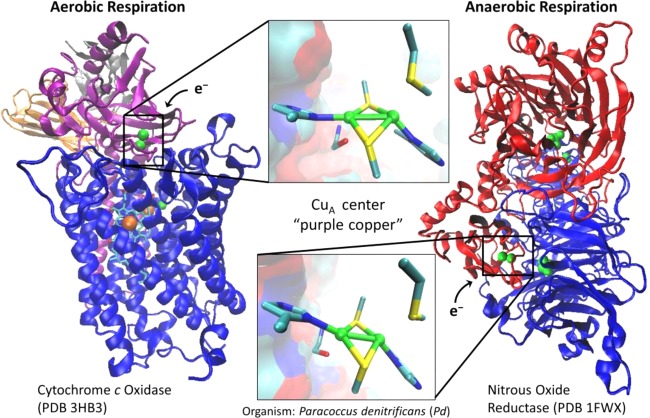
Crystal structures of
cytochrome c oxidase (PDB
ID 3HB3) and
nitrous oxide reductase (PDB ID 1FWX). The CuA sites are highlighted
(copper is in green, sulfur is in yellow, nitrogen is in blue, and
carbon is in cyan).
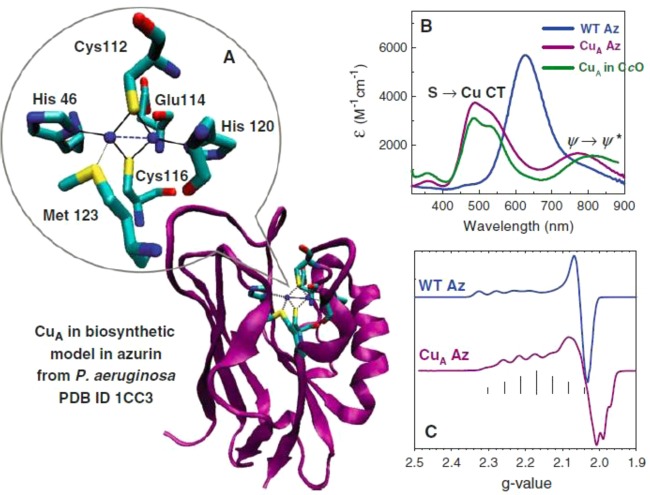
(A) Crystal structure of the biosynthetic model of the
CuA site in azurin (PDB ID 1CC3). (B) Comparison of UV–vis spectra
between
the soluble CuA domain in cytochrome c oxidase (green line), wild-type azurin (blue line), and the biosynthetic
CuA model in azurin (purple line). (C) Comparison of X-band CW EPR
between wild-type azurin (blue line) and the biosynthetic CuA model
in azurin (purple line), four-line splitting vs seven-line splitting.
Reprinted with permission from ref (1365). Copyright 2010 Springer-Verlag.
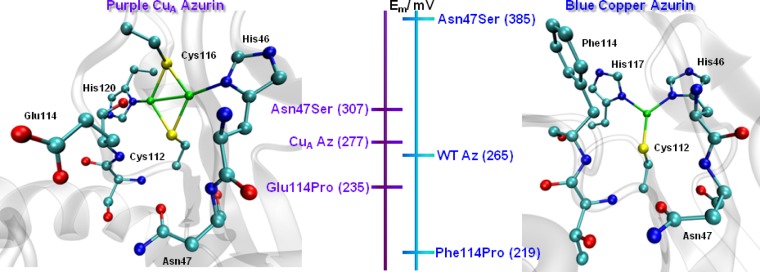
Tuning the reduction
potential at blue copper azurin and CuA azurin by redesigning
the second coordination sphere. The
effects of these mutants are in the same direction, but the magnitude
is smaller in the CuA site due to the electron delocalization
between the two copper ions. Adapted with permission from ref (1385). Copyright 2012 The
Royal Society of Chemistry.
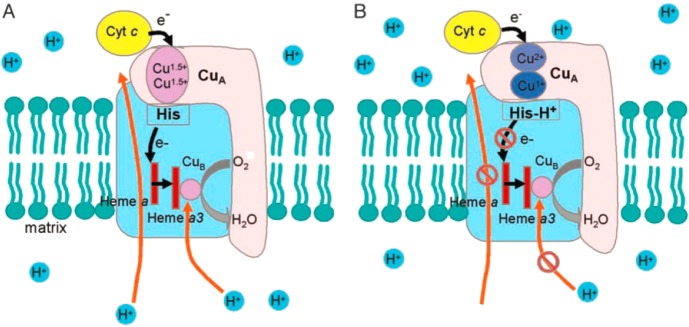
Schematic model of different
states of the CuA center
in cytochrome c oxidase: (A) mixed-valence form at
neutral pH and (B) trapped-valence form at low pH. Subunit I is in
light blue, and subunit II is in pink. Black arrows represent the
flow of electrons, and orange arrows represent the flow of protons.
Reprinted with permission from ref (1390). Copyright 2004 National Academy of Sciences.
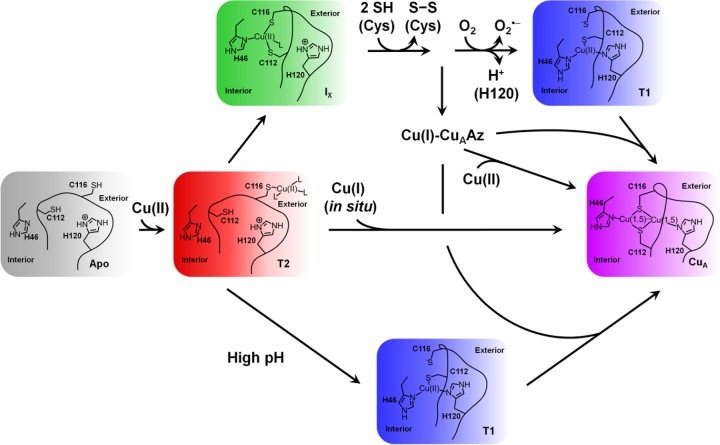
Proposed
mechanism of copper incorporation into the biosynthetic
CuA model in azurin. Reprinted with permission from ref (103). Copyright 2012 Elsevier.
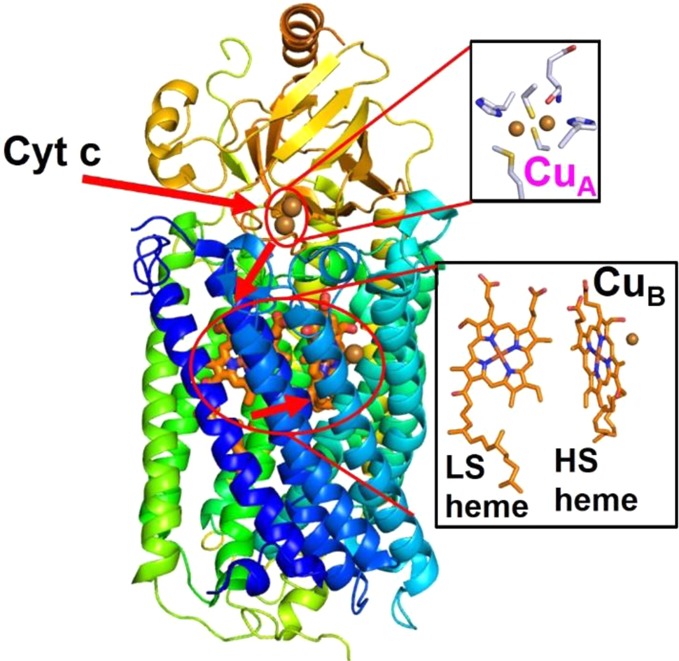
Cyt c oxidase from Pa. denitrificans (PDB ID 3HB3). The ET pathway is shown with arrows.
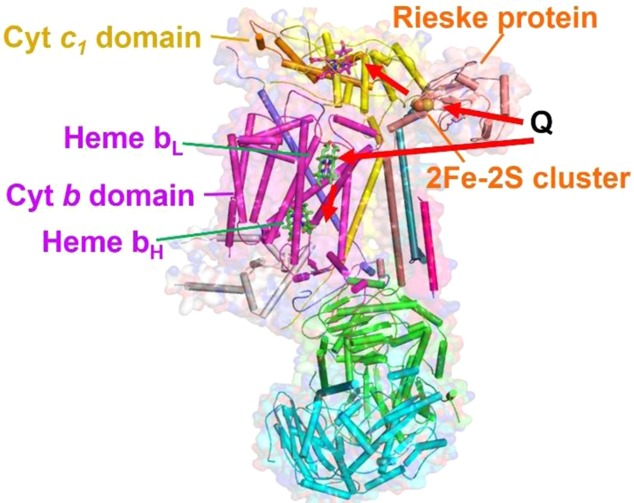
Bovine cytochrome bc1 complex (PDB
ID 1BE3). Different
ET domains and their cofactors are shown. bL = low-potential
heme, bH = high-potential heme, and Q = ubiquinol. Electron
transfer pathways are shown with arrows.
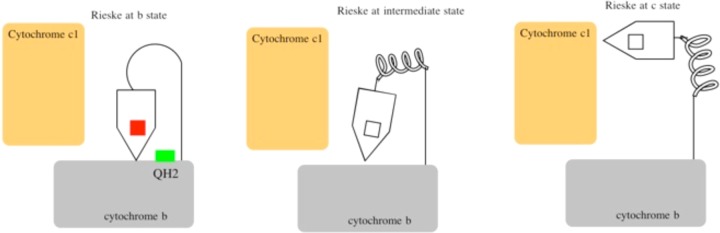
Schematic cycle of Rieske positions in the bc1 complex. Reprinted from ref (865). Copyright 2013 American Chemical Society.
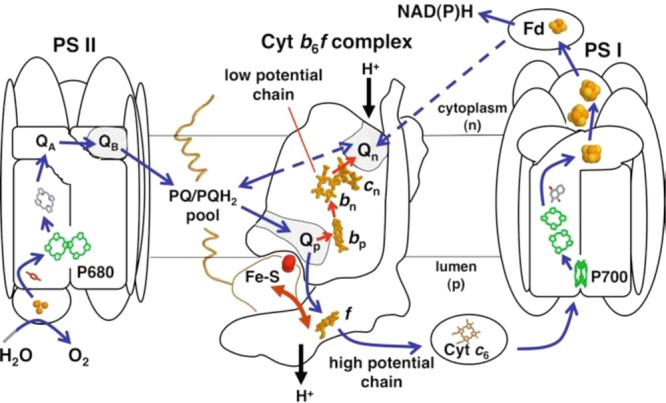
Cyt b6f complex in
the photosynthetic electron transport chain. P680 = reaction center
chlorophylls of PSII, QA, QB = quinones of PSII, PQ/PQH2 pool = plastoquinone/plastoquinol
pool, Fe–S = Rieske cluster, f = cyt f of the high-potential chains (blue arrows), Qp, Qn = plastoquinol
oxidation and plastoquinone reduction sites, bp, bn, cn = hemes of the low-potential chain (red arrows), Fd = ferredoxin,
and P700 = reaction center chlorophylls of PSI. The domain movement
of the Rieske protein is shown by a two-sided arrow. The direction
of proton translocation across the membrane is shown by proton arrows.
The electronegative (cytoplasmic) (n) and electropositive (luminal)
(p) sides of the membrane are labeled, and ET pathways are shown by
arrows. A possible direct ET path from PSI to the cyt b6f complex is shown as the dashed line
from Fd to the Qn site. Reprinted with permission from ref (1477). Copyright 2012 Springer
Science+Business Media.
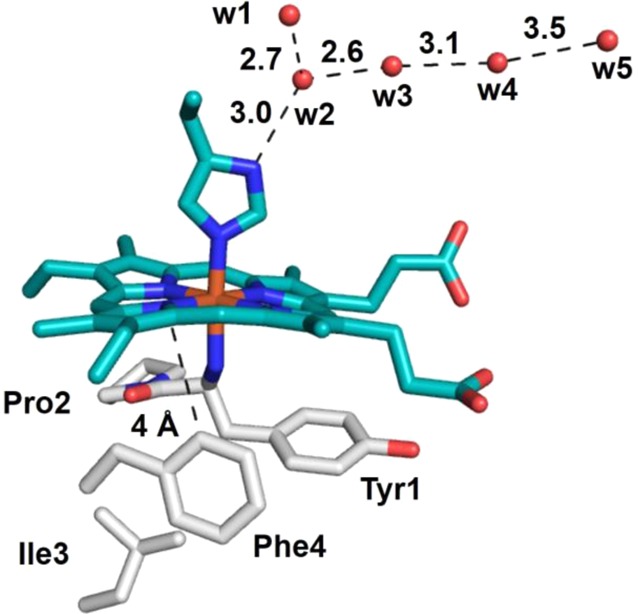
Environment
around the heme of cyt f (PDB ID 1HCZ). Hydrophobic residues
are shown as gray sticks. The “edge-to-face” interaction
at 4 Å between Phe4 and the heme that is proposed to be important
to tune the reduction potential of the heme iron is shown. The five
conserved molecules that have been proposed to act as “proton
wires” that couple ET with proton transfer are shown as red
spheres. Residue numbering of waters is arbitrary.
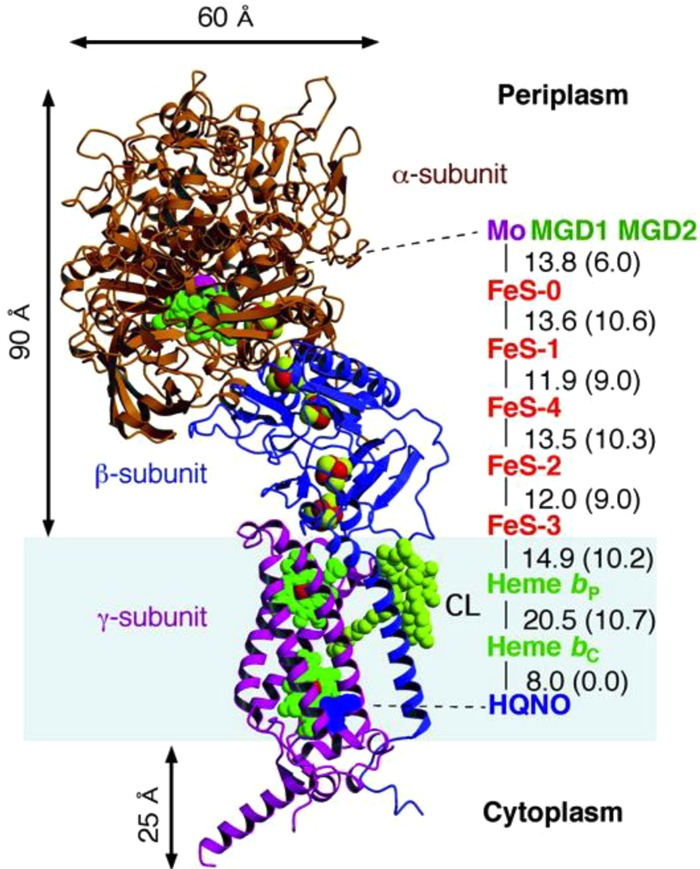
Overall structure of
Fdh-N from E. coli. Cofactors are displayed
as spheres and denoted accordingly on the
right. The putative membrane is shown in gray shading. PDB ID 1KQF. Reprinted with
permission from ref (1492). Copyright 2002 American Association for the Advancement of Science.
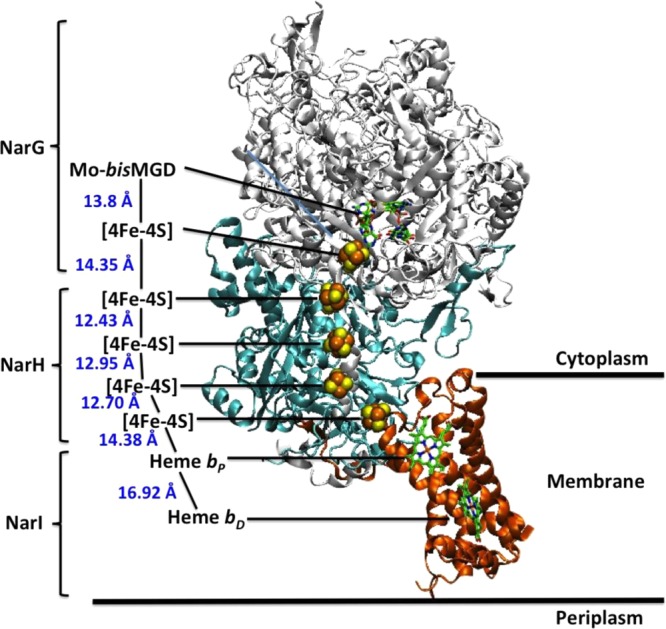
Overall three-dimensional
structure of NarGHI from E. coli K12.
PDB ID 1Q16.
Subunit and cofactor names are denoted.
Reprinted with permission from ref (1505). Copyright 2006 Elsevier.
References
-
- Malkin R.; Rabinowitz J. C. Annu. Rev. Biochem. 1967, 36, 113. - PubMed
-
- Adman E. T. Biochim. Biophys. Acta, Rev. Bioenerg. 1979, 549, 107. - PubMed
-
- Brunori M.; Colosimo A.; Silvestrini M. C. Pure Appl. Chem. 1983, 55, 1049.
-
- Thomson A. J. Nachr. Chem., Tech. Lab. 1984, 32, 326.
-
- Chiara S.; Maria; Brunori M. Life Chem. Rep. 1987, 5, 155.
Publication types
MeSH terms
Substances
Grants and funding
LinkOut - more resources
Full Text Sources
Other Literature Sources
Medical
