Revisiting CFTR inhibition: a comparative study of CFTRinh -172 and GlyH-101 inhibitors
- PMID: 24758416
- PMCID: PMC4128068
- DOI: 10.1111/bph.12726
Revisiting CFTR inhibition: a comparative study of CFTRinh -172 and GlyH-101 inhibitors
Abstract
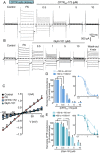
Background and purpose: For decades, inhibitors of the cystic fibrosis transmembrane conductance regulator (CFTR) chloride channel have been used as tools to investigate the role and function of CFTR conductance in cystic fibrosis research. In the early 2000s, two new and potent inhibitors of CFTR, CFTRinh -172 and GlyH-101, were described and are now widely used to inhibit specifically CFTR. However, despite some evidence, the effects of both drugs on other types of Cl(-) -conductance have been overlooked. In this context, we explore the specificity and the cellular toxicity of both inhibitors in CFTR-expressing and non-CFTR-expressing cells.
Experimental approach: Using patch-clamp technique, we tested the effects of CFTRinh -172 and GlyH-101 inhibitors on three distinct types of Cl(-) currents: the CFTR-like conductance, the volume-sensitive outwardly rectifying Cl(-) conductance (VSORC) and finally the Ca(2+) -dependent Cl(-) conductance (CaCC). We also explored the effect of both inhibitors on cell viability using live/dead and cell proliferation assays in two different cell lines.
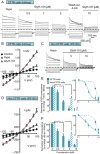
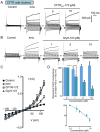
Key results: We confirmed that these two compounds were potent inhibitors of the CFTR-mediated Cl(-) conductance. However,GlyH-101 also inhibited the VSORC conductance and the CaCC at concentrations used to inhibit CFTR. The CFTRinh -172 did not affect the CaCC but did inhibit the VSORC, at concentrations higher than 5 µM. Neither inhibitor (20 µM; 24 h exposure) affected cell viability, but both were cytotoxic at higher concentrations.
Conclusions and implications: Both inhibitors affected Cl(-) conductances apart from CFTR. Our results provided insights into their use in mouse models.
Keywords: CFTR; CaCC; VSORC; chloride channel; chloride conductance; cystic fibrosis; inhibitors; patch-clamp; whole-cell.
© 2014 The Authors. British Journal of Pharmacology published by John Wiley & Sons Ltd on behalf of The British Pharmacological Society.
Figures


Similar articles
-
Cystic fibrosis transmembrane regulator inhibitors CFTR(inh)-172 and GlyH-101 target mitochondrial functions, independently of chloride channel inhibition.J Pharmacol Exp Ther. 2010 Apr;333(1):60-9. doi: 10.1124/jpet.109.162032. Epub 2010 Jan 5. J Pharmacol Exp Ther. 2010. PMID: 20051483
-
CFTR channel pharmacology: insight from a flock of clones. Focus on "Divergent CFTR orthologs respond differently to the channel inhibitors CFTRinh-172, glibenclamide, and GlyH-101".Am J Physiol Cell Physiol. 2012 Jan 1;302(1):C24-6. doi: 10.1152/ajpcell.00376.2011. Epub 2011 Oct 12. Am J Physiol Cell Physiol. 2012. PMID: 21998142 No abstract available.
-
Divergent CFTR orthologs respond differently to the channel inhibitors CFTRinh-172, glibenclamide, and GlyH-101.Am J Physiol Cell Physiol. 2012 Jan 1;302(1):C67-76. doi: 10.1152/ajpcell.00225.2011. Epub 2011 Sep 21. Am J Physiol Cell Physiol. 2012. PMID: 21940661 Free PMC article.
-
Therapeutic potential of cystic fibrosis transmembrane conductance regulator (CFTR) inhibitors in polycystic kidney disease.BioDrugs. 2009;23(4):203-16. doi: 10.2165/11313570-000000000-00000. BioDrugs. 2009. PMID: 19697963 Review.
-
Selective activation of cystic fibrosis transmembrane conductance regulator Cl- and HCO3- conductances.JOP. 2001 Jul;2(4 Suppl):212-8. JOP. 2001. PMID: 11875262 Review.
Cited by
-
Cystic Fibrosis Transmembrane Conductance Regulator (CFTR) in Human Lung Microvascular Endothelial Cells Controls Oxidative Stress, Reactive Oxygen-Mediated Cell Signaling and Inflammatory Responses.Front Physiol. 2020 Jul 29;11:879. doi: 10.3389/fphys.2020.00879. eCollection 2020. Front Physiol. 2020. PMID: 32848840 Free PMC article.
-
A Membrane Potential- and Calpain-Dependent Reversal of Caspase-1 Inhibition Regulates Canonical NLRP3 Inflammasome.Cell Rep. 2018 Aug 28;24(9):2356-2369.e5. doi: 10.1016/j.celrep.2018.07.098. Cell Rep. 2018. PMID: 30157429 Free PMC article.
-
An organoid model to assay the role of CFTR in the human epididymis epithelium.Cell Tissue Res. 2020 Aug;381(2):327-336. doi: 10.1007/s00441-020-03208-7. Epub 2020 May 6. Cell Tissue Res. 2020. PMID: 32377875 Free PMC article.
-
Calcium-sensing receptor activator cinacalcet for treatment of cyclic nucleotide-mediated secretory diarrheas.Transl Res. 2024 Jan;263:45-52. doi: 10.1016/j.trsl.2023.09.001. Epub 2023 Sep 9. Transl Res. 2024. PMID: 37678755 Free PMC article.
-
Epithelial Anion Transport as Modulator of Chemokine Signaling.Mediators Inflamm. 2016;2016:7596531. doi: 10.1155/2016/7596531. Epub 2016 Jun 12. Mediators Inflamm. 2016. PMID: 27382190 Free PMC article. Review.
References
-
- Ando-Akatsuka Y, Abdullaev IF, Lee EL, Okada Y, Sabirov RZ. Down-regulation of volume-sensitive Cl− channels by CFTR is mediated by the second nucleotide-binding domain. Pflugers Arch. 2002;445:177–186. - PubMed
-
- Baniak N, Luan X, Grunow A, Machen TE, Ianowski JP. The cytokines interleukin-1beta and tumor necrosis factor-alpha stimulate CFTR-mediated fluid secretion by swine airway submucosal glands. Am J Physiol Lung Cell Mol Physiol. 2012;303:L327–L333. - PubMed
-
- Barman PP, Choisy SC, Gadeberg HC, Hancox JC, James AF. Cardiac ion channel current modulation by the CFTR inhibitor GlyH-101. Biochem Biophys Res Commun. 2011;408:12–17. - PubMed
-
- Barriere H, Poujeol C, Tauc M, Blasi JM, Counillon L, Poujeol P. CFTR modulates programmed cell death by decreasing intracellular pH in Chinese hamster lung fibroblasts. Am J Physiol Cell Physiol. 2001;281:C810–C824. - PubMed
Publication types
MeSH terms
Substances
LinkOut - more resources
Full Text Sources
Other Literature Sources
Miscellaneous

