. 2014 Jul 15;461(2):223-32.
doi: 10.1042/BJ20131433.

Mitochondrial-nuclear genome interactions in non-alcoholic fatty liver disease in mice

Affiliations

Mitochondrial-nuclear genome interactions in non-alcoholic fatty liver disease in mice

Angela M Betancourt et al. Biochem J. .

Abstract

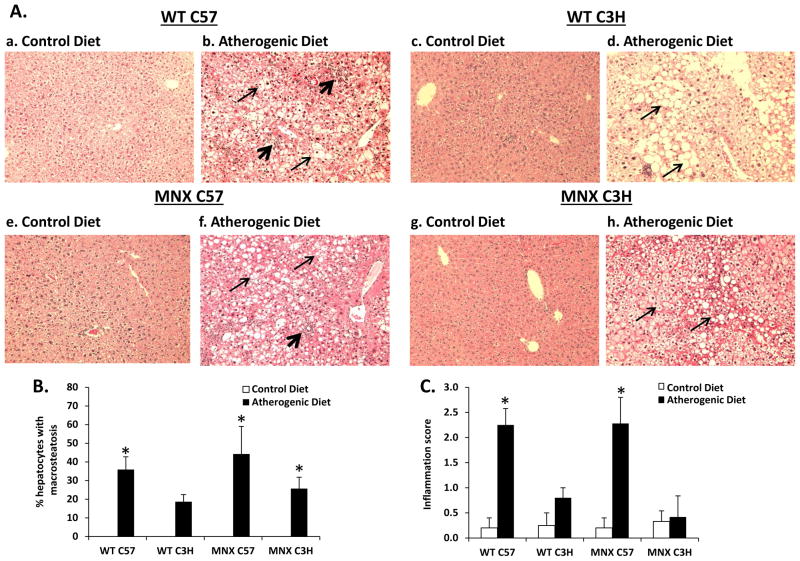
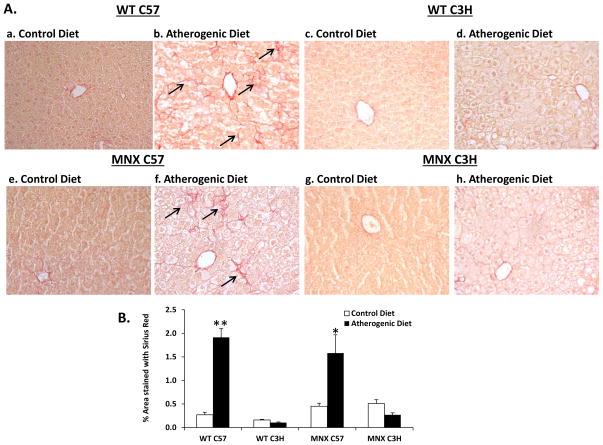
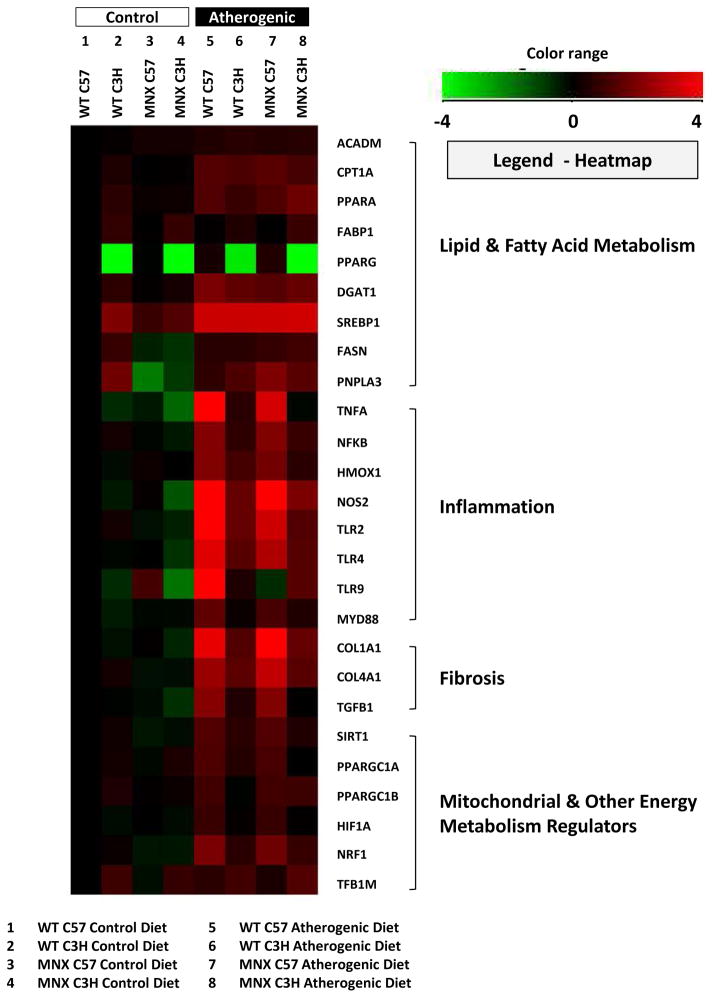
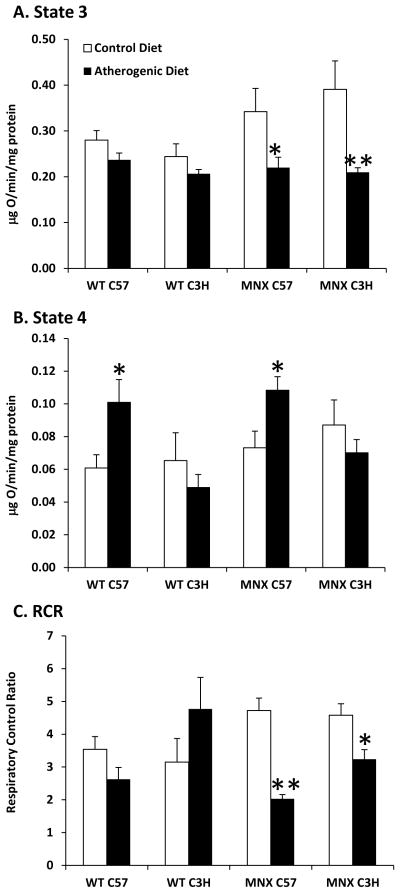
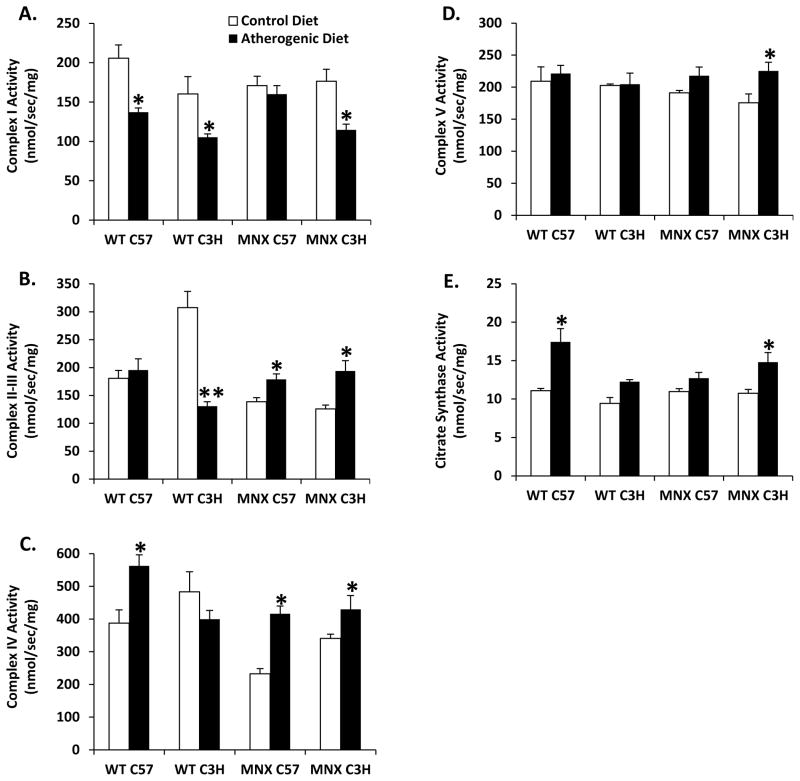
NAFLD (non-alcoholic fatty liver disease) involves significant changes in liver metabolism characterized by oxidative stress, lipid accumulation and fibrogenesis. Mitochondrial dysfunction and bioenergetic defects also contribute to NAFLD. In the present study, we examined whether differences in mtDNA influence NAFLD. To determine the role of mitochondrial and nuclear genomes in NAFLD, MNX (mitochondrial-nuclear exchange) mice were fed an atherogenic diet. MNX mice have mtDNA from C57BL/6J mice on a C3H/HeN nuclear background and vice versa. Results from MNX mice were compared with wild-type C57BL/6J and C3H/HeN mice fed a control or atherogenic diet. Mice with the C57BL/6J nuclear genome developed more macrosteatosis, inflammation and fibrosis compared with mice containing the C3H/HeN nuclear genome when fed the atherogenic diet. These changes were associated with parallel alterations in inflammation and fibrosis gene expression in wild-type mice, with intermediate responses in MNX mice. Mice with the C57BL/6J nuclear genome had increased State 4 respiration, whereas MNX mice had decreased State 3 respiration and RCR (respiratory control ratio) when fed the atherogenic diet. Complex IV activity and most mitochondrial biogenesis genes were increased in mice with the C57BL/6J nuclear or mitochondrial genome, or both fed the atherogenic diet. These results reveal new interactions between mitochondrial and nuclear genomes and support the concept that mtDNA influences mitochondrial function and metabolic pathways implicated in NAFLD.


Conflict of interest statement

DISCLOSURES: The authors have no conflicts of interest and no disclosures.

Figures

Figure 1
Figure 1. Effect of diet, genotype, and haplotype on liver histology
Liver macrosteatosis and inflammatory foci were assessed in H&E stained sections for mice groups: WT C57, WT C3H, MNX C57, and MNX C3H. (A) Representative photomicrographs of H&E stained sections are shown from WT C57 (a, n=5), WT C3H (c, n=4), MNX C57 (e, n=5), and MNX C3H (g, n=6) mice fed the control diet; and WT C57 (b, n=16), WT C3H (d, n=15), MNX C57 (f, n=7), and MNX C3H (h, n=7) mice fed the atherogenic diet (magnification × 400). The narrow and wide arrows indicate hepatocyte steatosis and inflammatory infiltration, respectively. (B and C) Bar graphs representing % hepatocytes with macrosteatosis and inflammation score, respectively. Steatosis was not present in livers from mice fed the control diet and was scored as ‘0’; thus, no bars are given for control diet groups. Results are expressed as mean ± SE. *p<0.05, compared to corresponding control diet counterpart.
Figure 2
Figure 2. Effect of diet, genotype and haplotype on liver fibrosis
Staining of collagen fibers was assessed for mice groups: WT C57, WT C3H, MNX C57, and MNX C3H. (A) Representative photomicrographs of Sirius Red-stained liver sections are shown WT C57 (a, n=5), WT C3H (c, n=3), MNX C57 (e, n=4), and MNX C3H (g, n=4) mice fed the control diet; and WT C57 (b, n=7), WT C3H (d, n=5), MNX C57 (f, n=6), and MNX C3H (h, n=5) mice fed the atherogenic diet (magnification × 400). The arrows indicate Sirius Red-stained collagen fibers. (B) Bar graph representing % area stained with Sirius Red. Results are expressed as mean ± SE. *p<0.05 or **p<0.0001, compared to corresponding control diet counterpart. ANOVA results are provided in Supplemental Table 1 and p values for pair-wise comparisons are provided in Supplemental Table 3.
Figure 3
Figure 3. Effect of diet, genotype, and haplotype on lipid metabolism, inflammation, and fibrosis genes
Gene expression was determined for mice fed the control and atherogenic diets: WT C57, WT C3H, MNX C57, and MNX C3H. Results were normalized based on a change in expression from WT C57 mice fed the control diet. The sample size for each measurement was n=4 mice per group. Gene expression results were transformed (log2) and plotted in a heatmap generated using Genespring ver12.6 (Agilent Technologies, Inc., Santa Clara, CA). Down-regulated genes (relative to WT C57 Control Diet) are shown in green, and up-regulated genes (relative to WT C57 Control Diet) are shown in red. ANOVA results are provided in Supplemental Table 2 and p values for pair-wise comparisons are provided in Supplemental Table 3.
Figure 4
Figure 4. Effect of diet, genotype, and haplotype on mitochondrial function
Mitochondrial respiration and respiratory control ratio (RCR) was measured for mice fed the control and atherogenic diets: WT C57, WT C3H, MNX C57, and MNX C3H. State 3 (A) and state 4 (B) respiration were measured and the respiratory control ratio (RCR, C) was determined. Succinate was used as the oxidizable substrate. Results are expressed as mean ± SE, n=4–8 for the three parameters measured. *p<0.05 or **p<0.0001, compared to corresponding control diet counterpart. ANOVA results are provided in Supplemental Table 1 and p values for pair-wise comparisons are provided in Supplemental Table 3.
Figure 5
Figure 5. Effect of diet, genotype, and haplotype on respiratory complex activities
Mitochondrial respiratory complexes activities were measured for (A) complex I, (B) complex II–III, (C) complex IV, (D) complex V, and (E) citrate synthase (CS) activity in liver mitochondria of WT and MNX mice fed control and atherogenic diets. Results are expressed as mean nmol/sec/mg protein ± SE, n=3–4 (Complex I), n=4–6 (Complex II–III), n=4–12 (Complex IV), n=4–6 (Complex V), and n=4–12 (CS). *p<0.05 or **p<0.0001, compared to corresponding control diet counterpart. ANOVA results are provided in Supplemental Table 1 and p values for pair-wise comparisons are provided in Supplemental Table 3.

References

    1. Browning JD, Szczepaniak LS, Dobbins R, Nuremberg P, Horton JD, Cohen JC, Grundy SM, Hobbs HH. Prevalence of hepatic steatosis in an urban population in the United States: impact of ethnicity. Hepatology. 2004;40:1387–1395. - PubMed
    1. Vernon G, Baranova A, Younossi ZM. Systematic review: the epidemiology and natural history of non-alcoholic fatty liver disease and non-alcoholic steatohepatitis in adults. Aliment Pharmacol Ther. 2011;34:274–285. - PubMed
    1. Ludwig J, Viggiano TR, McGill DB, Oh BJ. Nonalcoholic steatohepatitis: Mayo Clinic experiences with a hitherto unnamed disease. Mayo Clin Proc. 1980;55:434–438. - PubMed
    1. Schaffner F, Thaler H. Nonalcoholic fatty liver disease. Prog Liver Dis. 1986;8:283–298. - PubMed
    1. Marrero JA, Fontana RJ, Fu S, Conjeevaram HS, Su GL, Lok AS. Alcohol, tobacco and obesity are synergistic risk factors for hepatocellular carcinoma. J Hepatol. 2005;42:218–224. - PubMed

Publication types

MeSH terms

Substances