. 2014 Jun 6;289(23):16362-73.
doi: 10.1074/jbc.M114.560359. Epub 2014 Apr 23.

Critical role for NAD glycohydrolase in regulation of erythropoiesis by hematopoietic stem cells through control of intracellular NAD content

Affiliations

Critical role for NAD glycohydrolase in regulation of erythropoiesis by hematopoietic stem cells through control of intracellular NAD content

Tae-Sik Nam et al. J Biol Chem. .

Abstract

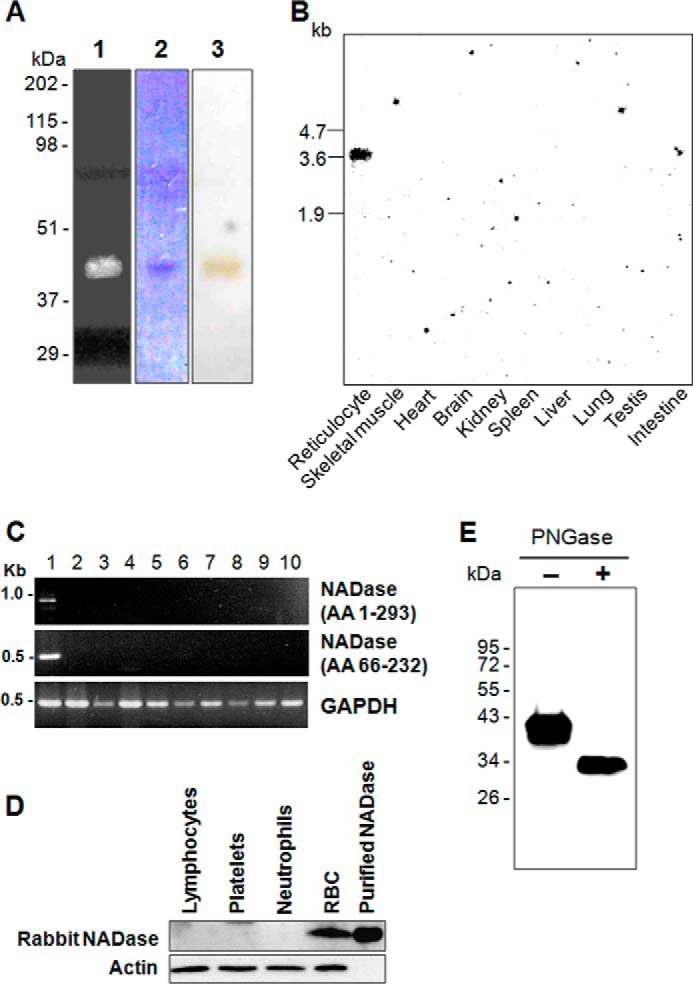
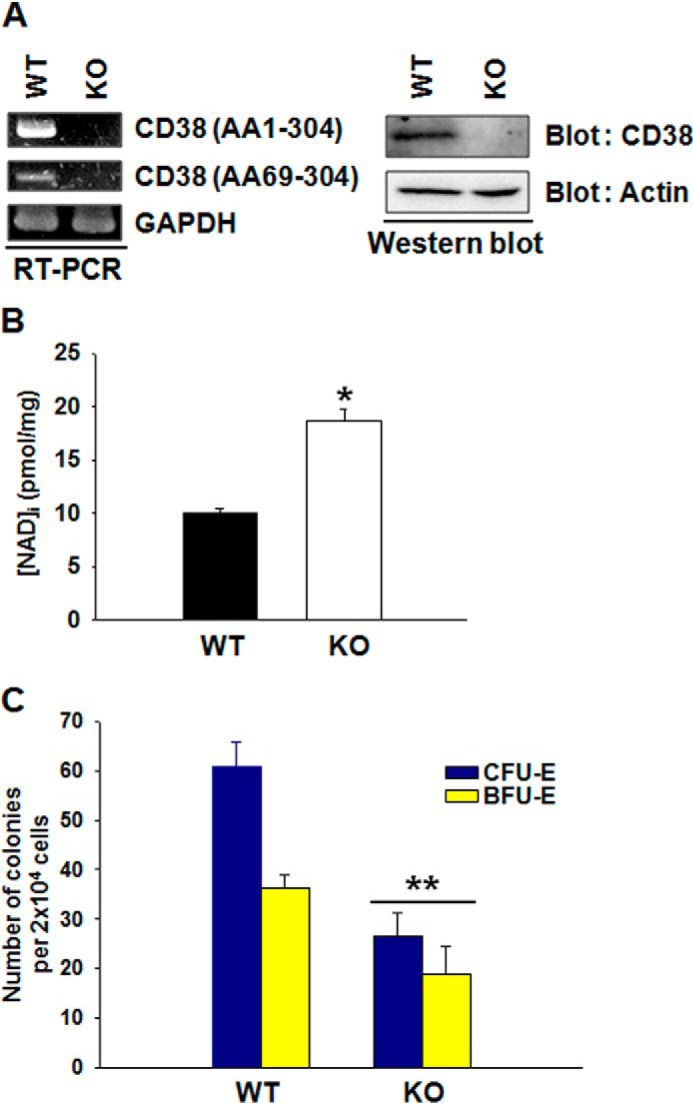
NAD glycohydrolases (NADases) catalyze the hydrolysis of NAD to ADP-ribose and nicotinamide. Although many members of the NADase family, including ADP-ribosyltransferases, have been cloned and characterized, the structure and function of NADases with pure hydrolytic activity remain to be elucidated. Here, we report the structural and functional characterization of a novel NADase from rabbit reticulocytes. The novel NADase is a glycosylated, glycosylphosphatidylinositol-anchored cell surface protein exclusively expressed in reticulocytes. shRNA-mediated knockdown of the NADase in bone marrow cells resulted in a reduction of erythroid colony formation and an increase in NAD level. Furthermore, treatment of bone marrow cells with NAD, nicotinamide, or nicotinamide riboside, which induce an increase in NAD content, resulted in a significant decrease in erythroid progenitors. These results indicate that the novel NADase may play a critical role in regulating erythropoiesis of hematopoietic stem cells by modulating intracellular NAD.

Keywords: CD38; Erythrocyte; Erythropoiesis; Hematopoietic Stem Cell; Intracellular NAD; NAD Glycohydrolase; Nicotinamide; Nicotinamide Adenine Dinucleotide (NAD); Reticulocytes.


Figures

FIGURE 1.
FIGURE 1.
Expression and purification of NADase in rabbit erythrocytes. A, purification of NADase from rabbit erythrocytes. Visualization of NADase with an in-gel assay (lane 1), Coomassie Blue staining (lane 2), and silver staining (lane 3) is shown. The gel was washed with 0.1% Triton X-100 and incubated with 150 μm ϵ-NAD+ as described under “Experimental Procedures.” Fluorescence of NADase in lane 1 was visualized under UV light (254 nm). Purification was repeated five times. B, Northern blot analysis of NADase using rabbit tissues. Each lane contains 20 μg of total RNA from rabbit tissues. Positions of RNA standards (kilobases (kb)) are indicated (n = 3). C, RT-PCR analysis of NADase in rabbit tissues. Total RNA was isolated from various rabbit tissues. Lane 1, reticulocytes; lane 2, skeletal muscle; lane 3, heart; lane 4, brain; lane 5, kidney; lane 6, spleen; lane 7, liver; lane 8, lung; lane 9, testis; lane 10, intestine. AA, amino acids. D, Western blot analysis of NADase in rabbit blood cells. Western blot analysis was performed using an anti-NADase antibody. E, NADase is a glycosylated protein. Western blot analysis was performed using an anti-NADase antibody. Samples were treated with (+) or without (−) PNGase F as described under “Experimental Procedures.”
FIGURE 2.
FIGURE 2.
Nucleotide and deduced amino acid sequences of NADase. Nucleotide and amino acid sequences are numbered relative to the initiating methionine codon and the initiating methionine, respectively. Sequences found in tryptic peptides are underlined. Two in-frame stop codons upstream from the initiator codon are double underlined, and potential N-glycosylation sites are marked below the amino acids (formula image).
FIGURE 3.
FIGURE 3.
Genomic structure of rabbit NADase. A, nucleotide sequence of the rabbit NADase gene (GenBankTM accession number NW_003159229). The nucleotide sequence is shown as capital letters in exon and bp numbers in introns. B, genomic structures of rabbit ART1, ART1-like, and NADase. The exons are depicted as boxes with filled and open boxes representing translated regions and untranslated regions, respectively. Gray boxes represent GPI anchor sites. The numbers indicate chromosome 1 genomic nucleotide sequence position. The arrows indicate the direction from 5′-flanking region to 3′-flanking region.
FIGURE 4.
FIGURE 4.
NADase exists as a GPI-anchored species on the plasma membrane of HEK293 cells. A, confocal fluorescence images of HEK293 cells expressing GFP-NADase. NADase expression was detected by GFP fluorescence. DIC, differential interference contrast. B, FLAG-NADase-expressing HEK293 cells were treated with (+) or without (−) PI-PLC, and solubilized NADase was determined in the supernatant by Western blot analysis. C, FLAG-vector- or FLAG-NADase-expressing HEK293 cells were treated with (+) or without (−) PI-PLC, and NADase activity was measured in the supernatant. *, p < 0.001, non-PI-PLC-treated NADase versus 1 μg/ml PI-PLC-treated NADase. The means ± S.E. (error bars) of three independent experiments are shown.
FIGURE 5.
FIGURE 5.
Alignment of ART deduced amino acid sequence (Clustal program) of NADase. Identical, strongly conserved, and weakly conserved amino acids are indicated by asterisks, colons, and dots, respectively, based on the methods of Higgins and Sharp (35) as utilized by the Clustal program. Dashes indicate gaps to maximize alignment. Nucleophilic arginine or histidine (R-H) and acidic amino acid regions, believed to be involved in the formation of the active site, are boxed (25). RbART1, rabbit skeletal muscle ART; mART1, mouse ART1; mART2a, mouse ART2a; mART2b, mouse ART2b; mRt6-1, mouse Rt6-1; mRt6-2, mouse Rt6-2; rART1, rat ART1; rART2a, rat ART2a; rART2b, rat ART2b; rRt6-1, rat Rt6-1; rRt6-2, rat Rt6-2.
FIGURE 6.
FIGURE 6.
NADase and ART activities of wild-type and mutant NADases and ART1. HEK293 cells transfected with plasmids (vector, NADase, NADase Q218E, NADase Q218A, NADase Q218D, and ART1) were lysed and assayed for NADase and ART activities. Activity was determined as described under “Experimental Procedure.” A, Western blot analysis of proteins from cells overexpressing NADase and mutant NADases. Western blot analysis was performed using anti-FLAG antibody for comparison of NADase expression levels among HEK293 cells transfected with NADase and mutant NADase genes. B, NADase activity of HEK293 cells transfected with indicated plasmids. *, p < 0.001, vector versus NADase; **, p < 0.001, NADase versus mutant NADases or ART. C, ART activity of HEK293 cells transfected with indicated plasmids. #, p < 0.001, vector or NADase versus ART1 or NADase Q218E; ##, p < 0.001, ART1 versus NADase Q218A or NADase Q218D. The means ± S.E. (error bars) of three independent experiments are shown.
FIGURE 7.
FIGURE 7.
Role of rabbit NADase in erythroid differentiation of bone marrow cells. Rabbit (Rb) bone marrow cells were infected with scrambled or NADase shRNA-expressing lentivirus and selected with puromycin. A, Western blot analysis of NADase in lentivirus-infected bone marrow cells (scrambled or NADase shRNAs). B, in vitro methylcellulose colony formation of CFU-E and BFU-E. Methylcellulose cultures for erythroid colonies of bone marrow cells were infected with scrambled or NADase shRNA-expressing lentivirus for 10 days. Colonies were examined under a Zeiss microscope (Axiovert 40 CFL, Carl Zeiss). C, CFU-E and mature BFU-E were scored in scrambled or NADase shRNA-expressing lentivirus-infected bone marrow cells for 10 days. Mean values of three independent experiments ±S.D. (error bars) are shown. ND, not detected. *, p < 0.005, scrambled shRNA CFU-E versus NADase shRNA CFU-E. D, intracellular NAD concentration in scrambled shRNA- or NADase shRNA-expressing lentivirus-infected bone marrow cells. $, p < 0.005, scrambled shRNA versus NADase shRNAs. E, intracellular ADPR concentration in scrambled shRNA- or NADase shRNA-expressing lentivirus-infected bone marrow cells. #, p < 0.01, scrambled shRNA versus NADase shRNAs.
FIGURE 8.
FIGURE 8.
Effect of NR on erythroid differentiation of bone marrow cells. A, rabbit bone marrow cells were treated with 0.5 mm NR. CFU-E formation and mature BFU-E formation were scored at day 10 of culture with NR. Mean values of three independent experiments ±S.D. (error bars) are shown. *, p < 0.01, vehicle (Veh) versus NR. B, rabbit bone marrow cells were treated with 0.5 mm NR for 24 h, and intracellular NAD concentration was measured. $, p < 0.05, vehicle versus NR. C, intracellular ADPR concentration in NR-treated bone marrow cells.
FIGURE 9.
FIGURE 9.
Effect of NAD, ADP-ribose, and nicotinamide on erythroid differentiation of bone marrow cells. A, rabbit bone marrow cells were treated with 200 μm NAD, ADP-ribose, or nicotinamide, and CFU-E formation and mature BFU-E formation were scored at day 10 of culture with NAD, ADP-ribose, or nicotinamide. Mean values of three independent experiments ±S.D. (error bars) are shown. *, p < 0.05, vehicle (Veh) versus NAD or nicotinamide. B, intracellular NAD concentration in rabbit bone marrow cells treated with NAD, ADP-ribose, or nicotinamide. **, p < 0.0005, vehicle versus NAD or nicotinamide.
FIGURE 10.
FIGURE 10.
Erythroid differentiation of bone marrow cells prepared from CD38 WT or KO mice. A, RT-PCR and Western blot analysis of CD38 in bone marrow cells from CD38 WT or KO mice. B, intracellular NAD concentration in CD38 WT or KO mouse bone marrow cells. *, p < 0.0005, WT versus KO. C, CFU-E formation and mature BFU-E formation were scored at day 10. Mean values of three independent experiments ±S.D. (error bars) are shown. *, p < 0.001, WT versus KO.

Similar articles

Cited by

  • Graft Source Choice.
    Hong S, Horwitz ME. Hong S, et al. Adv Exp Med Biol. 2025;1475:57-75. doi: 10.1007/978-3-031-84988-6_4. Adv Exp Med Biol. 2025. PMID: 40488824 Review.

References

    1. Cho Y.-S., Han M.-K., Kwark O.-S., Phoe M. S., Cha Y.-S., An N.-H., Kim U.-H. (1998) Auto-ADP-ribosylation of NAD glycohydrolase from Neurospora crassa. Comp. Biochem. Physiol. B Biochem. Mol. Biol. 120, 175–181 - PubMed
    1. Ghosh J., Anderson P. J., Chandrasekaran S., Caparon M. G. (2010) Characterization of Streptococcus pyogenes β-NAD+ Glycohydrolase. J. Biol. Chem. 285, 5683–5694 - PMC - PubMed
    1. Kim U.-H., Kim M.-K., Kim J.-S., Han M.-K., Park B.-H., Kim H.-R. (1993) Purification and characterization of NAD glycohydrolase from rabbit erythrocytes. Arch. Biochem. Biophys. 305, 147–152 - PubMed
    1. Kim U.-H., Rockwood S. F., Kim H. R., Daynes R. A. (1988) Membrane-associated NAD+ glycohydrolase from rabbit erythrocytes is solubilized by phosphatidylinositol-specific phospholipase C. Biochim. Biophys. Acta 965, 76–81 - PubMed
    1. Okazaki I. J., Kim H.-J., McElvaney N. G., Lesma E., Moss J. (1996) Molecular Characterization of a glycosylphosphatidylinositol-linked ADP-ribosyltransferase from lymphocytes. Blood 88, 915–921 - PubMed

Publication types

MeSH terms

Associated data