. 2014 Jun 12;510(7504):278-82.
doi: 10.1038/nature13229. Epub 2014 Apr 23.

Therapeutic targeting of BET bromodomain proteins in castration-resistant prostate cancer

Affiliations

Therapeutic targeting of BET bromodomain proteins in castration-resistant prostate cancer

Irfan A Asangani et al. Nature. .

Abstract

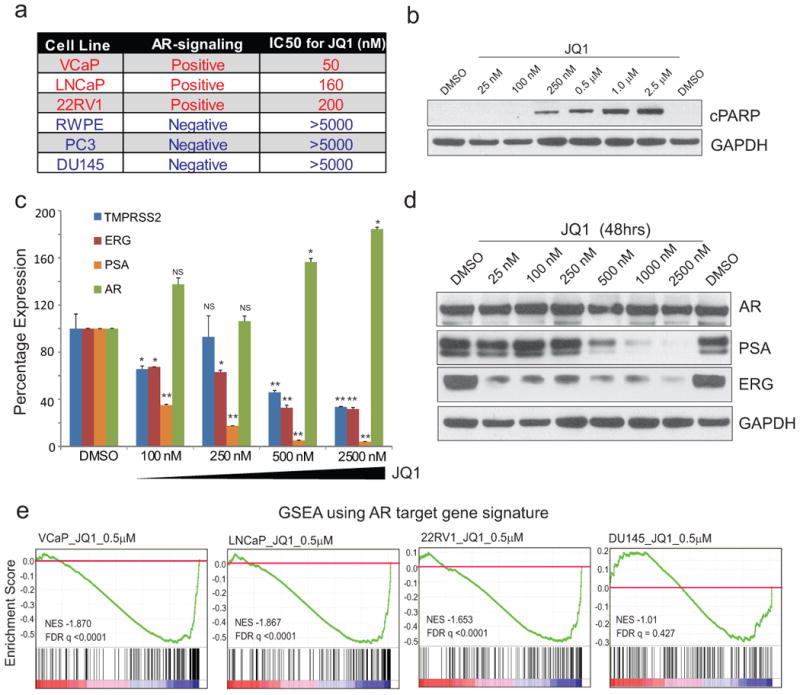
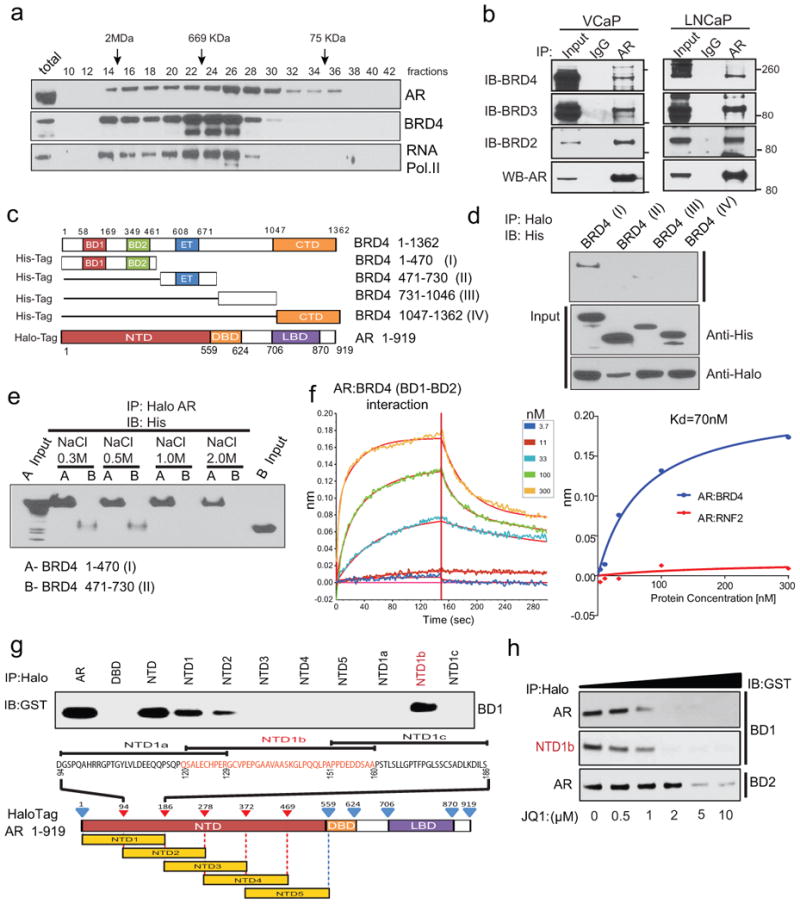
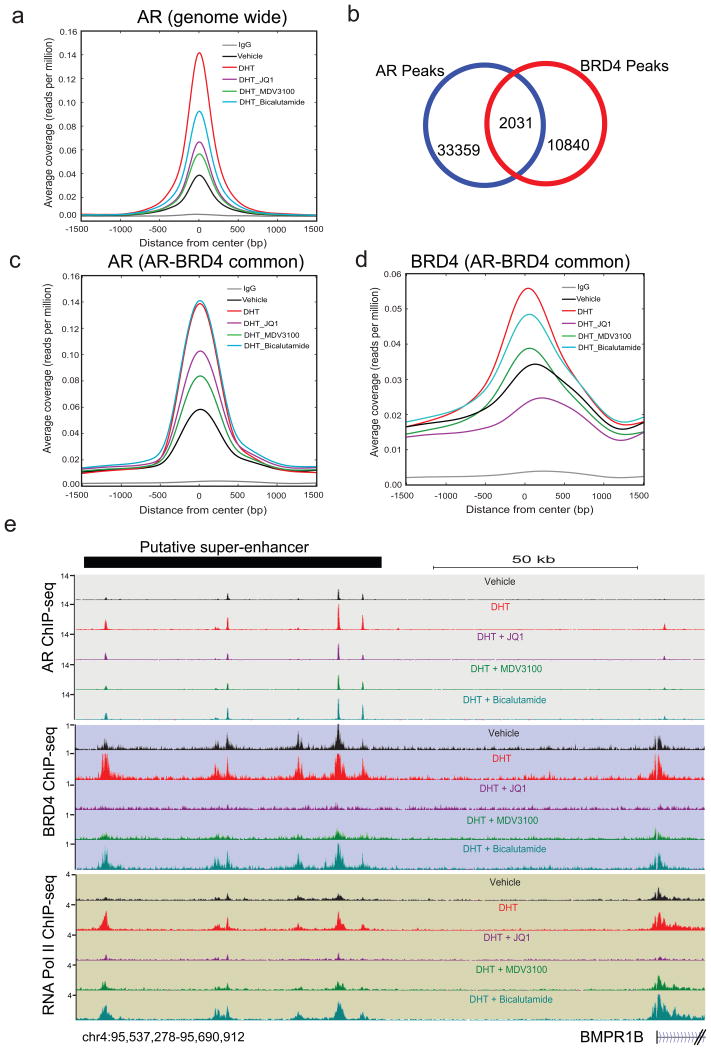
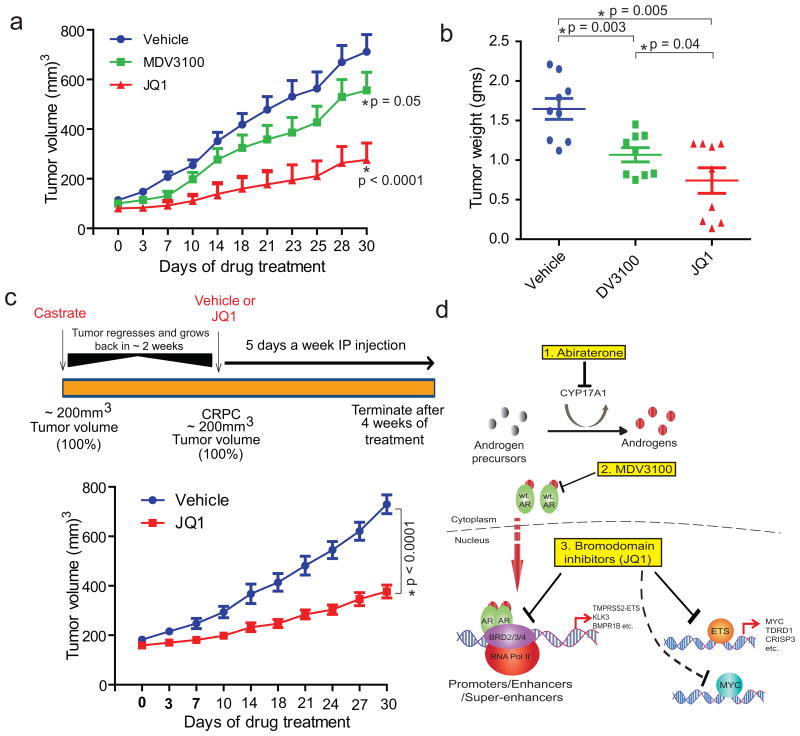
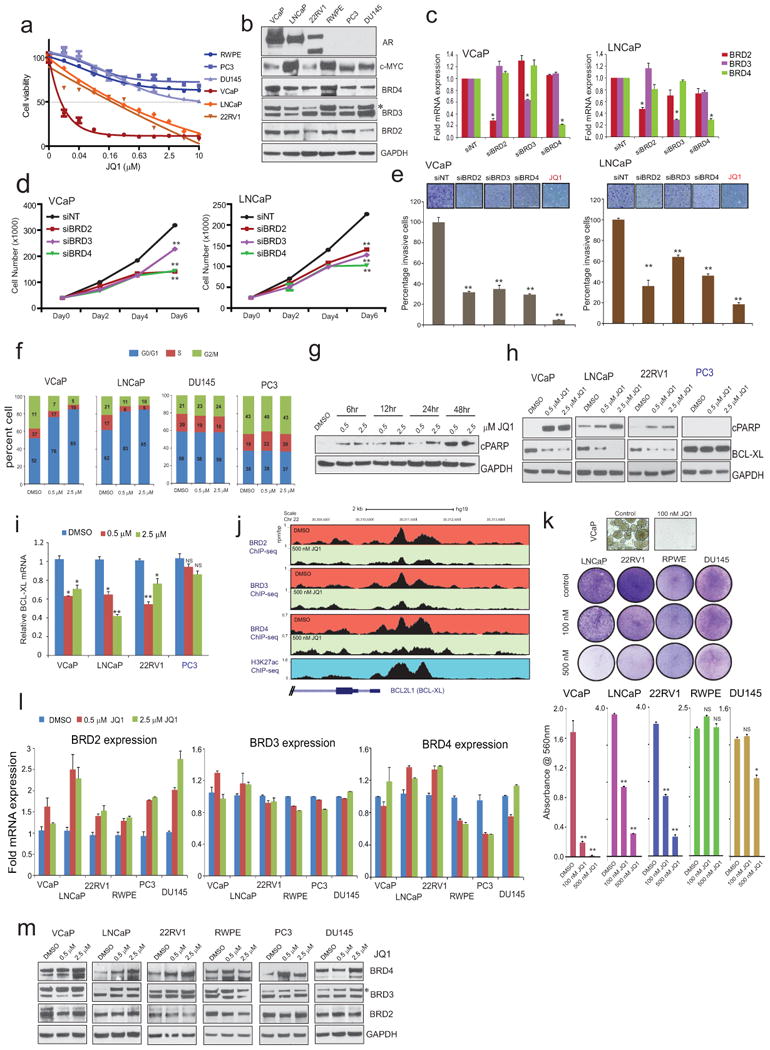
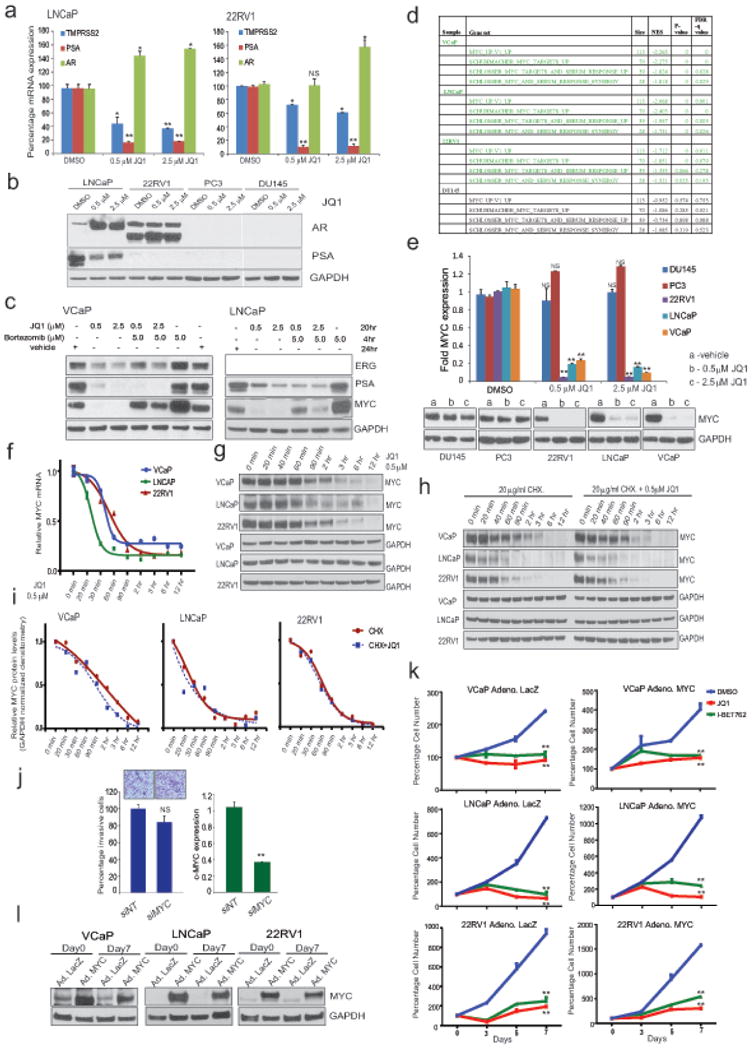
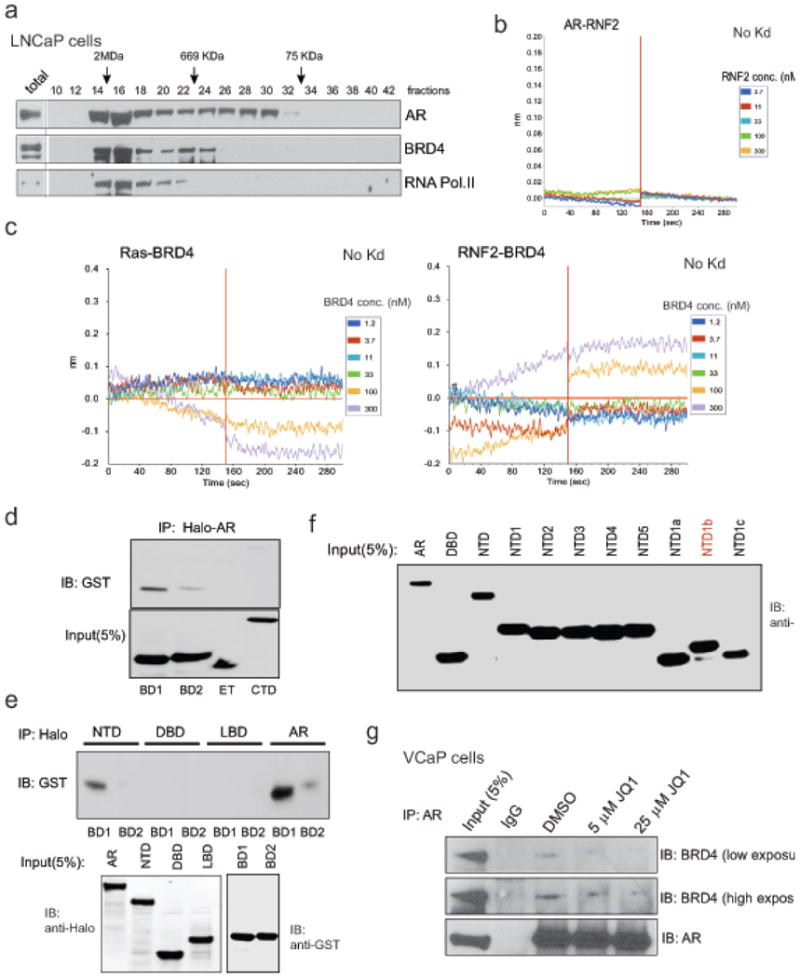
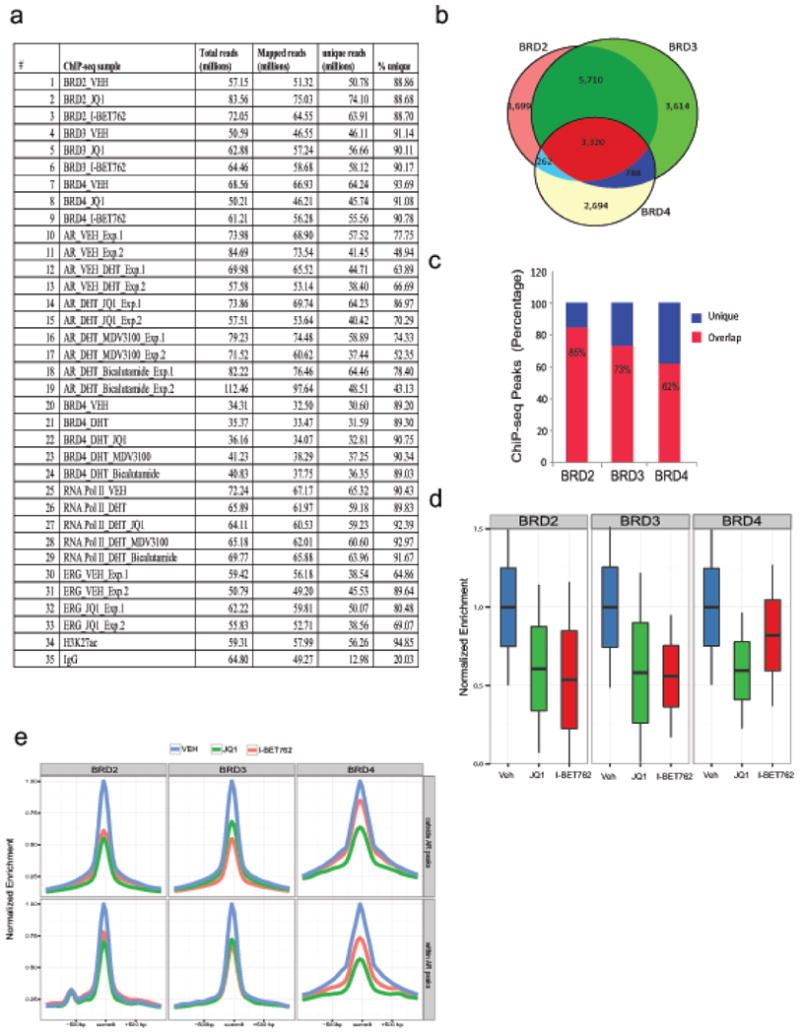
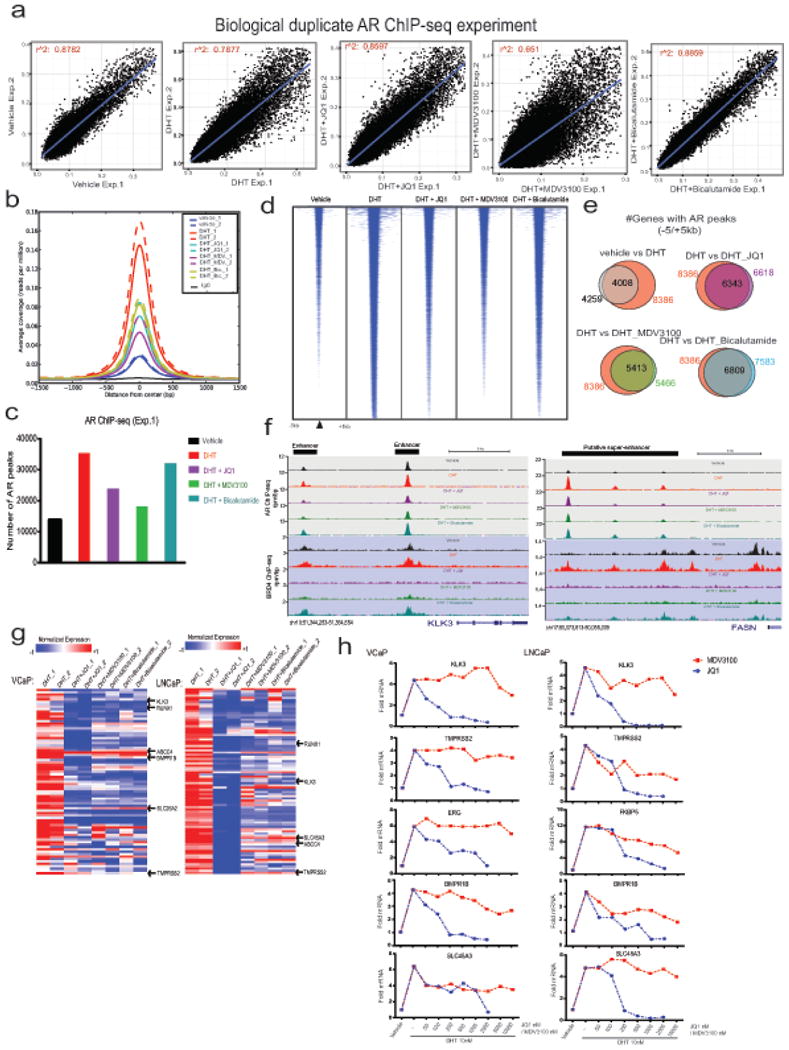
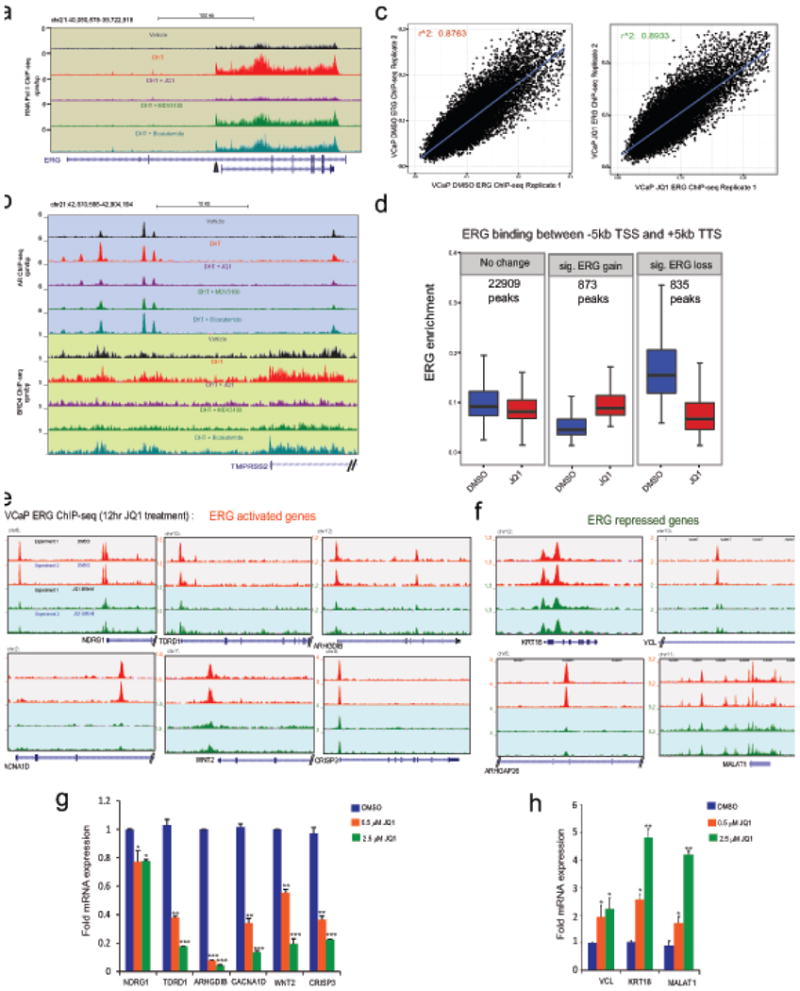
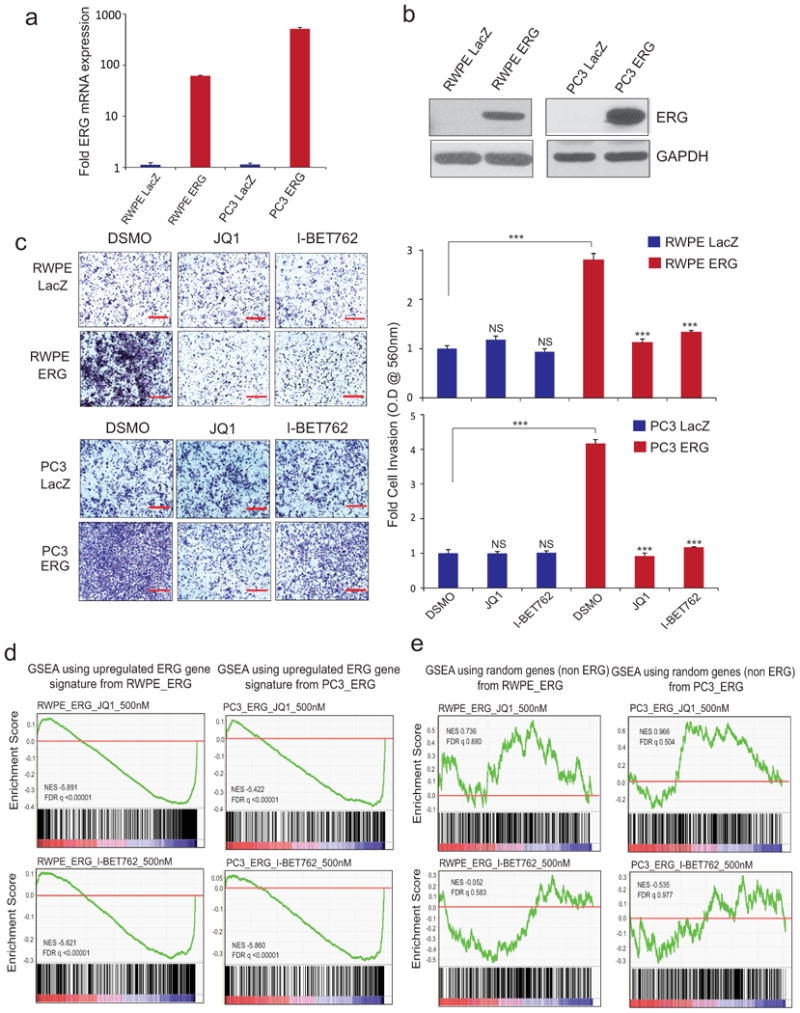
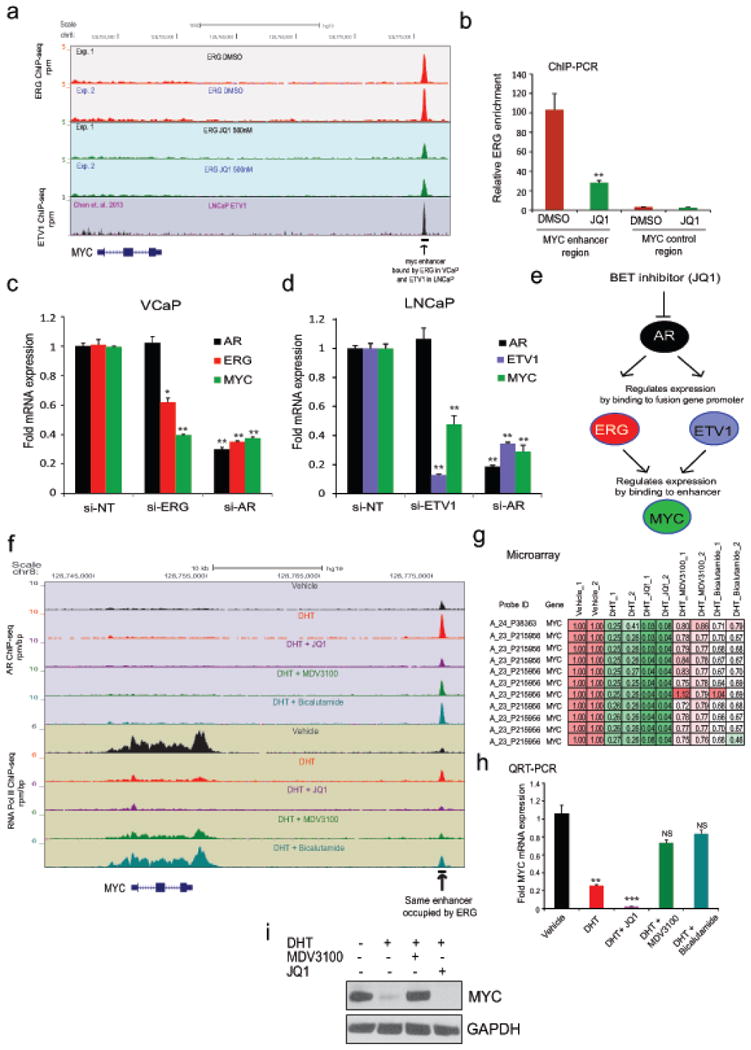
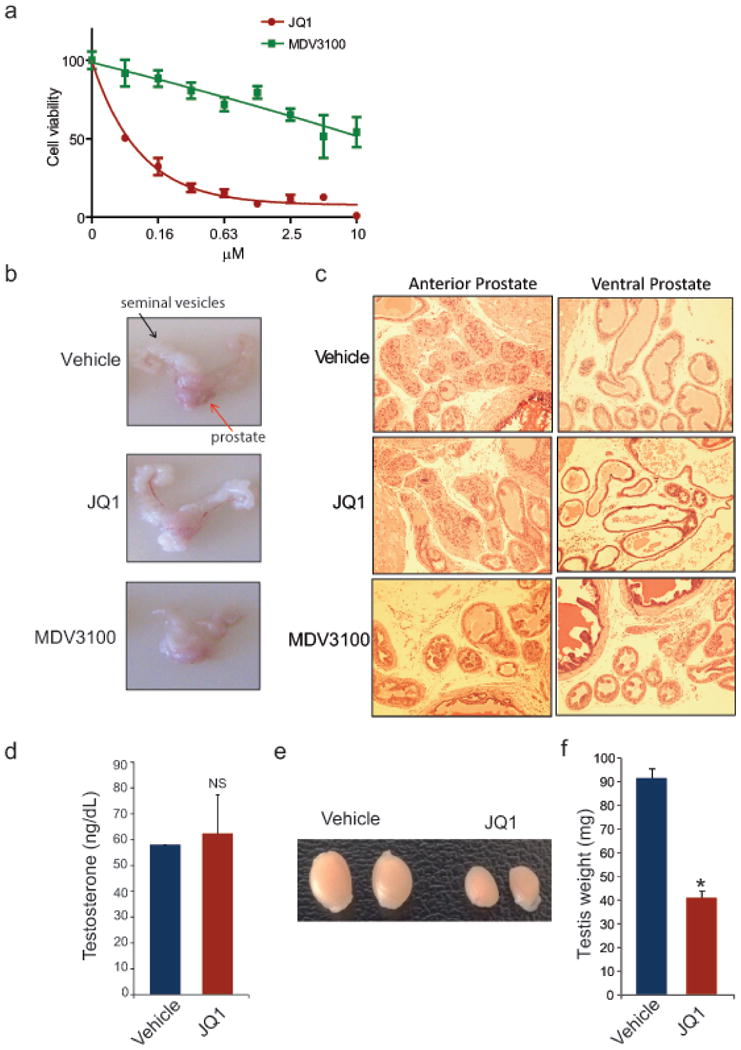
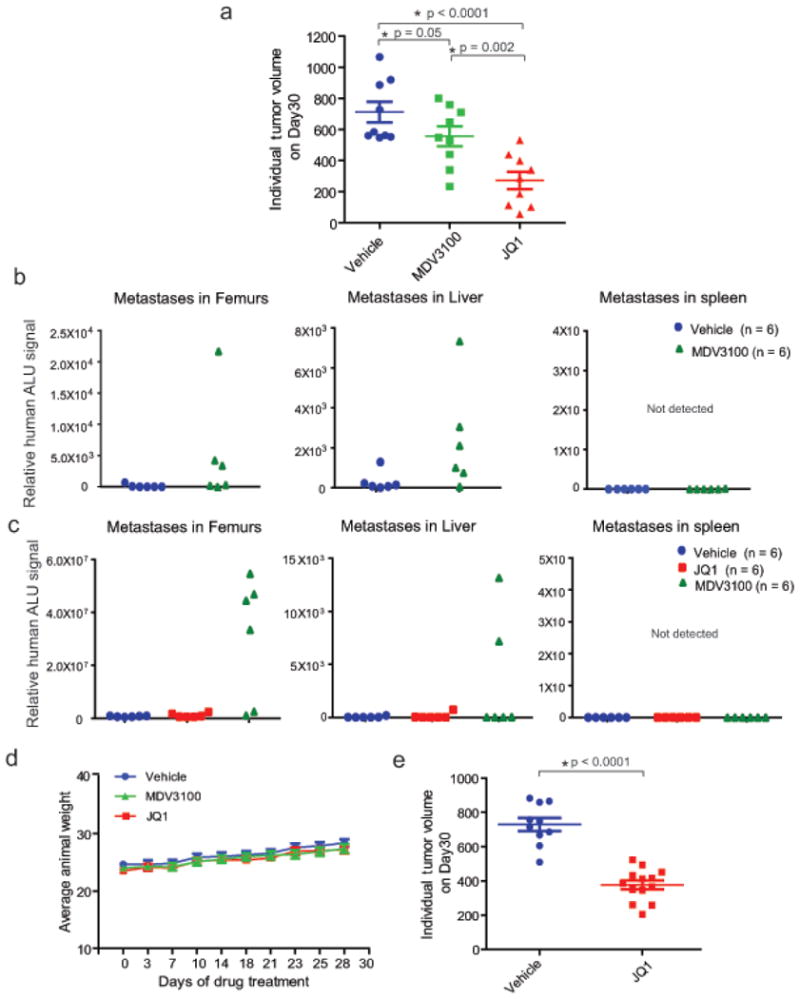
Men who develop metastatic castration-resistant prostate cancer (CRPC) invariably succumb to the disease. Progression to CRPC after androgen ablation therapy is predominantly driven by deregulated androgen receptor (AR) signalling. Despite the success of recently approved therapies targeting AR signalling, such as abiraterone and second-generation anti-androgens including MDV3100 (also known as enzalutamide), durable responses are limited, presumably owing to acquired resistance. Recently, JQ1 and I-BET762 two selective small-molecule inhibitors that target the amino-terminal bromodomains of BRD4, have been shown to exhibit anti-proliferative effects in a range of malignancies. Here we show that AR-signalling-competent human CRPC cell lines are preferentially sensitive to bromodomain and extraterminal (BET) inhibition. BRD4 physically interacts with the N-terminal domain of AR and can be disrupted by JQ1 (refs 11, 13). Like the direct AR antagonist MDV3100, JQ1 disrupted AR recruitment to target gene loci. By contrast with MDV3100, JQ1 functions downstream of AR, and more potently abrogated BRD4 localization to AR target loci and AR-mediated gene transcription, including induction of the TMPRSS2-ERG gene fusion and its oncogenic activity. In vivo, BET bromodomain inhibition was more efficacious than direct AR antagonism in CRPC xenograft mouse models. Taken together, these studies provide a novel epigenetic approach for the concerted blockade of oncogenic drivers in advanced prostate cancer.


Conflict of interest statement

Potential conflict of interest: A.M.C. serves as an advisor to Hologic, Life Technologies, and Ventana/Roche and has formally served as an advisor to GSK and Constellation Pharmaceuticals. A.M.C. and S.W. are co-founders of Oncofusion Therapeutics which is developing novel BET bromodomain inhibitors.

Figures

Figure 1
Figure 1. Prostate cancer cell lines with intact androgen signaling are sensitive to BET bromodomain inhibition
a, IC50 for JQ1 in each cell line is listed. b, Induction of apoptosis in VCaP prostate cancer cells by JQ1. Cleaved PARP (cPARP) immunoblot analysis. GAPDH served as a loading control. c, QRT-PCR analysis of indicated genes in VCaP treated with varying concentrations of JQ1 for 24hrs. Data represent mean ±S.E. (n=3) from one of the three independent experiments. d, Immunoblot analyses of AR, PSA and ERG levels in VCaP treated with JQ1. e, GSEA of the AR target gene signature in VCaP, LNCaP, 22RV1, and DU145 cells. NS, not-significant, *P ≤ 0.05, **P ≤ 0.005 by two-tailed Student's t-test.
Figure 2
Figure 2. Physical association of the N-terminal domain of AR with BRD4 and its disruption by BET bromodomain inhibition
a, VCaP nuclear extracts were fractionated on a Superose-6 column and AR, BRD4 and RNA PolII were analyzed by immunoblotting. b, Endogenous association of AR and BRD2/3/4. VCaP and LNCaP nuclear extracts were subjected to immunoprecipitation using an anti-AR antibody. Immunoprecipitates were analyzed for the presence of BRD2/3/4 by immunoblotting (upper panel). The immunoblot was stripped and reprobed for AR (lower panel). 5% total lysate was used as input control. c, Schematic of BRD4 and AR constructs used for co-immunoprecipitation experiments. BD1/2, bromodomain 1/2; ET, Extraterminal domain; CTd, C-terminal domain; NTd, N-terminal domain; DBd, DNA-binding domain; LBd, ligand-binding domain. d, N-terminal domain of BRD4 interacts with AR. Proteins from 293T cells co-transfected with various His-tag-BRD4 deletion and Halo-tag-AR constructs were subjected to immunoprecipitation with Halo-beads followed by immunoblotting with His-tag antibody. Inputs are shown in the bottom panel. e, as in d but with the indicated salt concentrations. f, Representative sensorgrams from 3 independent experiments for AR:BRD4 (BD1-BD2) by an OctetRED biolayer interferometry showing direct interaction. Real-time binding was measured by immobilizing biotinylated AR protein on the super streptavidin biosensor and subsequent interaction with varying concentrations of BRD4 (BD1-BD2) protein. The plots show the response versus protein concentration curves derived from the raw binding data. Right, Dissociation constant (Kd) represents the BRD4 (BD1-BD2) concentration yielding half-maximal binding to AR. Protein RNF2 was used as negative control. g, NTD domain of AR interacts with BD1 of BRD4. Equal amounts of in vitro translated proteins were combined and immunoprecipitated using Halo beads followed by immunoblot analysis with anti-GST antibody. h, JQ1 disrupts AR-BD1 interactions. Varying concentrations of JQ1 were incubated with AR-BD1, NTD1b-BD1, AR-BD2 complex prior to immunoprecipitation followed by immunoblot analysis.
Figure 3
Figure 3. BET bromodomain inhibition disrupts AR and BRD4 binding to target loci
a, AR ChIP-seq was performed in VCaP cells treated for 12hr with vehicle, DHT (10nM), DHT+JQ1 (500nM), DHT+MDV3100 (10μM) or DHT+Bicalutamide (25μM). Summary plot of AR enrichment (average coverage) across ARBs (AR Binding sites) in different treatment groups is shown. Data represent one of the two biological replicates. b, Venn diagram illustrating the overlap of AR and BRD4 enriched peaks in DHT treated sample. c, and d, Summary plot for AR and BRD4 enrichment for the AR-BRD4 overlapping (2,031) regions. e, Genome browser representation of AR, BRD4 and RNA PolII binding events on a putative “super-enhancer” of the AR-regulated BMPR1B gene. The y-axis denotes reads per million per base pair (rpm/bp). The x-axis denotes the genomic position with a scale bar on top right. The putative super-enhancer region enriched for AR, BRD4 and RNA PolII is depicted with a black bar on the top left.
Figure 4
Figure 4. BET bromodomain inhibition blocks CRPC in vivo
a, VCaPcells were implanted subcutaneously in mice and grown until tumors reached the size of approximately 100mm3. Xenografted mice were randomized and then received (n=6 per group) vehicle, 50mg/kg JQ1 or 10mg/kg MDV3100 as indicated 5days/week. Caliper measurements were taken bi-weekly. Mean tumor volume ±S.E. is shown. b, Individual tumor weight from different treatment groups with p-values is shown. c, Top panel, schematic illustrating the VCaP CRPC mouse xenograft experimental design. Bottom panel, castrated mice bearing VCaP CRPC xenograft received vehicle (n=6) or 50mg/kg JQ1 (n=7) as indicated 5days/week. Mean tumor volume ±S.E. is shown. Statistical significance by two-tailed Student's t-test. d, Schematic depicting varying mechanisms to block AR-signaling in CRPC. 1. Abiraterone inhibits androgen biosynthesis by blocking the enzyme CYP17A1. 2. MDV3100 competitively antagonizes androgen binding to AR preventing nuclear translocation and recruitment to target gene loci. 3. JQ1 (or BET-inhibitors) blocks AR and BRD2/3/4 interaction and co-recruitment to target gene loci as well as the functional activity and/or expression of ETS and MYC.
Extended Data Figure 1
Extended Data Figure 1. BET bromodomain inhibitor JQ1 blocks cell growth, induces apoptosis and transcriptionally suppresses anti-apoptotic factor BCL-xl without affecting BRD2/3/4 proteins
a, Cell viability curves for the 6 prostate lines treated with JQ1. N=6 wells of a 96 well plate per condition. b, BET-bromodomain proteins are ubiquitously expressed in prostate cell lines. AR and MYC protein levels are also shown. GAPDH serves as a loading control. c, Knockdown of BET-bromodomain proteins attenuates cell proliferation and invasion. Q-RT-PCR analyses of BRD2, BRD3 or BRD4 in VCaP cells transfected with siRNA against their respective transcript or NT (non-targeting) siRNA. Data show mean ± S.E. (n=3) from one of the three independent experiments. d, VCaP and LNCaP cell proliferation after indicated gene knockdown. 20,000 cells were seeded in 24-well plates following 24hrs post-transfection with siRNAs and counted on Day 0, 2, 4 and 6 (n=3) by coulter counter. Data show mean ± S.E. e, VCaP and LNCaP cell invasion (n=6) after indicated gene knockdown. JQ1 was used at 500nM. f, Cell cycle analysis of JQ1-treated prostate cell lines (after 48hr treatment with JQ1). Data represent 3 independent experiments. g, Induction of apoptosis as determined by appearance of cleaved PARP (cPARP) in VCaP prostate cancer cells by JQ1. GAPDH served as a loading control. h, Immunoblot demonstrating an increase in cPARP and decrease in BCL-xl in all three AR-positive cell lines compared to AR negative PC3 cells upon JQ1 treatment. i, Relative BCL-xl mRNA levels as determined by TaqMan qPCR in JQ1-treated cells. Data show mean ± S.E. (n=3) from one of three independent experiments. j, ChIP-seq data depicting loss of BRD2/3/4 recruitment to the BCL-xl promoter upon JQ1-treatment in VCaP cells. The Genome browser representation of BRD2/3/4 binding events on the BCL-xl promoter region. The y-axis denotes reads per million per base pair (rpm/bp), the x-axis denotes the genomic position. The bottom panel depicts H3K27ac mark on the same promoter region in VCaP cells. k, Colony formation assays of prostate cell lines. Cells were cultured in the presence or absence of 100 and 500nM of JQ1 for 12days followed by staining (upper panel) and quantification (lower panel, mean ± S.E. n=6). Representative photographs of crystal violet stained colonies (except for VCaP) used for quantification is shown. l, BET bromodomain inhibitor JQ1 does not affect its target proteins. QRT-PCR analyses of BRD2, BRD3 and BRD4 in prostate cancer cell line panel treated with two different concentrations of JQ1 for 24hrs. Data show mean ± S.E. (n=3) from one of the three independent experiments. m, Immunoblot analysis of BRD proteins in prostate cell line panel treated with JQ1 for 48hrs. GAPDH serves as a loading control. Asterisks on (a) and (m) indicates non-specific band. Representative blots shown are from triplicate biological experiment. NS, not significant; *P ≤ 0.01; **P ≤ 0.001 by two-tailed Student's t-test.
Extended Data Figure 2
Extended Data Figure 2. Effect of JQ1 on AR target genes and on MYC transcription
a, QRT-PCR analysis of indicated genes in LNCaP and 22RV1 cells treated with varying concentrations of JQ1 for 24hrs. Data show mean ± S.E. (n=3) from one of the two independent experiments. b, Immunoblot analysis of AR and PSA in a panel of prostate cancer cells after treatment with two different doses of JQ1. GAPDH serves as a loading control. c, ERG and PSA are transcriptional targets of JQ1. Proteasome inhibitor bortezomib does not rescue ERG and PSA levels in JQ1-treated VCaP cells. Immunoblot analyses of ERG and PSA in VCaP and PSA in LNCaP cells treated with JQ1 followed by incubation with bortezomib as indicated. MYC, known to be degraded by proteasome, was used as a positive control for bortezomib treatment. GAPDH serves as a loading control. d, GSEA showing loss of MYC signature (4 gene set) in AR-positive VCaP, LNCaP and 22RV1 cells but not AR-negative DU145 cells after JQ1 treatment; size- number of genes in each set; NES- normalized enrichment score; p- and FDRq, test of statistical significance. e, QRT-PCR and immunoblot analysis of MYC in JQ1-treated prostate cancer cells. Data show mean ± S.E. (n=3) from one of the two independent experiments. f, and g, time-course QRT-PCR and immunoblot analysis of MYC in AR-positive VCaP, LNCaP, and 22RV1 cells after JQ1-treatment. h, Cyclohexamide (translation inhibitor) treatment does not enhance JQ1-mediated loss of MYC protein ruling out post-translational degradation of MYC by JQ1. Time-course immunoblot analysis of MYC in VCaP, LNCaP, and 22RV1 cells treated with cyclohexamide or cyclohexamide+JQ1 as indicated. Representative blots from two independent experiments are shown. i, GAPDH-normalized MYC protein levels are shown. Band intensities from d were determined by ImageJ and the plots were generated using GraphPad Prism. j, MYC knockdown does not affect cell invasion. Box plot shows invasion of VCaP cells transfected with siNT or siMYC. Inset shows the image of invaded VCaP cells (n=6). Right, Q-RT-PCR of MYC upon siRNA transfection. Data show mean ± S.E. from one of the three independent experiments. k, Exogenous MYC introduction does not rescue JQ1-mediated cell growth inhibition. Cells were infected with control adeno-LacZ or adeno-MYC virus. Equal numbers of cells were plated 24hrs post infection and treated with 500nM JQ1 or I-BET762. Cells were counted (n=3 wells) and plotted; Day 0 of drug treatment was set at 100%. Data show mean ± S.E. from one of the four independent experiments. l, Immunblot analysis depicts overexpression of MYC in adeno-MYC infected cells on Day 0 and Day 7 of the experiment. GAPDH serves as a loading control. *P ≤ 0.05; **P ≤ 0.005 by two-tailed Student's t-test.
Extended Data Figure 3
Extended Data Figure 3. Physical association of AR with BRD4 and its disruption by BET bromodomain inhibitor
a, LNCaP nuclear extract was fractionated on a Superose-6 column and AR, BRD4 and RNA Pol II were analyzed by immunoblot analysis. b, and c, Representative sensorgrams for AR:RNF2, Ras:BRD4 (BD1-BD2) and RNF2:BRD4 (BD1-BD2) interactions by an OctetRED biolayer interferometry. Real time binding was measured by immobilizing biotinylated AR, Ras or RNF2 proteins separately on a streptavidin biosensor and subsequent interaction with varying concentrations of analyte proteins (RNF2 or BRD4 (BD1-BD2)) individually. Immobilized Ras or RNF2 biosensors did not display binding with BRD4 indicating that the AR-BRD4 interaction is specific. Representative sensorgrams from 4-6 independent experiment are shown. d and e, In vitro binding analysis of AR and indicated domains of BRD4. Equal amounts of in vitro translated full-length Halo-tag-AR protein and GST-tag-BRD4 domains were combined and immunoprecipitated using Halo beads followed by immunoblot analysis with anti-GST antibody. f, JQ1 disrupts the endogenous AR-BRD4 interaction. VCaP cells were treated with JQ1 for 6hrs followed by immunoprecipitation and immunoblot analysis as in Figure 2b.
Extended Data Figure 4
Extended Data Figure 4. Changes in genome-wide enrichment profiles of BRD proteins in response to bromodomain inhibitors
a, Table showing high-throughput sequencing read information for ChIP libraries of BRD2, BRD3, BRD4, AR, RNA Pol.II, ERG, H3K27ac and IgG performed for this study. b, Chromatin immunoprecipitation coupled to high-throughput sequencing (ChIP-seq) was performed using BRD2, BRD3, and BRD4 antibodies in VCaP cells treated with DMSO, JQ1 or I-BET762 for 12hrs. Genome-wide distribution of BRD2, BRD3, and BRD4 enriched sites. Highly significant peaks (see Methods) show relatively high overlap. A large majority of sites is occupied by at least two BRD proteins. BRD2 and BRD3 have the most similar localization pattern. c, BRD proteins show varying degrees of overlap. Shown is the ratio of sites occupied by either protein alone (unique) or co-occupied with another BRD-family protein (overlap). BRD4 shows the largest number of unique peaks. d, BET-inhibitors JQ1 and I-BET762 attenuate recruitment of BRD proteins from chromatin. Enrichment levels for each protein were normalized to the median enrichment in vehicle treated cells. BRD2 and BRD3 proteins show similar response to both inhibitors, whereas BRD4 is more potently evicted by JQ1. e, BET bromodomain inhibitors deplete target proteins from genomic regions with or without AR. Mean enrichment levels within each sub-panel were normalized to the maximum mean enrichment in vehicle treated cells.
Extended Data Figure 5
Extended Data Figure 5. Influence of JQ1 and anti-androgens on genome-wide recruitment of AR and their effect on DHT induced AR target gene expression
a, Two independent biological replicates of AR ChIP-seq experiments in VCaP cells show high correlation of normalized enrichment levels (see Methods) in the majority of treatment conditions. R-square values for each biological duplicate are shown. b, Mean enrichment (coverage) profiles are similar between biological replicates and different between treatment conditions, indicating that no adverse changes in enrichment levels are observed between the replicates. c, Bar graph showing total number of AR peaks for VCaP treated cells. The genome-wide individual peaks for AR yielded the highest number of peaks for DHT (35,390) whereas vehicle control cells displayed only 13,874 peaks However, the number of peaks for AR was 23,961, 18,264 and 32,212 in the presence of JQ1, MDV3100 and bicalutamide, respectively. d, Heatmap representation of AR binding peaks in different treatment groups. Genomic target regions are rank-ordered based on the level of AR enrichment at each AREs (Androgen Response Elements) within -1kb and +1kb flanking genomic region. e, Venn diagram illustrating the overlap of AR-bound genes between different treatment groups. f, AR-BRD4 binding on KLK3 and FASN upstream regions. Genome browser representation of AR and BRD4 binding events on a putative “enhancer” and “super-enhancer” of AR-regulated KLK3 and FASN gene respectively. The y-axis denotes reads per million per base pair (rpm/bp), the x-axis denotes the genomic position with a scale bar on top right. g, Expression of AR target genes in the presence of JQ1, MDV3100 or bicalutamide. Heat maps for VCaP and LNCaP cells treated with DHT (10nM), DHT+JQ1 (0.5μM), DHT+MDV3100 (10μM) and DHT+bicalutamide (25μM). Red arrows indicate well-characterized AR target genes. h, QRT-PCR analysis of AR-regulated genes in the VCaP and LNCaP treated cells. In order to directly compare JQ1 and MDV3100 in blocking AR signaling, cells were treated with varying concentrations of JQ1 or MDV3100 followed by DHT-treatment and analyzed for AR targets. The reduction in DHT-induced gene expression was observed for JQ1 even at 100-250nM whereas MDV3100 displayed a marginal reduction at 10μM, demonstrating the higher efficacy of JQ1 in blocking AR target gene expression. Data show mean ± S.E. (n =3) from one of the two independent experiments.
Extended Data Figure 6
Extended Data Figure 6. Effect of JQ1 on the TMPRSS2-ERG loci and ERG-mediated transcription in VCaP cells
a, Genome browser representation of RNA PolII binding events within the ERG gene body. The y-axis denotes reads per million mapped reads per base pair (rpm/bp), the x-axis denotes the genomic position and the black arrow indicates the region involved in TMPRSS2-ERG fusion. b, as in a, AR and BRD4 binding on promoter of ERG 5′-fusion partner TMPRSS2 in VCaP cells. Note the reduced RNA PolII and AR/BRD4 recruitment levels in DHT+JQ1 tracks for ERG gene body and TMPRSS2 promoter respectively. c, High reproducibility of ERG ChIP-seq experiments. Biological replicates of ERG ChIP-seq experiments show very high correlation of normalized enrichment levels (see Methods) in the JQ1- and DMSO-treated conditions. d, Significant changes in ERG levels upon JQ1 treatment at ERG-binding sites in the proximity of gene loci. Changes in ERG enrichment levels were assessed using DESeq2. Statistically significant differences were observed for ERG-gain and ERG-loss. Significant ERG-gains are associated with quantitatively modest changes in enrichment level. On the other hand significant ERG-losses are associated with greater changes in enrichment levels. Individual number of peaks for each panel is shown. e, Genome browser representation of ERG binding events on bona fide ERG-activating target genes. The y-axis denotes reads per million per base pair (rpm/bp), the x-axis denotes the genomic position. f, Genome browser representation of ERG binding events on ERG-repressed target genes. g, TaqMan QRT-PCR analysis of ERG-activated genes in VCaP cells after JQ1 treatment. h, TaqMan QRT-PCR analysis of ERG-repressed genes in VCaP cells after JQ1 treatment. Data represents mean ±S.D. (n= 3) from one of the two independent experiments.*P ≤ 0.05; **P ≤ 0.005,***P ≤ 0.0005 by two-tailed Student's t-test.
Extended Data Figure 7
Extended Data Figure 7. BET bromodomain inhibitors reverse ERG-mediated functions in an isogenic cell line system
a, and b, QRT-PCR and immunoblot showing overexpression of ERG in RWPE and PC3 prostate cell lines. Data represent mean ±S.E. (n= 3). c, BET-inhibitors block ERG-induced RWPE and PC3 cell invasion. RWPE and PC3 cells stably expressing either LacZ or ERG were treated with DMSO (n=4), 500nM JQ1 (n=4) or I-BET762 (n=4) for 24hrs prior to plating in Matrigel-coated Boyden chambers. After 48hrs cell invasion was quantified. Left, Representative photomicrographs of invaded cells are shown (lower Boyden chamber stained with crystal violet). Right, bar graph shows fold cell invasion with DMSO-treated LacZ expressing cells set to 1. Data represent mean ± S.E. from one of the three independent experiments. d, BET-inhibitors reverse ERG-induced gene transcription. Gene Set Enrichment Analysis (GSEA) of the ERG target gene signature (see method) in RWPE-ERG and PC3-ERG cells treated with JQ1 or I-BET762 (500nM) for 24hrs. ERG-induced genes are repressed by JQ1 or I-BET762 treatment. e, GSEA using a random gene set shows no significant positive or negative enrichment by JQ1 or I-BET762 treatment in RWPE-ERG and PC3-ERG cells. NS, not significant; ***P ≤ 0.0001 by two-tailed student's t-test.
Extended Data Figure 8
Extended Data Figure 8. JQ1 inhibits ETS (ERG/ETV1) factors that regulate MYC expression in VCaP and LNCaP cells
a, Genome browser representation of ERG and ETV1 binding events on the MYC distal enhancer. JQ1-treatment in VCaP cells reduces ERG enrichment as shown in two independent ERG ChIP-seq experiments. The y-axis denotes reads per million per base pair (rpm/bp), the x-axis denotes the genomic position. LNCaP ETV1 ChIP-seq data is from Chen et. al. 2013, displaying ETV1 recruitment to the MYC distal enhancer. b, ChIP-PCR validation of loss of ERG recruitment after JQ1-treatment in VCaP cells. Data show mean ± S.D. (n =3) from one of the two independent experiments. c, and d, Knock-down of AR or ETS factor reduces MYC gene expression in VCaP and LNCaP cells. QRT-PCR for AR, ETS and MYC expression in siNT, siAR or siETS transfected cells. Data show mean ± S.D. (n =3) from one of the two independent experiments. e, A cartoon illustrating the mechanism of MYC loss by JQ1 in AR positive VCaP and LNCaP cells. f, Anti-androgens but not JQ1 de-repress MYC expression in prostate cancer cells. Genome browser representation of AR and RNA PolII binding events within the MYC gene locus. The y-axis denotes reads per million per base pair (rpm/bp), the x-axis denotes the genomic position. Note the AR recruitment to the same distal enhancer which is occupied by ERG (see Extended Data Fig. 8a), implicating a competition between AR and ETS factor to bind to this enhancer region to regulate MYC gene expression. g, Heat map showing the MYC expression values from VCaP microarray gene expression data. h, Anti-androgen restores DHT-repressed MYC expression in VCaP cells. QRT-PCR of MYC in VCaP cells treated with vehicle, DHT (10nM), DHT+JQ1 (500nM), DHT+MDV3100 (10μM) or DHT+Bicalutamide (25μM). Inability of JQ1 to de-repress MYC in this setting could be explained by the fact that both AR and ERG is de-recruited from MYC distal enhancer leading to net loss of MYC expression. i, MDV3100 and not JQ1 restores DHT-repressed MYC protein levels in VCaP cells. Immunoblot of MYC protein in VCaP cells pre-treated with vehicle, MDV3100 (10μM) or JQ1 (500nM) for 4hrs followed by DHT (10nM) for 20hrs. Data show mean ± S.D.(n =3) from one of the two independent experiments. NS, not significant; *P ≤ 0.01; **P ≤ 0.001; **P ≤ 0.0001 by two-tailed Student's t-test.
Extended Data Figure 9
Extended Data Figure 9. JQ1 does not affect normal prostate growth and testosterone levels but reduces testis size in mice
a, Comparison of JQ1 and MDV3100 treatment on VCaP cell viability in vitro. N=8 wells of a 96 well plate per condition. VCaP cells were treated with MDV3100 or JQ1 for 8 days and assayed for viability with Cell-titerGLO. b, Gross images showing highly hormone-responsive seminal vesicles (s.v.) attached to prostate gland (red and black arrows respectively) from male mice treated for 30 days with vehicle, JQ1 (50mg/kg) or MDV3100 (10mg/kg). Vehicle or JQ1-treated mice show no change in the appearance of seminal vesicles. By contrast, MDV3100-treated animals display remarkable shrinkage of seminal vesicles. c, Mice treated with JQ1 do not show any adverse changes to anterior or ventral prostate morphology. The H&E images show normal morphology of anterior and ventral prostate from vehicle or JQ1-treated mice. MDV3100-treated mice display attenuated remnant glands of anterior or ventral prostate. d, Male mice (n =3 per group) treated with vehicle or JQ1 for 30 days exhibit similar serum testosterone levels. Data represents the mean ± S.E. e, Gross analysis of testis from mice treated with vehicle or JQ1 for 30 days. f, Testis weight from vehicle control or JQ1-treated mice. Data represents the mean ± S.E. from n=7 mice per group. NS, not significant; *P ≤ 0.0001 by two-tailed Student's t-test.
Extended Data Figure 10
Extended Data Figure 10. In vivo effects of BET bromodomain inhibition in VCaP xenograft model
a, VCaP cells were implanted subcutaneously in mice and grown until tumors reached the size of approximately 100mm3. Xenografted mice were randomized and then received vehicle, 50mg/kg JQ1 or 10mg/kg MDV3100 5 days/week as indicated. Caliper measurements were taken bi-weekly. Individual tumor volume from different treatment groups at the end of the experiments with p-values is shown. b, MDV3100 treatment leads to spontaneous metastasis. Mice bearing VCaP xenografts (subcutaneously engrafted) treated with vehicle (n=6) or MDV3100 (n=6) were assessed for spontaneous metastasis to the femur (bone marrow) and soft tissues such as liver and spleen. Genomic DNA isolated from these sites was analyzed for metastasized cells by measuring human ALU sequence (by Alu-QPCR). MDV3100-treated mice displayed spontaneous metastasis to femur and liver. Spleen did not show presence of human ALU sequences. c as in a, for mice bearing VCaP xenografts treated with vehicle (n = 6), JQ1 (n = 6) or MDV3100 (n = 6). MDV3100-treated but not JQ1-treated mice displayed metastasis to femur and liver. d, JQ1 or MDV3100 treatment does not affect animal weight. Mice from VCaP cell xenograft experiments treated with vehicle, 10mg/kg MDV3100 or 50mg/kg JQ1 were weighed at the time of caliper measurements. e, Individual tumor volume for vehicle or JQ1-treated VCaP mouse xenograft (for data shown in Figure 4c). Mean ± S.E. is plotted. Statistical significance by two-tailed Student's t-test.

Comment in

References

    1. Taylor BS, et al. Integrative genomic profiling of human prostate cancer. Cancer Cell. 2010;18:11–22. - PMC - PubMed
    1. Chen CD, et al. Molecular determinants of resistance to antiandrogen therapy. Nat Med. 2004;10:33–39. - PubMed
    1. Visakorpi T, et al. In vivo amplification of the androgen receptor gene and progression of human prostate cancer. Nat Genet. 1995;9:401–406. - PubMed
    1. Stein MN, Goodin S, Dipaola RS. Abiraterone in prostate cancer: a new angle to an old problem. Clin Cancer Res. 2012;18:1848–1854. - PMC - PubMed
    1. Reid AH, et al. Significant and sustained antitumor activity in post-docetaxel, castration-resistant prostate cancer with the CYP17 inhibitor abiraterone acetate. J Clin Oncol. 2010;28:1489–1495. - PMC - PubMed

Publication types

MeSH terms

Associated data