. 2014 Apr 23;9(4):e96036.
doi: 10.1371/journal.pone.0096036. eCollection 2014.

A method to assess target gene involvement in angiogenesis in vitro and in vivo using lentiviral vectors expressing shRNA

Affiliations

A method to assess target gene involvement in angiogenesis in vitro and in vivo using lentiviral vectors expressing shRNA

Wayne Blosser et al. PLoS One. .

Abstract

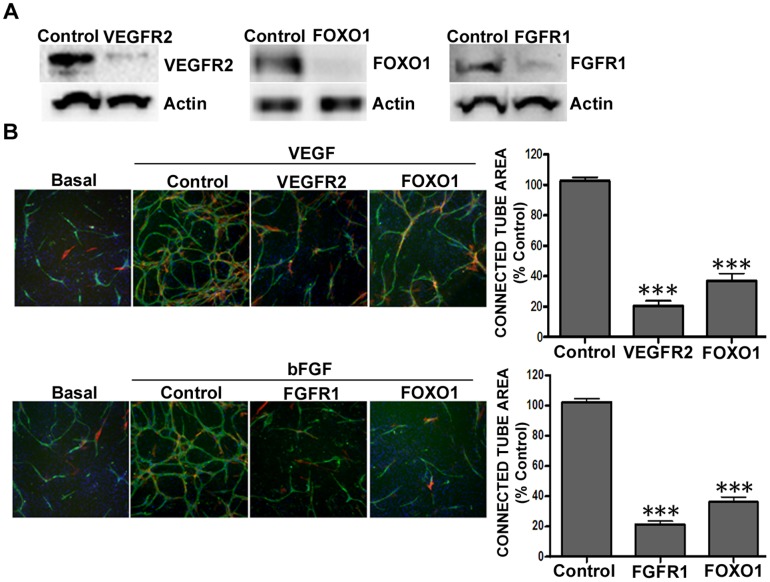
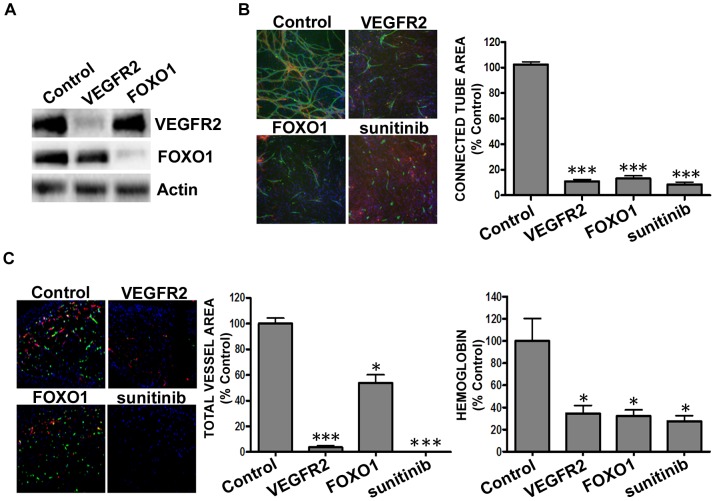
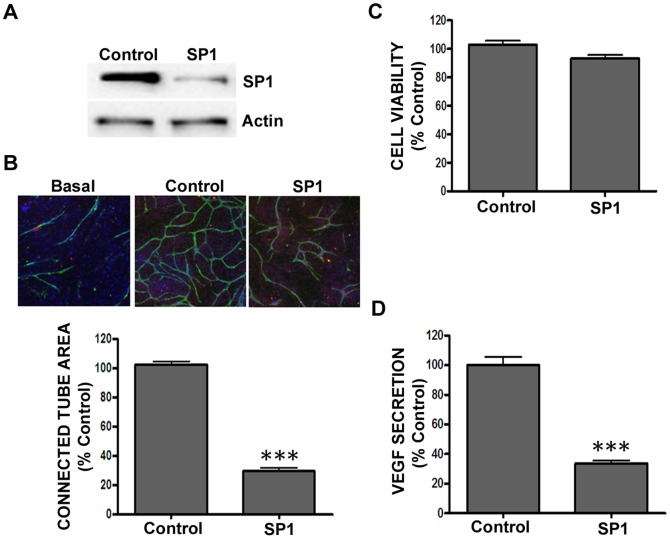
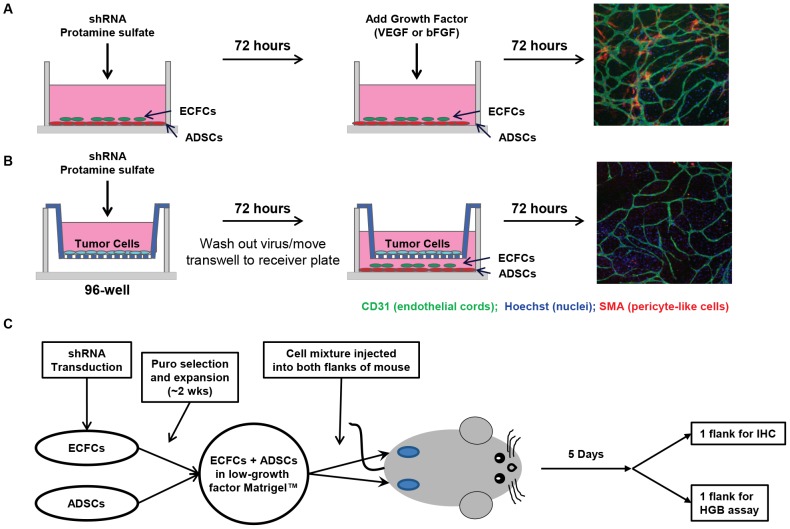
Current methods to study angiogenesis in cancer growth and development can be difficult and costly, requiring extensive use of in vivo methodologies. Here, we utilized an in vitro adipocyte derived stem cell and endothelial colony forming cell (ADSC/ECFC) co-culture system to investigate the effect of lentiviral-driven shRNA knockdown of target genes compared to a non-targeting shRNA control on cord formation using High Content Imaging. Cord formation was significantly reduced following knockdown of the VEGF receptor VEGFR2 in VEGF-driven cord formation and the FGF receptor FGFR1 in basic FGF (bFGF)-driven cord formation. In addition, cord formation was significantly reduced following knockdown of the transcription factor forkhead box protein O1 (FOXO1), a protein with known positive effects on angiogenesis and blood vessel stabilization in VEGF- and bFGF-driven cord formation. Lentiviral shRNA also demonstrated utility for stable knockdown of VEGFR2 and FOXO1 in ECFCs, allowing for interrogation of protein knockdown effects on in vivo neoangiogenesis in a Matrigel plug assay. In addition to interrogating the effect of gene knockdown in endothelial cells, we utilized lentiviral shRNA to knockdown specificity protein 1 (SP1), a transcription factor involved in the expression of VEGF, in U-87 MG tumor cells to demonstrate the ability to analyze angiogenesis in vitro in a tumor-driven transwell cord formation system and in tumor angiogenesis in vivo. A significant reduction in tumor-driven cord formation, VEGF secretion, and in vivo tumor angiogenesis was observed upon SP1 knockdown. Therefore, evaluation of target gene knockdown effects in the in vitro co-culture cord formation assay in the ADSC/ECFC co-culture, ECFCs alone, and in tumor cells translated directly to in vivo results, indicating the in vitro method as a robust, cost-effective and efficient in vitro surrogate assay to investigate target gene involvement in endothelial or tumor cell function in angiogenesis.


Conflict of interest statement

Competing Interests: The authors have read the journal's policy and have the following conflicts: Authors affiliated with Eli Lilly and Company have Eli Lilly and Company shares received via 401(k) and bonus plans and have an affiliation to the commercial funders of this research (Eli Lilly). Advanced Testing Laboratories is a contractor of Lilly and therefore have an affiliation to the commercial funders of this research (Eli Lilly). This does not alter the authors' adherence to all the PLOS ONE policies on sharing data and materials.

Figures

Figure 1
Figure 1. Reduction in VEGFR2, FGFR1, or FOXO1 expression in ADSCs/ECFCs reduced growth factor-driven in vitro cord formation.
(AB); ADSCs/ECFCs were transduced with non-targeting (control), or pooled shRNA directed against VEGFR2, FOXO1, or FGFR1, for 72 hours and (A) whole cell protein extracts were isolated and subjected to Western blot analysis using antiserum against VEGFR2, FOXO1 and FGFR1 (82.1±5.9, 91.5±2.7 and 73.7±7.1% knockdown respectively), using β-actin as a loading control, or (B) analyzed for cord formation with PBS (Basal), 10 ng/ml VEGF, or 15 ng/ml bFGF stimulation for 72 hours before immunohistochemistry for CD31 (green), α-smooth muscle actin (red), and Hoechst to stain nuclei (blue). Representative images (5× magnification) are shown. Graphs represent mean ± standard error from three independent experiments, and asterisks denote statistically significant differences (*, p<0.05; **, p<0.01; ***, p<0.001) compared to non-targeting shRNA controls.
Figure 2
Figure 2. Reduction in VEGFR2 or FOXO1 expression in ECFCs reduced hemoglobin content and vascularization in vivo.
(A-B) ECFCs were transduced with non-targeting (control), or pooled shRNA directed against VEGFR2 or FOXO1 and (A) whole cell protein extracts were isolated and subjected to Western blot analysis using antiserum against VEGFR2 and FOXO1 (85.2±7.7 and 85.1±3.9% knockdown respectively), using β-actin as a loading control, or (B) were over seeded onto ADSCs for 4 hours prior to 10 ng/ml VEGF stimulation for 72 hours before immunohistochemistry for CD31 (green), α-smooth muscle actin (red), and Hoechst dye to stain all nuclei (blue). As a control, ADSC/ECFC co-cultures were treated simultaneously with 10 ng/ml VEGF and 100 nM sunitinib. Representative images (5× magnification) are shown. Graphs represent mean ± standard error from three independent experiments, and asterisks denote statistically significant differences (*, p<0.05; **, p<0.01; ***, p<0.001) compared to non-targeting shRNA controls. (C-D) ECFCs transduced with non-targeting (control) or pooled shRNA directed against VEGFR2 or FOXO1 were mixed with ADSCs and co-implanted subcutaneously into the flanks of athymic nude mice. Oral dosing of a subset of mice began 4 hours prior to cell implantation and occurred twice daily with sunitinib (25 mg/kg). After 5 days of dosing, Matrigel plugs were removed and hemoglobin was quantified (C), and vasculature was visualized and quantified with immunohistochemistry (D) for human CD31 (green), anti-SMA (myofibroblasts, red), and Hoechst to stain nuclei (blue). Graphs indicate mean ± standard error from one experiment (n = 8), and asterisks denote statistically significant differences (*, p<0.05; **, p<0.01; ***, p<0.001) compared to non-targeting shRNA control vector.
Figure 3
Figure 3. Reduction in SP1 expression in U-87 MG cells (in cord assay) reduced tumor-driven cord formation.
(A-B) U-87 MG cells were plated in permeable transwells and transduced with non-targeting shRNA (control) or pooled shRNA directed against SP1 for 72 hours prior to (A) whole cell protein extract isolation and Western blot analysis using antiserum directed against SP1 (61.3±9.0% knockdown) and β-actin as a loading control, and (B) movement of the U-87 MG cells into ADSC/ECFC co-culture receiver plates. Cord formation was assessed following 72 hours by immunohistochemistry for CD31 (green), α-smooth muscle actin (red), and Hoechst to stain nuclei (blue). Representative images (5× magnification) are shown. (C) U-87 MG cell viability assesment by cellular ATP production using Cell Titer Glo Assay. (D) ELISA analysis for VEGF secretion in U-87 MG conditioned media. Graphs represent mean ± standard error from three independent experiments, and asterisks denote statistically significant differences (*, p<0.05; **, p<0.01; ***, p<0.001) compared to the non-targeting shRNA control vector.
Figure 4
Figure 4. Reduction in SP1 expression in U-87 MG cells reduced tumor angiogenesis.
(A-B) U-87 MG cells were transduced with non-targeting shRNA (control) or pooled shRNA directed against SP1 prior to (A) whole cell protein extract isolation and Western blot analysis using antiserum directed against SP1 (79.5±3.7% knockdown) and β-actin as a loading control, and (B) plating into permeable transwell plates above ADSC/ECFC co-culture receiver plates. Cord formation was assessed following 72 hours by immunohistochemistry for CD31 (green), α-smooth muscle actin (red), and Hoechst dye to stain all nuclei (blue). Representative images (5× magnification) are shown. Graphs represent mean ± standard error from three independent experiments, and asterisks denote statistically significant (*, p<0.05; **, p<0.01; ***, p<0.001) differences compared to the non-targeting shRNA control vector. (C) U-87 MG cells transduced with non-targeting shRNA (control) or shRNA directed against SP1 were implanted subcutaneously into the flanks of athymic nude mice. Oral dosing of mice with sunitinib (40 mg/kg) began when tumors reached ∼300 mm3 and occurred once daily. After 6 days of dosing, tumors were removed and (C) hemoglobin was quantified and (D) vasculature was visualized by immunofluorescence for CD31 (green), α-smooth muscle actin (red), GLUT1 (yellow), or Hoechst to stain all nuclei (blue). Quantitative tissue imaging was done by automated microscopy to assess tumor vascularization. Graphs (C-D) indicate mean ± standard error from one experiment (control, n = 14; SP1, n = 16; sunitinib, n = 9), and asterisks denote statistically significant differences (*, p<0.05; **, p<0.01; ***, p<0.001) compared to non-targeting shRNA control vector.
Figure 5
Figure 5. Schematic overview of the in vitro and in vivo assays.
(A-B) In vitro cord formation assays, (A) in growth factor driven cord formation ADSCs and ECFCs are grown in co-culture and co-transduced with shRNA targeting a specific gene or a non-targeting control. Stimulation of cord formation occurs with the addition of VEGF or bFGF (other growth factors have also been successfully tested- see details in the text; (B) in tumor driven cord formation tumor cells are plated separately in a transwell plate and transduced with shRNA targeting a specific gene or non-targeting control. Following 72 hours of incubation, virus is washed out and the transwell is moved into the ADSC/ECFC co-culture receiver plate where the tumor cells sit above, but physically separate from the ADSC/ECFC co-culture. Cord formation is driven by soluble factors secreted by the tumor cells; (C) For the in vivo assay, ECFCs are transduced with shRNA targeting a specific gene or non-targeting control. A stable expression cell pool is generated through antibiotic selection with puromycin. Stably transduced ECFCs are then mixed with ADSCs in low-growth factor Matrigel and implanted into both flanks of a nude mouse. After 5 days the angiogenic plugs are removed with one plug slated for IHC analysis and the other plug analysed for hemoglobin content.

References

    1. Kebers F, Lewalle JM, Desreux J, Munaut C, Devy L, et al. (1998) Induction of endothelial cell apoptosis by solid tumor cells. Exp Cell Res 240: 197–205. - PubMed
    1. Bishop ET, Bell GT, Bloor S, Broom IJ, Hendry NF, et al. (1999) An in vitro model of angiogenesis: basic features. Angiogenesis 3: 335–344. - PubMed
    1. Merfeld-Clauss S, Gollahalli N, March KL, Traktuev DO (2010) Adipose tissue progenitor cells directly interact with endothelial cells to induce vascular network formation. Tissue Eng Part A 16: 2953–2966. - PMC - PubMed
    1. Chen Y, Wei T, Yan L, Lawrence F, Qian HR, et al. (2008) Developing and applying a gene functional association network for anti-angiogenic kinase inhibitor activity assessment in an angiogenesis co-culture model. BMC Genomics 9: 264. - PMC - PubMed
    1. Jih YJ, Lien WH, Tsai WC, Yang GW, Li C, et al. (2001) Distinct regulation of genes by bFGF and VEGF-A in endothelial cells. Angiogenesis 4: 313–321. - PubMed

MeSH terms