. 2014 Apr 23;9(4):e91947.
doi: 10.1371/journal.pone.0091947. eCollection 2014.

Non-thermal atmospheric pressure plasma preferentially induces apoptosis in p53-mutated cancer cells by activating ROS stress-response pathways

Affiliations

Non-thermal atmospheric pressure plasma preferentially induces apoptosis in p53-mutated cancer cells by activating ROS stress-response pathways

Yonghao Ma et al. PLoS One. .

Abstract

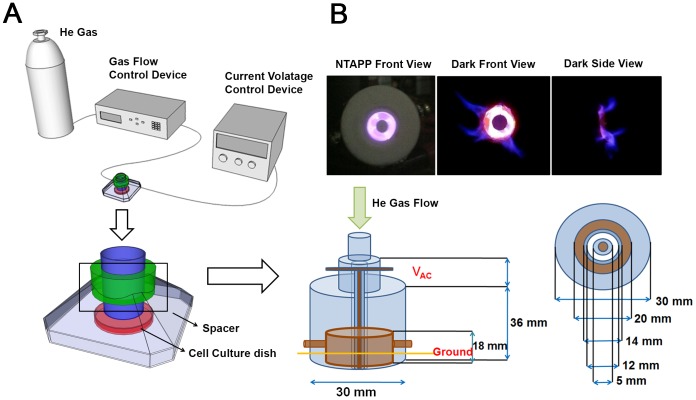
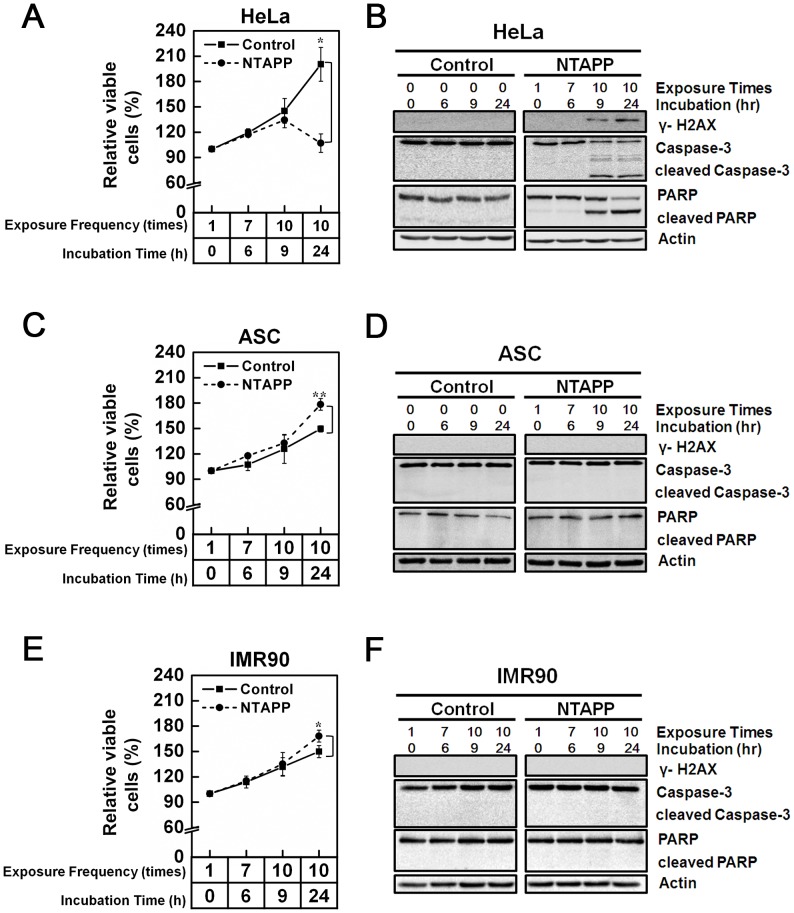
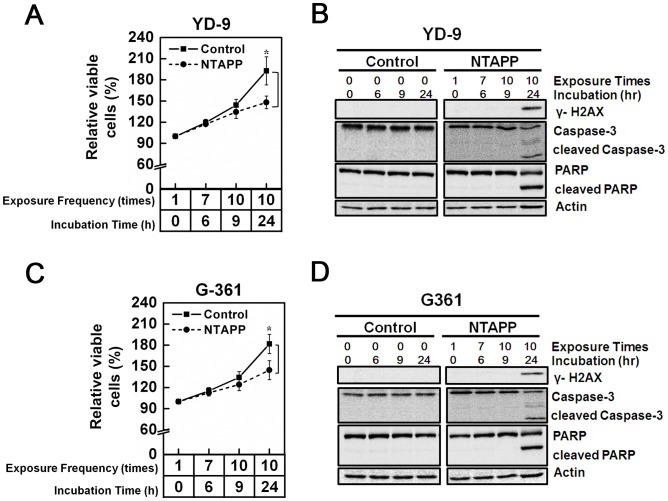
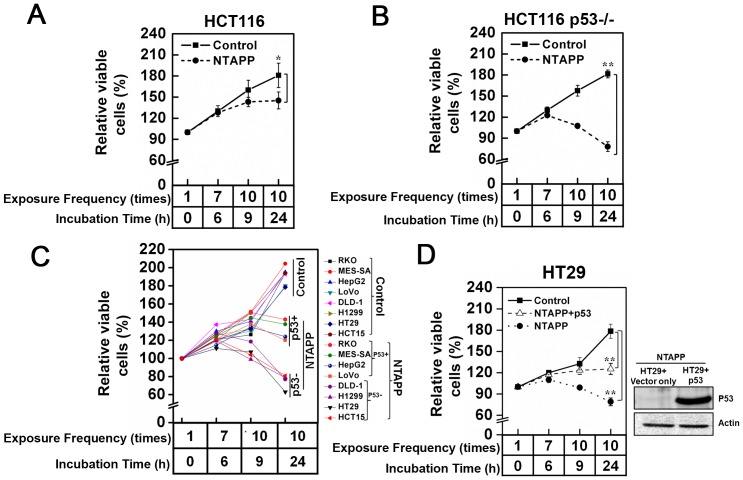
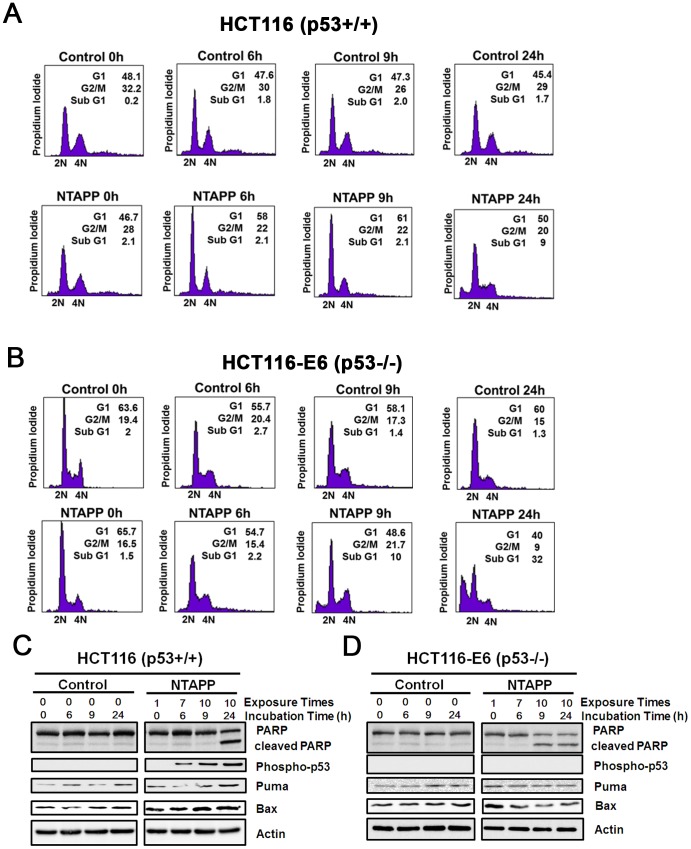
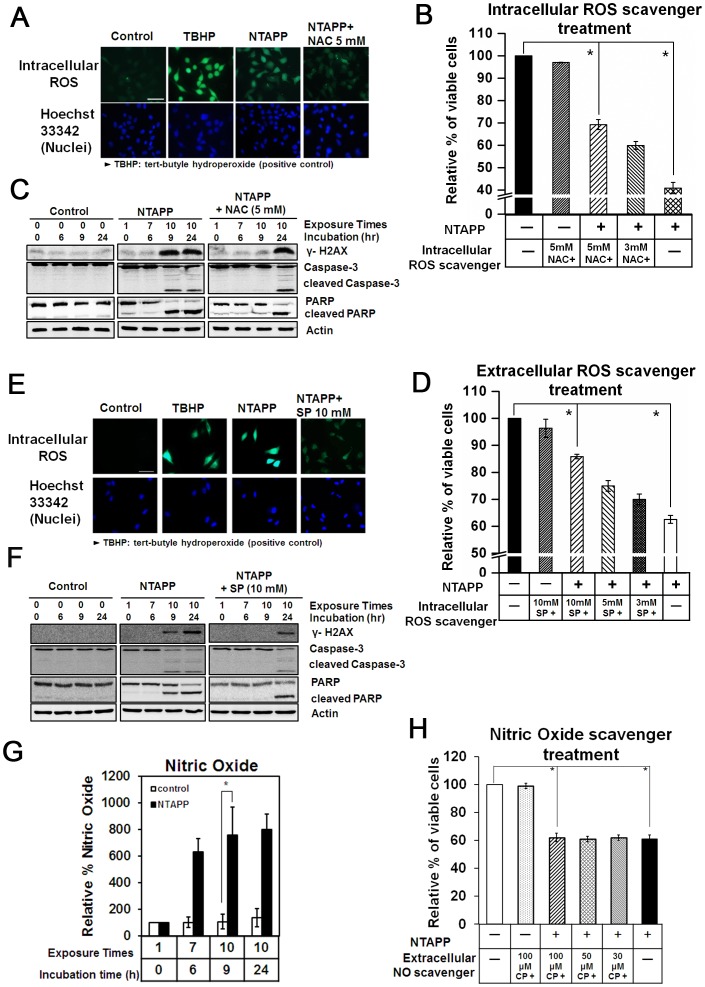
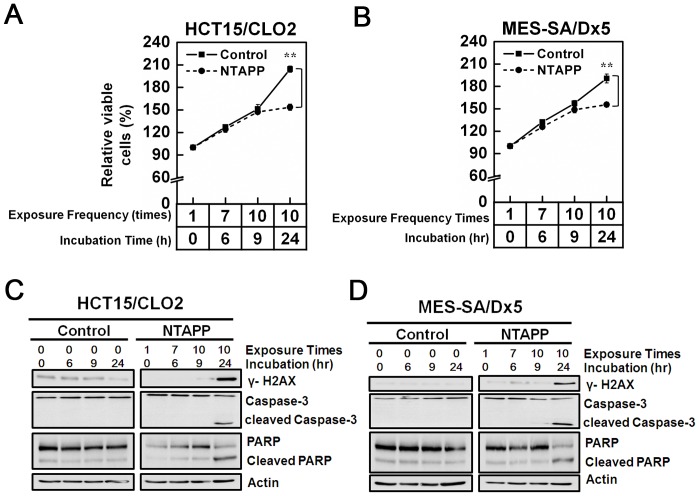
Non-thermal atmospheric pressure plasma (NTAPP) is an ionized gas at room temperature and has potential as a new apoptosis-promoting cancer therapy that acts by generating reactive oxygen species (ROS). However, it is imperative to determine its selectivity and standardize the components and composition of NTAPP. Here, we designed an NTAPP-generating apparatus combined with a He gas feeding system and demonstrated its high selectivity toward p53-mutated cancer cells. We first determined the proper conditions for NTAPP exposure to selectively induce apoptosis in cancer cells. The apoptotic effect of NTAPP was greater for p53-mutated cancer cells; artificial p53 expression in p53-negative HT29 cells decreased the pro-apoptotic effect of NTAPP. We also examined extra- and intracellular ROS levels in NTAPP-treated cells to deduce the mechanism of NTAPP action. While NTAPP-mediated increases in extracellular nitric oxide (NO) did not affect cell viability, intracellular ROS increased under NTAPP exposure and induced apoptotic cell death. This effect was dose-dependently reduced following treatment with ROS scavengers. NTAPP induced apoptosis even in doxorubicin-resistant cancer cell lines, demonstrating the feasibility of NTAPP as a potent cancer therapy. Collectively, these results strongly support the potential of NTAPP as a selective anticancer treatment, especially for p53-mutated cancer cells.


Conflict of interest statement

Competing Interests: The authors have declared that no competing interests exist.

Figures

Figure 1
Figure 1. The NTAPP device used in this study.
(A) Schematic description of the NTAPP-generating device used to treat living cells. The dielectric material used is Teflon (polytetrafluoroethyle), and the electrode is made of copper. (B) NTAPP generated from the device. The plasma density is on the order of 1012/cm3, and the total power consumed in the plasma is 1.11 W for a peak to peak voltage of 7 kV with an input DC voltage of 5 V. The amounts of calculated ROS species are shown in Figure S1.
Figure 2
Figure 2. Differential effect of NTAPP on different types of human cells.
(A–F) (A, B) HeLa, (C, D) adipose tissue-derived stem cells (ASCs), and (E, F) IMR90 cells were exposed with 5 V input NTAPP for 30 s every h for 10 times, and cell viability was evaluated at each indicated exposure frequency. Incubation time indicates the time after initial exposure to NTAPP. The 24-h incubation sample was prepared with 10 repetitive NTAPP exposures followed by further incubation for 15 h. (A, C, E) The relative percentages of viable cells are shown comparing the initial cell number prior to exposure and incubation as 100%. Viable cells were quantified with MTT assays, and data are shown as mean ± SEM from three independent experiments. p<0.05 (*) and p<0.01 (**) indicate significant differences compared with the control condition. (B, D, F) For the same NTAPP-exposed samples of (A), (C), (E), respectively, γ-H2AX, caspase-3, cleaved caspase-3, PARP, and cleaved PARP were assessed by western blot analyses. Actin is shown as a loading control.
Figure 3
Figure 3. Anti-proliferative effect of NTAPP on melanoma and oral carcinoma cells.
(A–D) (A, B) Oral squamous carcinoma YD-9 and (C, D) melanoma G361 cells were exposed with 5 V input NTAPP for 30 s every h for 10 times, and cell viability was evaluated at each indicated exposure frequency. Incubation time indicates the time after initial exposure to NTAPP. The 24-h incubation sample was prepared with 10 repetitive NTAPP exposures followed by further incubation for 15 h. (A, C) The relative percentages of viable cells are shown comparing the initial cell number prior to exposure and incubation as 100%. Viable cells were quantified with MTT assays, and data are shown as mean ± SEM from three independent experiments. p<0.05 (*) and p<0.01 (**) indicate significant differences compared with the control condition. (B, D) For the same NTAPP-exposed samples of (A) and (C), respectively γ-H2AX, caspase-3, cleaved caspase-3, PARP, and cleaved PARP were assessed by western blot analyses. Actin is shown as a loading control.
Figure 4
Figure 4. Highly preferential anti-proliferative effect of NTAPP on cancer cells without functional p53.
(A–D) Indicated cancer cell lines were exposed with 5 V input NTAPP for 30 s every h for 10 times, and cell viability was evaluated at each indicated exposure frequency. Incubation time indicates the time after the initial NTAPP exposure. The 24 h incubation was prepared with 10 repetitive NTAPP exposures followed by further incubation for 15 h. The relative percentages of viable cells are shown comparing the initial cell number prior to exposure and incubation as 100%. Viable cells were quantified with MTT assays, and data are shown as mean ± SEM from three independent experiments. p<0.05 (*) and p<0.01 (**) indicate significant differences compared with the control condition. (A, B) After NTAPP exposure, the relative percentage of viable cells were plotted for (A) HCT116 (p53+/+) and (B) HCT116-E6 (p53−/−), both of which have the same genetic background except for the (A) presence and (B) absence of functional p53. (C) The relative percentages of viable cells were plotted together after the same NTAPP exposures in p53-proficient cells (RKO, MES-SA, HepG2, G361, LoVo) and p53-deficient cells (DLD-1, H1299, HT29, HCT115). (D) p53-deficient HT29 cells were transfected with pcDNA-p53-HA, and the expression of p53 in HT29 was verified by a western blot shown on the right side with actin as a loading control. The relative percentages of viable cells in HT29 and p53-transfected HT29 cells were plotted after the same NTAPP exposures.
Figure 5
Figure 5. p53 activation and G1 cell cycle delay by NTAPP in p53-proficient cancer cells.
(A, B) HCT116 (p53+/+) and (B) HCT116-E6 (p53−/−) cells were exposed with 5 V input NTAPP for 30 s every h for maximum 10 times, and DNA content was evaluated by flow cytometry after propidium iodide staining at each indicated incubation time, which indicates the time after initial exposure to NTAPP. The 24 h incubation sample was prepared with 10 repetitive NTAPP exposures followed by further incubation for 15 h. (C, D) In the same NTAPP-exposed samples of (A, B), PARP, cleaved PARP, Ser 15 phophorylated p53, Puma and BAX were assessed respectively by western blot analyses. Actin is shown as a loading control.
Figure 6
Figure 6. Anti-proliferative roles of ROS generated by NTAPP exposures.
(A) HeLa cells pretreated with 5 mM N-acetyl cysteine (NAC), only with culture medium (a negative control), or 100 µM tert-butyl hydroperoxide (TBHP, a positive control of ROS generation) were exposed with 5 V input NTAPP for 30 s every h for seven times. The intracellular ROS generated was monitored with fluorescent microscopy. Nuclei were stained with Hoechst 33342. Scale bar, 50 µm. (B) HeLa cells pretreated with different concentrations of NAC (untreated, 3 mM, 5 mM) were exposed with 5 V input NTAPP for 30 s every h 10 times and further incubated for 15 h. The relative percentages of viable cells are shown comparing the initial cell number prior to exposure and incubation as 100%. Viable cells were quantified with MTT assays, and data are shown as mean ± SEM from three independent experiments. p<0.05 (*) indicates a significant difference compared with the control. (C) For the same NTAPP-exposed samples of cells in (B) that were untreated or pretreated with 5 mM NAC, γ-H2AX, caspase-3, cleaved caspase-3, PARP, and cleaved PARP were assessed by western analyses. Actin is shown as a loading control. (D) HeLa cells pretreated with 10 mM sodium pyruvate (SP), only with culture medium (a negative control), or 100 µM TBHP were exposed with 5 V input NTAPP for 30 s at every h seven times. The intracellular ROS generated was monitored by detection with CM-H2DCFDA reagent using fluorescent microscopy. Nuclei were stained with Hoechst 33342. Scale bar, 50 µm. (E) HeLa cells pretreated with different concentrations of SP (0, 3, 5, 10 mM) were exposed with 5 V input NTAPP for 30 s every h 10 times and further incubated for 15 h. The relative percentages of viable cells are shown comparing the initial cell number prior to exposure and incubation as 100%. Viable cells were quantified with MTT assays, and data are shown as mean ± SEM from three independent experiments. p<0.05 (*) indicates significant difference compared with control. (F) For the same NTAPP-exposed samples in (E) untreated or pretreated with 10 mM SP, γ-H2AX, caspase-3, cleaved caspase-3, PARP, and cleaved PARP were assessed by western analyses. Actin is shown as a loading control. (G) The NO concentrations in the media were measured with Griess tests after NTAPP exposures. Data are shown as the mean ± SEM from three independent experiments. p<0.05 (*) indicates significant difference compared with control. (H) HeLa cells were pretreated with different concentrations of a NO scavenger, carboxy-PTIO (0, 30, 50, 100 µM), exposed to NTAPP 10 times, and further incubated for 15 h. Cell viability was quantified with MTT assay, and the relative percentages of viable cells were plotted comparing the levels in untreated cells. Data are shown as mean ± SEM from three independent experiments. p<0.05 (*) indicates significant difference compared with control.
Figure 7
Figure 7. Anti-proliferative effect of NTAPP on doxorubicin-resistant cancer cells.
(A–D) (A, B) HCT15/CLO2 (C, D) and MES-SA/dx5 cells were exposed with 5 V input NTAPP for 30 s every h 10 times, and cell viability was evaluated at each indicated exposure frequency. Incubation time indicates the time after the initial NTAPP exposure. The 24-h incubation was prepared with 10 repetitive exposures of NTAPP and further incubation for 15 h. (A, C) The relative percentage of viable cells is shown compared with the initial cell number prior to the exposure and incubation as 100%. Viable cells were quantified with MTT assays, and data are shown as the mean ± SEM from three independent experiments. p<0.01 (**) indicates a significant difference compared with the control. (B, D) For the same NTAPP-exposed samples of (A) and (C), respectively, γ-H2AX, caspase-3, cleaved caspase-3, PARP, and cleaved PARP were assessed by western blot analyses. Actin is shown as a loading control for western blot.

References

    1. Elmore S (2007) Apoptosis: a review of programmed cell death. Toxicol Pathol 35: 495–516. - PMC - PubMed
    1. Amundson SA, Myers TG, Fornace AJ Jr (1998) Roles for p53 in growth arrest and apoptosis: putting on the brakes after genotoxic stress. Oncogene 17: 3287–3299. - PubMed
    1. Fridman JS, Lowe SW (2003) Control of apoptosis by p53. Oncogene 22: 9030–9040. - PubMed
    1. Hussain SP, Amstad P, He P, Robles A, Lupold S, et al. (2004) p53-induced up-regulation of MnSOD and GPx but not catalase increases oxidative stress and apoptosis. Cancer Res 64: 2350–2356. - PubMed
    1. Yoon KA, Nakamura Y, Arakawa H (2004) Identification of ALDH4 as a p53-inducible gene and its protective role in cellular stresses. J Hum Genet 49: 134–140. - PubMed

Publication types

MeSH terms