. 2014 Apr 24:4:4770.
doi: 10.1038/srep04770.

Career on the move: geography, stratification, and scientific impact

Affiliations

Career on the move: geography, stratification, and scientific impact

Pierre Deville et al. Sci Rep. .

Abstract

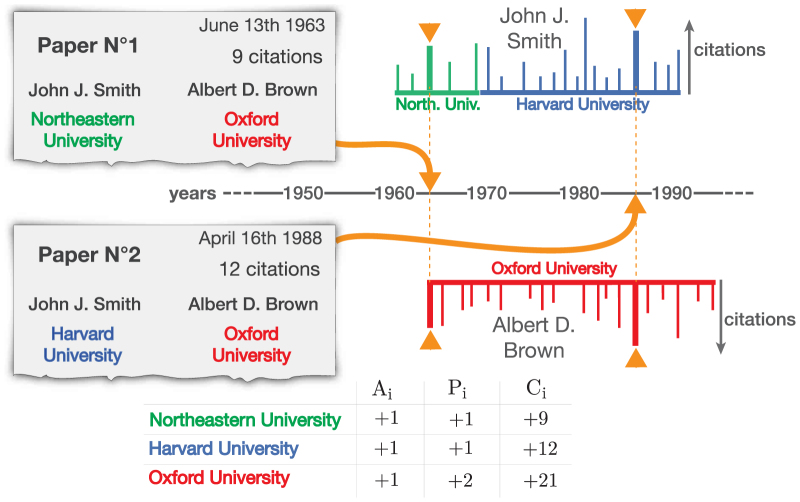
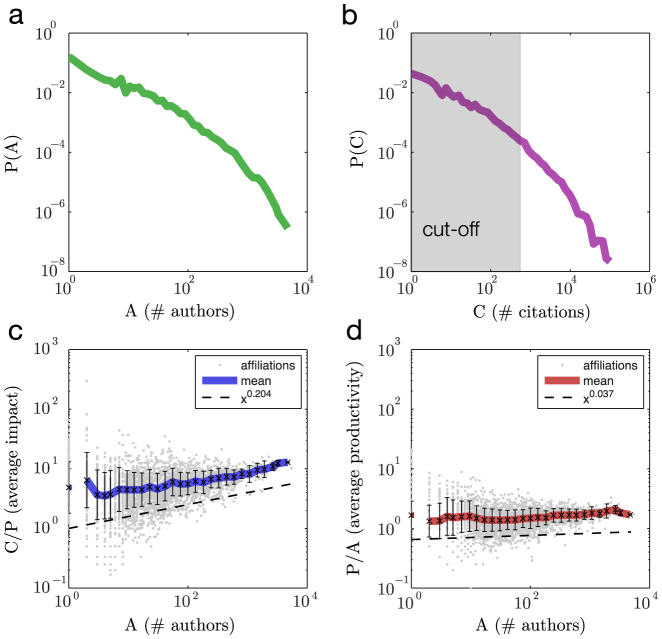
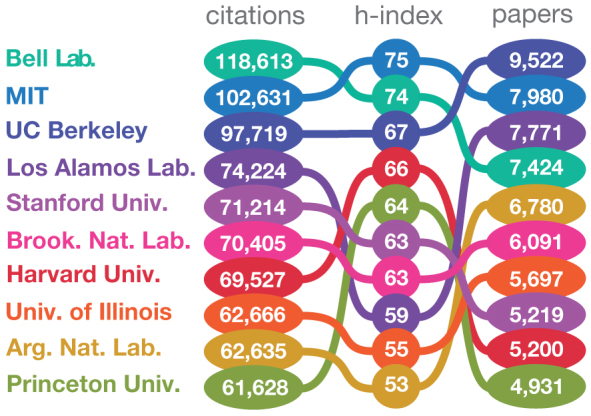
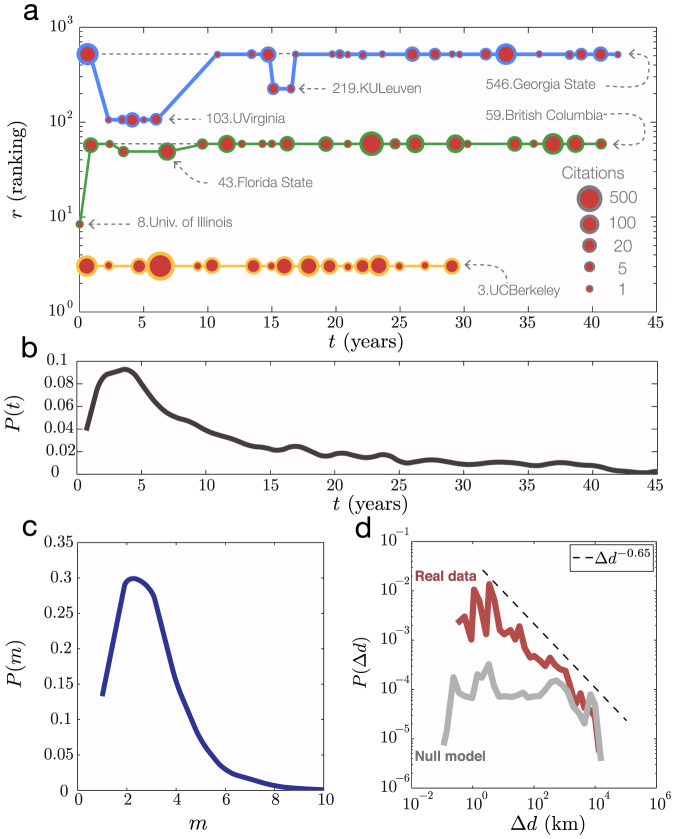
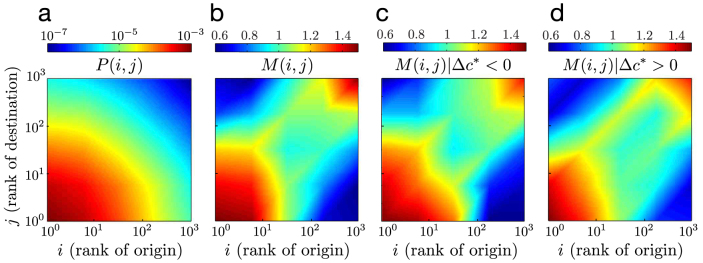
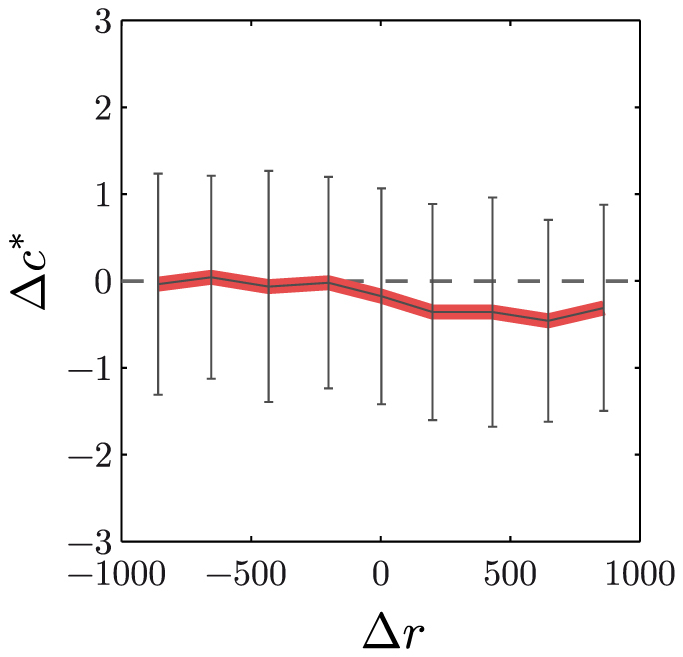
Changing institutions is an integral part of an academic life. Yet little is known about the mobility patterns of scientists at an institutional level and how these career choices affect scientific outcomes. Here, we examine over 420,000 papers, to track the affiliation information of individual scientists, allowing us to reconstruct their career trajectories over decades. We find that career movements are not only temporally and spatially localized, but also characterized by a high degree of stratification in institutional ranking. When cross-group movement occurs, we find that while going from elite to lower-rank institutions on average associates with modest decrease in scientific performance, transitioning into elite institutions does not result in subsequent performance gain. These results offer empirical evidence on institutional level career choices and movements and have potential implications for science policy.


Figures

Figure 1
Figure 1. Illustrative example of career trajectory reconstruction for hypothetical authors.
Given the paper N°1 and N°2, we know that the author John J. Smith was affiliated to Northeastern University in 1963 and Harvard University in 1988. Extracting information from all his other publications allows us to reconstruct his career trajectory and discover that he was affiliated to Northeastern University for 8 years where he published 5 papers and then moved to Harvard University for 23 years where he published 16 papers. The cumulative number of citations of a paper obtained within 5 years after the publication is also known.
Figure 2
Figure 2. Basic features of research institutions.
(a) The probability density function of institution size, A, follows a fat tailed distribution, indicating a significant heterogeneity. While most institutions size are small, a few have a large population, often representing large institutes or universities with a long history. (b) The probability density function of citations of institutions, C, is also very heterogeneous. Few institutions acquired a large number of citations, while most research labs or universities received few citations. Only the first thousand locations are taken into account in further analyses (shaded area). (c) The correlation between institution size and average publication impact is reported. Institution size positively correlates with the impact of publications (R2 = 0.9), indicating that large institutions offer a more innovative/higher impact environment than smaller ones as captured by citations per paper. The dashed line indicates a power-law behaviour with exponent α = 0.204 ± 0.006 (d) The correlation between institution size and institution average productivity is also reported, indicating institution size has little influence on productivity (R2 = 0.43). The dashed line indicates a power-law behaviour with exponent α = 0.037 ± 0.003.
Figure 3
Figure 3. Ten most cited institutions in physics.
Comparison between different rankings. The H-index is closely related to the number of citations as we can observe. Top-ranked institutions all correspond to well-known universities or research labs with long tradition of excellence in physics, corroborating our hypothesis that C is a reasonable proxy for ranking.
Figure 4
Figure 4. Basic features of scientists career.
(a) Illustration of three scientific trajectories based on publications where each line corresponds to one scientist and each publication is represented by a circle whose size is proportional to its number of citations cumulated within 5 years after its publication. The institutions are ranked according to the total number of citations they obtained (see Methods), 1 being the most cited institution. (b) The probability density function of movement according to time, P(t), shows that most movements occurred in the early stage of the career. This likely corresponds to the postdoc period where graduates broaden their horizons through mobility. (c) The probability density function of number of visited institutions for a scientist along his career, P(m), indicates that career movements are common but infrequent. Scientists mostly move once or twice, P(m) decaying quickly as m increases. (d) The probability density function of distance of movements, Pd), has a fat-tail that can be fitted by a power law with an exponent γ = 0.65 ± 0.053, whereas the null model predicts this probability to be roughly flat.
Figure 5
Figure 5. Stratification of career movement.
(a) The matrix of probability to have a transition from rank i to rank j, (1 being the top institution) indicates that most movements involve elite institutions (rank is small) while transitions between bottom institutions are rather rare. (b) The likelihood M(i, j) for a move to take place by accounting for the size of the institutions is characterized by a high degree of stratification in institutional rankings. Indeed, we observe two distinct clubs (red regions), indicating that the overrepresented movements are the ones within elite institutions (lower-left corner) or within lower-rank institutions (upper-right corner), and scientists belonging to one of the two groups tend to move to institutions within the same group. (c) – (d) The Likelihood M(i, j)|Δc* < 0 and M(i, j)|Δc* > 0 for transitions resulting in higher and lower scientific impact, respectively, indicates that the stratification in career moves is robust against individual performance. We find the red region in lower-left corner is more concentrated in Fig. 5d than in c, hinting that being more mobile in the space of rankings may lead to variable performance.
Figure 6
Figure 6. Impact of movements on career performance.
The relation between the statistical difference of citations (Δc*) and the ranking difference (Δr) associated to a transition shows that, when people move to institutions with a lower rank (Δr > 0), their average change in performance is negative, corresponding to a decline in the impact of their work. Yet, what is particularly interesting lies in the Δr < 0 regime. Indeed, when people move from lower rank location to elite institutions, we observe no performance change on average.

Similar articles

Cited by

References

    1. Auriol L. Labour market characteristics and international mobility of doctorate holders: results for seven countries. OECD STI Working Papers 2, 37–37 (2007).
    1. Auriol L. Careers of doctorate holders: employment and mobility patterns. OECD STI Working Papers 4, 30–30 (2010).
    1. Van Noorden R. Global mobility: Science on the move. Nature 490, 326–329 (2012). - PubMed
    1. Schiermeier Q. Career choices: The mobility imperative. Nature 470, 563–564 (2011). - PubMed
    1. Jans G. et al. Study on mobility patterns and career paths of eu researches. Tech. Rep., European Commission (2010).

Publication types

LinkOut - more resources