. 2014 Apr 23:5:3729.
doi: 10.1038/ncomms4729.

Oncogenic Ras induces inflammatory cytokine production by upregulating the squamous cell carcinoma antigens SerpinB3/B4

Affiliations

Oncogenic Ras induces inflammatory cytokine production by upregulating the squamous cell carcinoma antigens SerpinB3/B4

Joseph M Catanzaro et al. Nat Commun. .

Abstract

Mounting evidence indicates that oncogenic Ras can modulate cell autonomous inflammatory cytokine production, although the underlying mechanism remains unclear. Here we show that squamous cell carcinoma antigens 1 and 2 (SCCA1/2), members of the Serpin family of serine/cysteine protease inhibitors, are transcriptionally upregulated by oncogenic Ras via MAPK and the ETS family transcription factor PEA3. Increased SCCA expression leads to inhibition of protein turnover, unfolded protein response, activation of NF-κB and is essential for Ras-mediated cytokine production and tumour growth. Analysis of human colorectal and pancreatic tumour samples reveals a positive correlation between Ras mutation, enhanced SCCA expression and IL-6 expression. These results indicate that SCCA is a Ras-responsive factor that plays an important role in Ras-associated cytokine production and tumorigenesis.


Figures

Figure 1
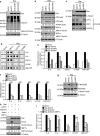
Figure 1. Oncogenic Ras up-regulates SCCA expression
(a) Indicated oncogenes were stably expressed in IMR90 cells. Whole cell lysates were obtained and analyzed by western blot with indicated antibodies. (b) Total RNA was extracted from vector-control or RasV12-expressing IMR90 cells. SCCA1 and SCCA2 transcript levels were analyzed via qRT-PCR, and normalized to that in vector control cells. Data shown are mean + SEM of three independent experiments performed in triplicate. (c, d) IMR90 cells expressing the ER:RasV12 fusion protein were treated with 4-OHT for 8 d, split and either cultured in media containing 4-OHT or withdrew 4-OHT for additional 4 d. (c) Whole cell lysates were analyzed by western blot with indicated antibodies. (d) Total RNA was extracted and SCCA1 and SCCA2 transcript levels were analyzed via qRTPCR, and normalized to that of Day 12 ER:Ras with 4-OHT cells. Data shown are mean + SEM of three independent experiments performed in triplicate. (e) Indicated oncogenic Ras proteins were stably expressed in IMR90 cells. Whole cell lysates were obtained and analyzed by western blot with indicated antibodies. (f) HRasV12 was stably expressed in IMR90 and BJ cell lines. KRasV12 was stably expressed in HT-29, Caco-2, and HeLa cells. Whole cell lysates were obtained and analyzed by western blot with indicated antibodies. *p<0.05; ***p<0.001 by t-test.
Figure 2
Figure 2. DNA damage-induced and replicative senescence fail to up-regulate SCCA
(a, b) IMR90 cells were treated with vehicle-control, etoposide (10 μM) for 48 h, H2O2 (10 μM) for 1 h, or stably transduced with HRasV12, then analyzed 7 d post-treatment. (a) Cells were stained for β-Gal activity. Representative images are shown. (b) Whole cell lysates were analyzed by western blot with indicated antibodies. (c, d) IMR90 cells were continuously passaged, and harvested at passage 15 as early passage (EP) or at passage 30 as late passage. (c) Cells were stained for β-galactosidase activity. Representative images are shown. (d) Whole cell lysates were analyzed by western blot with indicated antibodies. Note that while all the conditions induce cellular senescence, only RasV12 led to SCCA expression. Scale bar = 100 μM
Figure 3
Figure 3. SCCA up-regulation is mediated by MAPK/PEA3
(a, b) Vector-control or HRasV12-expressing IMR90 cells were treated with either vehicle control or AKTi (10 μM) for 24 h. (a) Whole cell lysates were analyzed by western blot with indicated antibodies. (b) Total RNA was extracted and SCCA1 and SCCA2 transcript levels were analyzed via qRT-PCR, and normalized to RasV12 cells treated with vehicle control. Data shown are mean + SEM of two independent experiments performed in triplicate. (c, d) Vector-control or HRasV12-expressing IMR90 cells were treated with either vehicle control (DMSO) or U1026 (MEKi, 10 μM) for 24 h. (c) Whole cell lysates were analyzed by western blot with indicated antibodies. (d) Total RNA was extracted and SCCA1 and SCCA2 transcript levels were analyzed via qRT-PCR, and normalized to that of Ras-expressing cells treated with vehicle. Data shown are mean + SEM of three independent experiments performed in triplicate. (e-g) Vector-control or HRasV12-expressing IMR90 cells were stably infected with lentiviral shNTC (non-target control) or shPEA3. (e) Successful silencing of PEA3 was confirmed via qRT-PCR, and normalized to that in vector control cells with shNTC. Data shown are mean + SEM of three independent experiments performed in triplicate. (f) Whole cell lysates were analyzed through western blot with indicated antibodies. (g) Total RNA was analyzed for the transcript levels of SCCA1 and SCCA2 via qRT-PCR, and normalized to that in Ras-expressing cells with shNTC. Data shown are mean + SEM of three independent experiments performed in triplicate. **p<0.01; ***p<0.001; NS, non-significant by t-test.
Figure 4
Figure 4. SCCA modulates Ras-induced cytokine production
(a-f) Vector-control or HRasV12–expressing IMR90 cells were stably infected with lentiviral shRNA control (shNTC) or two independent hairpins targeting SCCA. (a, b) Whole cell lysates were analyzed by western blot with indicated antibodies. (c) Cells were transfected with an NF-κB luciferase reporter and a renilla luciferase construct. 24 h post-transfection, cells were lysed and luminescence was quantified. NF-κB luciferase activity was standardized based on renilla luciferase activity and normalized to that of vector-control cells. Data shown are mean + SEM of three independent experiments performed in triplicate. (d) Culture media were collected and subjected to a cytokine antibody array. The representative of two independent blots of indicated cytokines are shown. (e) The relative amount of cytokines was quantified and normalized to that of RasV12-shNTC cells. (f) Total RNA was extracted and cytokine transcript levels were analyzed via qRT-PCR, and normalized to that of RasV12-shNTC cells. Data shown are mean + SEM of three independent experiments performed in triplicate. (g) Ras-shSCCA cells were treated with TNFα (50 ng/μl) for 16 h. Total RNA was extracted and cytokine transcript levels were analyzed via qRT-PCR, and normalized to that of RasV12-shNTC cells. Data shown are mean + SEM of two independent experiments performed in triplicate. *p<0.05; **p<0.01; ***p < 0.001 by t-test.
Figure 5
Figure 5. Silencing of SCCA does not interfere with the DNA damage response
(a-c) Vector-control or HRasV12-expressing IMR90 cells were stably infected with lentiviral shRNA control (shNTC) or two independent hairpins targeting SCCA (same cells as shown in Fig. 4). (a) Immunofluorescence against γH2A.X was performed. Representative images are shown; scale bar = 20 μM. (b) Quantification of percent γH2A.X-positive cells is shown. Note that silencing of SCCA does not compromise Ras-induced DNA damage. Data shown are mean + SEM of three independent experiments. (c) Cells were cultured with BrdU (10 μM) for 6 h and immunofluorescence against BrdU was performed. Quantification of BrdU-positive and senescence associated heterochromatic foci (SAHF)-positive cells are shown. Data shown are mean + SEM of three independent experiments. NS, non-significant by t-test.
Figure 6
Figure 6. SCCA promotes cytokine production by inducing UPR
(a, b) Vector-control or HRasV12-expressing IMR90 cells were stably infected with lentiviral shRNA control (shNTC) or two independent hairpins targeting SCCA. Whole cell lysates were analyzed by western blot with indicated antibodies. Quantification of the ubiquitin blot in (a) was performed by Image J using the full-length of each lane. (c-g) Vector control or HRasV12 IMR90 cells were stably infected with lentiviral shRNA control (shNTC) or shRNA hairpins targeting ATF6 or XBP1. (c, g) Whole cell lysates were analyzed by western blot with indicated antibodies. (d) Culture media were collected and subjected to a cytokine antibody array. The blots of indicated cytokines are shown. (e) The relative amount of cytokines was quantified and normalized to that of RasV12-shNTC cells. (f) Total RNA was extracted and cytokine transcript levels were analyzed via qRT-PCR and normalized against that in RasV12-shNTC cells. Data shown are mean + SEM of three independent experiments performed in triplicate. (h, i) Vector-control or HRasV12 IMR90 cells were stably infected with lentiviral shRNA control (shNTC) or shSCCA, together with vector control or XBP1s-expressing construct. (h) Whole cell lysates were analyzed by western blot with indicated antibodies. (i) Total RNA was extracted and cytokine transcript levels were analyzed via qRT-PCR and normalized against that in RasV12-shNTC cells. Data shown are mean + SEM of three independent experiments performed in triplicate. **p<0.01; ***p<0.001; NS, non-significant by t-test.
Figure 7
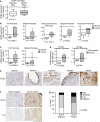
Figure 7. SCCA is up-regulated in human colorectal and pancreatic cancer
(a) TCGA human colorectal cancer data of somatic mutation and RNA expression from Broad Institute's Genome Data Analysis Center were analyzed. There were 207 human colorectal tumors that have both somatic mutation and mRNA expression data available. KRas was mutated in 87 out of the 207 samples. By comparing SCCA mRNA expression level of the groups with wild-type and mutated KRas, SCCA expression was found to be significantly higher in the group with KRas mutation. Boxplots with whisker from 10 to 90 percentile is shown. SCCA expression log2 intensity values for wild-type (n=120) and mutant (n=87) KRas samples are shown. p = 0.012 by Wilcoxon Rank Sum test. (b-d) Oncomine (www.oncomine.org) datasets were analyzed for SCCA1 (b) or SCCA2 (c) mRNA expression levels in normal pancreatic tissue and pancreatic cancer, or for SCCA1 and SCCA2 mRNA expression levels in chronic pancreatitis and pancreatic cancer (d). The boxes represent the interquartile range. Whiskers represent the 10th–90th percentile range. Bars represent the median. p values were calculated by two-sample t-test. (e-g) IHC against SCCA and IL-6 was performed on the corresponding serial pancreatic tissue microarrays. (e) Representative images of normal pancreatic tissue and SCCA-positive PanIN1, PanIN2, PanIN3, and PDAC samples are shown; scale bar = 100 μM. (f) Representative images of SCCA/IL-6-negative and SCCA/IL-6-positive grade III PDAC samples; scale bar = 50 μM. (g) Quantification of IL-6 staining in SCCA-negative and SCCA-positive samples. Chi-squared test for trend was used to determine significance, p = 0.0385.
Figure 8
Figure 8. Ras-dependent SCCA expression promotes IL-6 production and tumorigenesis in human pancreatic cancer cell lines
(a) Whole cell lysates from a panel of pancreatic cancer cells were obtained and analyzed through western blot with indicated antibodies. (b) Indicated cell lines were stably infected with lentiviral shNTC or shKRas. Whole cell lysates were analyzed through western blot with indicated antibodies. Note that the Ras antibody utilized is a pan-Ras antibody and KRas is indicated by arrowhead. Total RNA was extracted and SCCA1 and SCCA2 transcript levels were analyzed via qRT-PCR and normalized to that of shNTC cells. Data shown are mean + SEM of three independent experiments performed in triplicate. (c) Indicated cell lines were stably infected with lentiviral shNTC or shSCCA. Whole cells lysates were analyzed through western blot with indicated antibodies. Total RNA was extracted and IL-6 transcript levels were analyzed via qRT-PCR. Data shown are mean + SEM of three independent experiments performed in triplicate. Relative level of transcript was normalized to that of shNTC cells. Note that silencing of SCCA in PANC-1 cells, which have undetectable SCCA expression, had virtually no effect on IL-6 production. (d) CFPAC-1, L3.6, and HPAF-II cells were injected into the flanks of athymic nude mice and monitored for tumor growth; n = 5. Representative images of tumor and the tumor growth curve ± SEM are shown; scale bar = 1 cm. *p < 0.05, **p < 0.01, ***p < 0.001 by t-test.

Similar articles

Cited by

References

    1. Bos JL. ras oncogenes in human cancer: a review. Cancer Res. 1989;49:4682–4689. - PubMed
    1. Downward J. Targeting RAS signalling pathways in cancer therapy. Nat Rev Cancer. 2003;3:11–22. - PubMed
    1. Sparmann A, Bar-Sagi D. Ras-induced interleukin-8 expression plays a critical role in tumor growth and angiogenesis. Cancer Cell. 2004;6:447–458. - PubMed
    1. Pylayeva-Gupta Y, Lee KE, Hajdu CH, Miller G, Bar-Sagi D. Oncogenic Kras-induced GM-CSF production promotes the development of pancreatic neoplasia. Cancer Cell. 2012;21:836–847. - PMC - PubMed
    1. Kuilman T, et al. Oncogene-induced senescence relayed by an interleukin-dependent inflammatory network. Cell. 2008;133:1019–1031. - PubMed

Publication types

MeSH terms