. 2014 Jun 1;192(11):5012-22.
doi: 10.4049/jimmunol.1302943. Epub 2014 Apr 23.

Ezh2 regulates transcriptional and posttranslational expression of T-bet and promotes Th1 cell responses mediating aplastic anemia in mice

Affiliations

Ezh2 regulates transcriptional and posttranslational expression of T-bet and promotes Th1 cell responses mediating aplastic anemia in mice

Qing Tong et al. J Immunol. .

Abstract

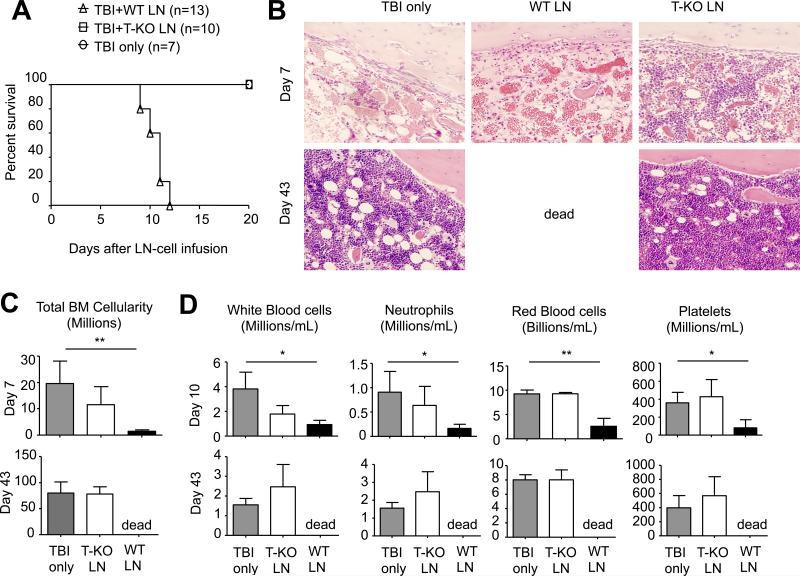
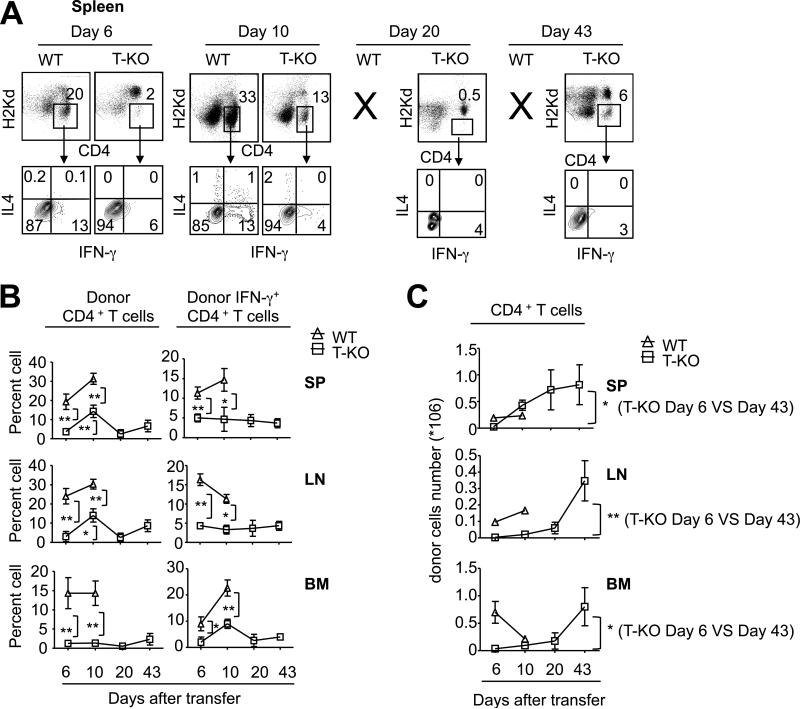
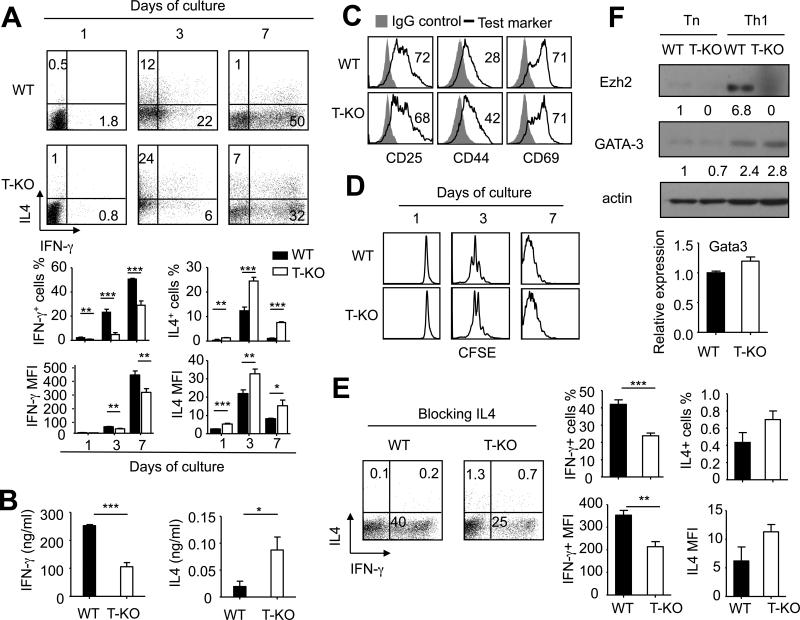
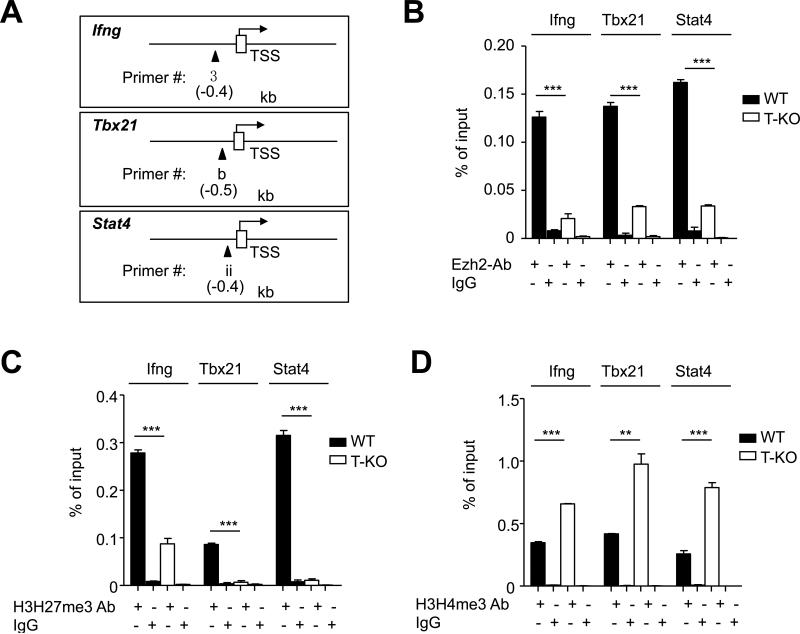
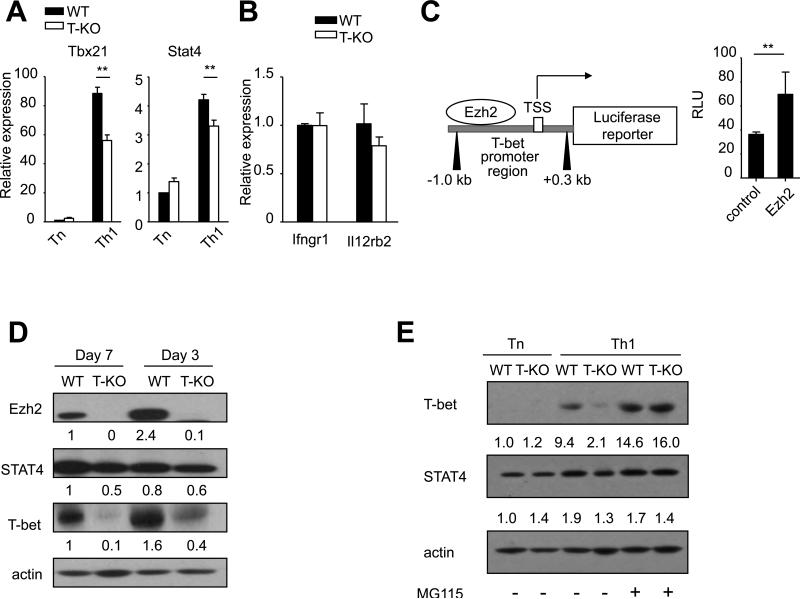
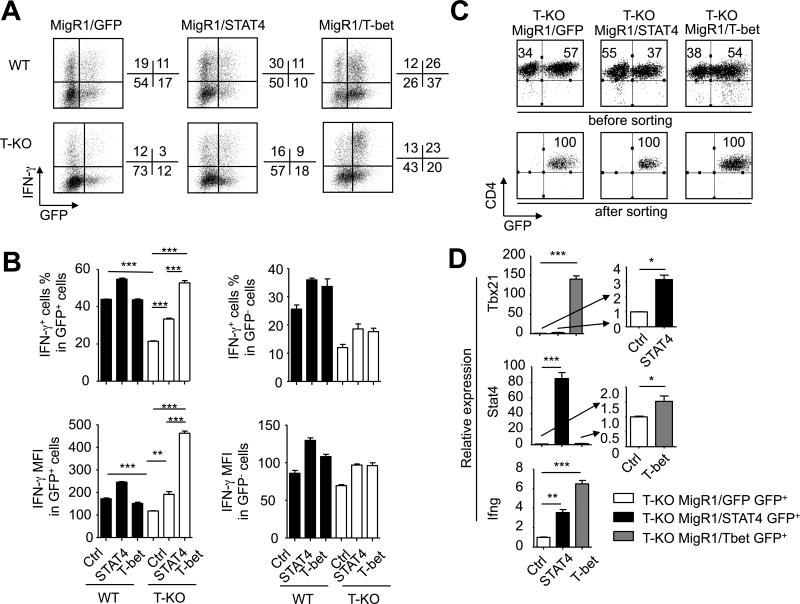
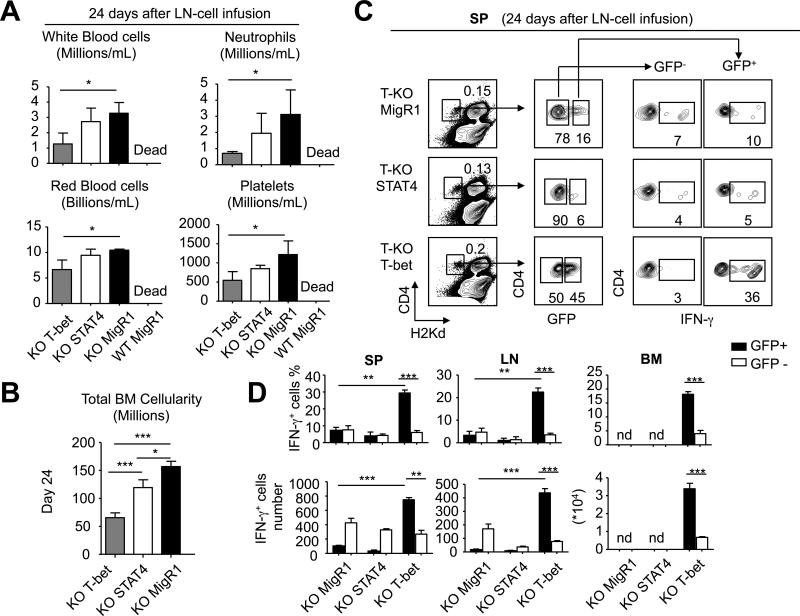
Acquired aplastic anemia (AA) is a potentially fatal bone marrow (BM) failure syndrome. IFN-γ-producing Th1 CD4(+) T cells mediate the immune destruction of hematopoietic cells, and they are central to the pathogenesis. However, the molecular events that control the development of BM-destructive Th1 cells remain largely unknown. Ezh2 is a chromatin-modifying enzyme that regulates multiple cellular processes primarily by silencing gene expression. We recently reported that Ezh2 is crucial for inflammatory T cell responses after allogeneic BM transplantation. To elucidate whether Ezh2 mediates pathogenic Th1 responses in AA and the mechanism of Ezh2 action in regulating Th1 cells, we studied the effects of Ezh2 inhibition in CD4(+) T cells using a mouse model of human AA. Conditionally deleting Ezh2 in mature T cells dramatically reduced the production of BM-destructive Th1 cells in vivo, decreased BM-infiltrating Th1 cells, and rescued mice from BM failure. Ezh2 inhibition resulted in significant decrease in the expression of Tbx21 and Stat4, which encode transcription factors T-bet and STAT4, respectively. Introduction of T-bet but not STAT4 into Ezh2-deficient T cells fully rescued their differentiation into Th1 cells mediating AA. Ezh2 bound to the Tbx21 promoter in Th1 cells and directly activated Tbx21 transcription. Unexpectedly, Ezh2 was also required to prevent proteasome-mediated degradation of T-bet protein in Th1 cells. Our results demonstrate that Ezh2 promotes the generation of BM-destructive Th1 cells through a mechanism of transcriptional and posttranscriptional regulation of T-bet. These results also highlight the therapeutic potential of Ezh2 inhibition in reducing AA and other autoimmune diseases.


Figures

Fig.1
Fig.1. In the absence of Ezh2, LN cells are defective in mediating AA in mice
WT B6 LN (10×106) or T-KO LN (10×106) cells were injected into irradiated BDF1 mice (6.5Gy). (A) The survival was monitored over time. (B) Histology analysis of BM from each group 7 or 43 days after LN-cell infusion. (C) Total BM cellularity was calculated assuming that bilateral tibia and femurs contain 25% of total marrow cells (mean ± SD, n=6 to 8 mice per group). (D) Peripheral blood was collected 10 or 43 days after LN-cell infusion and the cell number of RBC, WBC, platelets and neutrophils were calculated (mean ± SD, n=6 to 8 mice per group). Data are representative of two independent experiments. *, P<0.05, **, P<0.01.
Fig.2
Fig.2. Loss of Ezh2 results in selective impairment of Th1 cell development in vivo during AA induction
WT B6 LN (10×106) or T-KO LN (10×106) were injected into irradiated BDF1 mice (6.5Gy). 7 days after transfer, spleen, LN and BM were isolated, and donor derived CD4+ T cells were analyzed for the expression of IFN-γ and IL-4 (A-B). (A) Dot plots and graphs show the percentage and the mean fluorescence intensity (MFI) of donor CD4+ T cells producing cytokines. (B) Bar graphs show the number of donor CD4+ IFN-γ+ T cells. (C) Seven days after transfer, donor derived CD4+ T cells were sorted for the analysis of gene expression. Data are representative of two independent experiments with each group containing 4 to 6 mice. Error bars indicate mean ± SD. *, P<0.05, **, P<0.01, ***, P<0.001.
Fig.3
Fig.3. Tracking the longitudinal proliferation and differentiation of transferred WT and T-KO LN cells in vivo
WT B6 LN (10×106) or T-KO LN (10×106) cells were injected into irradiated BDF1 mice (6.5Gy). Spleen, LN and BM were isolated to measure cytokine production in donor derived CD4+ T cells at day 6, day 10, day 20 and day 43 after transfer, respectively (A-C). (A) Dot plots show the percentage of cytokine-producing donor CD4+ T cells in the spleen. (B) Graphs show the percentage of donor CD4+ T cells (left panel) and donor IFN-γ+CD4+ T cells (right panel). (C) Graphs show the total number of donor CD4+ T cells. Data are representative of two independent experiments with each group containing 4 to 6 mice. Error bars indicate mean ± SD. *, P<0.05, **, P<0.01.
Fig.4
Fig.4. Ezh2 promotes in vitro Th1 cell differentiation in cultures under Th1-skewing conditions
Naive CD4+ T cells isolated from WT B6 and T-KO mice were stimulated with anti-CD3 and anti-CD28 Abs under Th1-skewing condition. Cells were collected at the indicated time for analysis. (A) Dot plots (upper panel) and graphs (lower panel) show the fraction and MFI of IFN-γ- and/or IL4-producing cells. (B) ELISA assays show the level of IFN-γ and IL-4 in the culture medium at day 7 after restimulation with anti-CD3 Ab. Each group contained equal number of T cells (1×10⁶ cells/ml). (C) Naïve CD4+ T cells isolated from WT B6 or T-KO mice were pre-stained with CFSE and stimulated with anti-CD3 and anti-CD28 Abs. Two days after culture, cells were collected for the analysis of T cell activation markers. (D) Histograms show the cell divisions at the indicated time after culture. (E) Naive CD4+ T cells isolated from WT B6 and T-KO mice were stimulated with anti-CD3 and anti-CD28 Abs under Th1-skewing condition together with anti-IL-4 Ab (10μg/ml) for 7 days. Dot plots (left panel) and graphs (right panel) show the fraction of IFN-γ- and/or IL4-producing cells. (F) Naive CD4+ T cells before (Tn) and after cultured under Th1-skewing condition for 7 days (Th1) were harvested and lysed for western blot analysis (upper panel). The relative expression level of each protein was indicated under the band, which was determined by densitometry analysis. Seven days after culture, the indicated gene expression was analyzed in WT and T-KO cells (lower panel). Data are representative of two independent experiments. Error bars indicate mean ± SD. *, P<0.05, **, P<0.01, ***, P<0.001.
Fig.5
Fig.5. Ezh2 associates with the promoter regions of type-1 gene loci
Freshly isolated WT CD4+ T cells (Tn) and WT CD4+ T cells after 7 days culture in Th1-skewing conditions (Th1) were processed for ChIP using Abs specific for H3K27me3, H3K4me3, Ezh2 and control IgG (A-B). (A) The graphs show the ChIP-qPCR for H3K27me3 or H3K4me3 binding to the promoter region of Ifng, Tbx21 or Stat4. (B) Schematic representation of the mouse Ifng, Tbx21 or Stat4 locus (upper panel). Open rectangles indicate the transcriptional start site. Closed triangles show the locations of real-time quantitative PCR primer pairs used in the ChIP assay, which are indicated in relative kilobases to the transcriptional start site. The graphs (lower panel) show the ChIP-qPCR for Ezh2 binding, with a serious of primer pairs shown above covering the regulatory and promoter region of Ifng, Tbx21 or Stat4 locus. (C) Graphs show the relative expression of indicated genes measured by realtime PCR in freshly isolated WT CD4+ T cells (Tn) and WT CD4+ T cells after 7 days culture in Th1-skewing conditions (Th1). (D) Dot plots show the fraction of IFN-γ- and/or Ezh2-expressing cells in freshly isolated WT CD4+ T cells (Tn) and WT CD4+ T cells after 7 days culture in Th1-skewing conditions (Th1). Data are representative of three independent experiments. Error bars indicate mean ± s.d. **, P <0.01, ***, P <0.001.
Fig.6
Fig.6. Ezh2 specifically binds to promoter regions of Th1 type gene loci
WT and T-KO CD4+ T cells collected 7 days after culture under Th1-skewing conditions and processed for ChIP using antibodies specific for Ezh2, H3K27me3, and H3K4me3. (A) A schematic of the primer regions in the mouse Ifng, Tbx21 or Stat4 locus. Open rectangles indicate the transcriptional start site (TSS). Closed triangles show the locations of real-time PCR primer pairs used for ChIP assay. (B-D) The graphs show the relative amount of Ezh2, H3K27me3, H3K4me3 and IgG at the regions of Ifng, Tbx21 or Stat4 locus.
Fig.7
Fig.7. Ezh2 regulates T-bet at both the transcriptional level and post-translational level
(A) Graphs show the gene expression of Stat4 and Tbx21 in freshly isolated WT or T-KO CD4+ T cells (Tn) and cells after 7 days culture in Th1-skewing conditions (Th1). (B) The Graph shows the relative expression of indicated genes measured by realtime PCR in WT or T-KO CD4+ T cells after 7 days culture in Th1-skewing conditions. (C) The schematic (left panel) shows the construction of Tbx21 promoter region ranging from +0.3kb to -1.0kb of the TSS. 3T3 cells were co-transfected with pGL3-Tbx21 reporter plasmid and an empty vector control or Ezh2 in combination. Luciferase reporter activity was normalized to the activity obtained for the cotransfected renilla control. The graph (right panel) represents the relative light units (RLU). (D) Western blot show the expression of Ezh2, Stat4 and T-bet after 3 or 7 days of Th1-skewing culture conditions. The relative expression level of each protein was indicated under the band, which was determined by densitometry analysis. (E) Western blots show the expression of T-bet and STAT4 in freshly isolated WT or T-KO CD4+ T cells (Tn) and cells after 7 days culture in Th1-skewing conditions (Th1) with or without the treatment of MG115 (2μM) for 6 hours. Data are representative of two independent experiments. Error bars indicate mean ± SD **, P <0.01.
Fig.8
Fig.8. Overexpression of T-bet fully rescues T-KO CD4+ T cells to differentiate into Th1 cells
CD4+ Tn isolated from WT B6 and T-KO mice were stimulated with anti-CD3 and anti-CD28 antibodies under Th1-skewing conditions. One day after culture, T cells were infected with retrovirus encoding GFP-STAT4, GFP-T-bet or GFP-control, and then cultured for another 6 days. (A) Dot plots show the fraction of IFN-γ- and/or GFP-expressing cells 7 days after culture. (B) Bar graphs show the percent and MFI of IFN-γ+ cells in GFP+ (left panel) and GFP (right panel) cells after infection. (C) GFP+CD4+ T-KO cells were sorted, and total RNAs were isolated and subjected to real-time PCR analysis. Dot plots show the purity of sorted GFP+ cells. (D) Graphs show the relative expression of indicated genes in sorted donor GFP+CD4+ T cells. Data are representative of two independent experiments. Error bars indicate mean ± SD. *, P<0.05, **, P <0.01, ***, P<0.001.
Fig.9
Fig.9. Introduction of T-bet to T-KO T cells rescues their ability to mediate AA in mice
CD4+ Tn and CD8+ Tn were isolated from WT and T-KO mice and separately cultured in the presence of anti-CD3 Ab (2μg/ml), anti-CD28 Ab (2μg/ml) and IL-2 (10ng/ml). Twenty-four hours later, T-KO T cell subsets were infected with MigR1/T-bet, MigR1/STAT4 and MigR1/GFP, respectively. WT T cell subsets were infected with MigR1/GFP as controls. Thirty-six hours after infection, these T cells were harvested and transferred into sublethally irradiated (6.5Gy) BDF1 mice. Each mouse received unfractionated T cells that contained similar numbers of GFP+ cells (0.8×10⁶ CD4+ T cells + 0.6×10⁶ CD8+ T cells). (A) Peripheral blood was collected 24 days after LN-cell infusion and the cell number of RBC, WBC, platelets and neutrophils were calculated (mean ± SD, n=6 to 8 mice per group). (B) Total BM cellularity was calculated assuming that bilateral tibia and femurs contain 25% of total marrow cells (mean ± SD, n=6 to 8 mice per group). (C) Twenty-four days after LN-cell infusion, donor CD4+ T cells were isolated from the spleen, LN and BM to measure the production of IFN-γ. The plots show the percentage of donor CD4+ T cells in spleen, the percentage of GFP and GFP+ cells, and the fraction of IFN-γ-producing cells in GFP and GFP+ cells. (D) Graphs show the percentage (upper panel) and the number (lower panel) of donor IFN-γ+CD4+ T cells in spleen, LN and BM. *, P<0.05, **, P<0.01, ***, P<0.001.

Similar articles

Cited by

References

    1. Araki Y, Wang Z, Zang C, Wood WH, 3rd, Schones D, Cui K, Roh TY, Lhotsky B, Wersto RP, Peng W, Becker KG, Zhao K, Weng NP. Genome-wide analysis of histone methylation reveals chromatin state-based regulation of gene transcription and function of memory CD8+ T cells. Immunity. 2009;30:912–925. - PMC - PubMed
    1. Bantignies F, Cavalli G. Cellular memory and dynamic regulation of polycomb group proteins. Curr Opin Cell Biol. 2006;18:275–283. - PubMed
    1. Berger SL. The complex language of chromatin regulation during transcription. Nature. 2007;447:407–412. - PubMed
    1. Blazar BR, Murphy WJ, Abedi M. Advances in graft-versus-host disease biology and therapy. Nat Rev Immunol. 2012;12:443–458. - PMC - PubMed
    1. Boyle AP, Davis S, Shulha HP, Meltzer P, Margulies EH, Weng Z, Furey TS, Crawford GE. High-resolution mapping and characterization of open chromatin across the genome. Cell. 2008;132:311–322. - PMC - PubMed

Publication types

MeSH terms

Substances